ReportKoei Tecmo
Financial Highlights: 3rd Quarter of the Fiscal Year Ending March 2021
2 pages~3 min full read
Key insights
7 takeaways · ~3 min read- 01
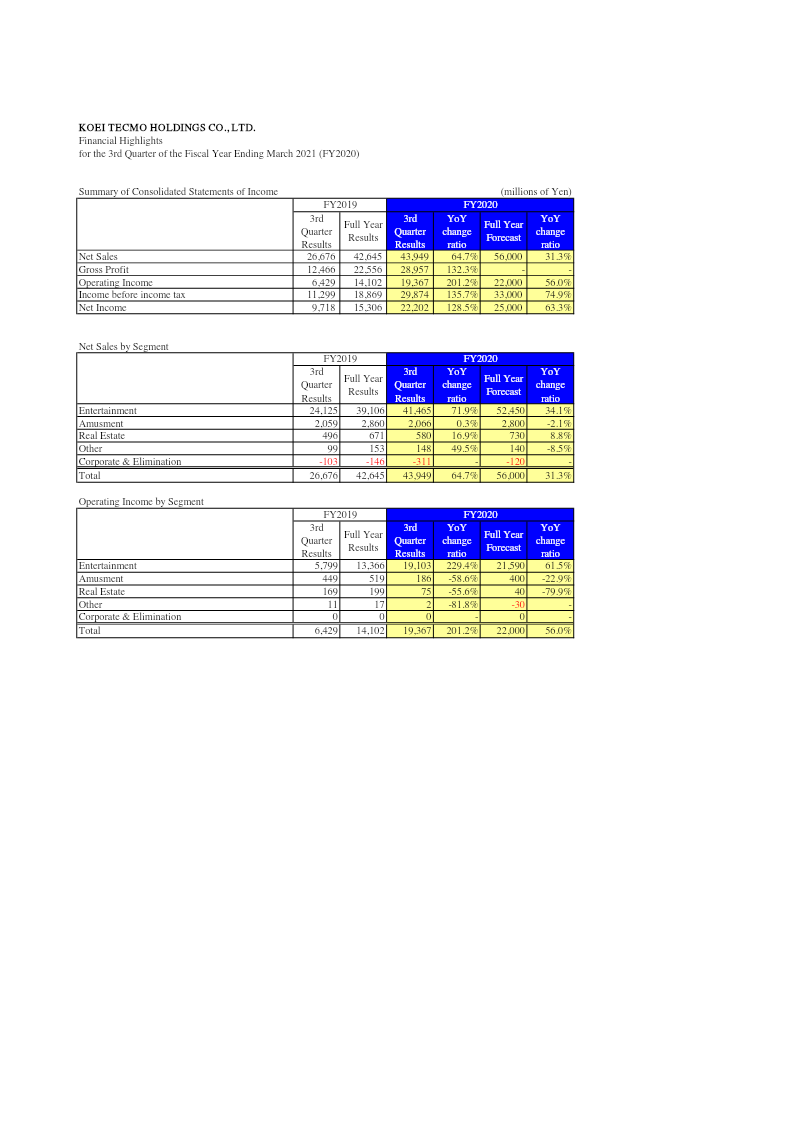
Koei Tecmo Holdings reported significant Q3 FY2020 growth, with net sales rising 64.7% to ¥42.6 billion and net income surging 128.5% to ¥15.3 billion compared to the same period in FY2019.
See it on page 1 - 02
The entertainment segment was the primary growth driver, accounting for 71.9% of total sales and achieving a 229.4% increase in operating income.
See it on page 1 - 03
Full-year forecasts for FY2020 project strong annual performance, with expected sales of ¥56 billion and operating income of ¥22 billion, representing year-on-year increases of 31.3% and 56.0%, respectively.
See it on page 1 - 04
Total assets grew to ¥186.5 billion, fueled primarily by a substantial increase in investment securities from ¥71.4 billion to ¥113.9 billion.
See it on page 2 - 05
Shareholders’ equity reached ¥143.9 billion by the end of the third quarter, supported by retained earnings of ¥103.2 billion and a reduction in treasury stock.
See it on page 1 - 06
While the entertainment segment thrived, the company's amusement and real-estate segments experienced only modest gains or declines during the period.
See it on page 1 - 07
Long-term liabilities increased to ¥5.1 billion, a shift driven largely by the accumulation of deferred tax obligations.
See it on page 2


