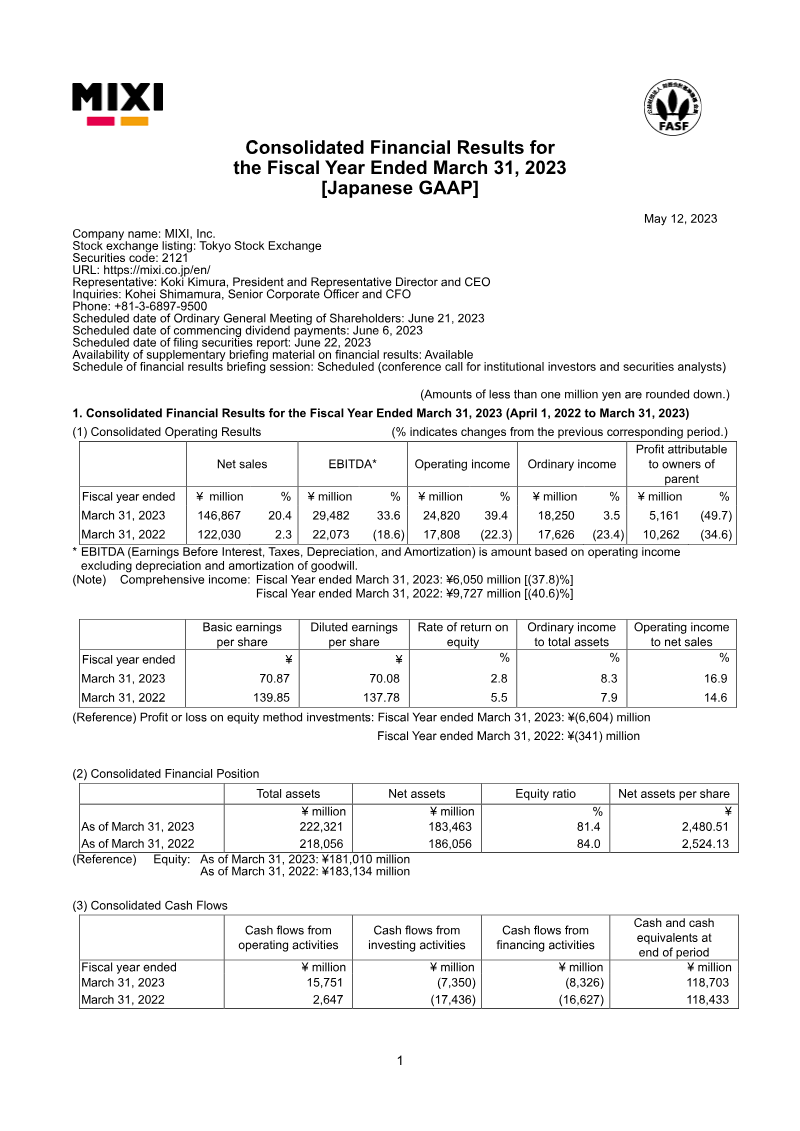
Updated Mar 21, 2026 by mixi
Financial
Published by mixi
Consolidated Financial Results for the Fiscal Year Ended March 31, 2023 Stock exchange listing: Tokyo Stock Exchange Representative: Koki Kimura, President and Representative Director and CEO Inquiries: Kohei Shimamura, Senior Corporate Officer and CFO Scheduled date of Ordinary General Meeting of Shareholders: June 21, 2023 Scheduled date of commencing dividend payments: June 6, 2023 Scheduled date of filing securities report: June 22, 2023 Availability of supplementary briefing material on fin...
FASF Consolidated Financial Results for the Fiscal Year Ended March 31, 2023 [Japanese GAAP] May 12, 2023 Company name: MIXI, Inc. Stock exchange listing: Tokyo Stock Exchange Securities code: 2121 URL: https://mixi.co.jp/en/ Representative: Koki Kimura, President and Representative Director and CEO Inquiries: Kohei Shimamura, Senior Corporate Officer and CFO Phone: +81-3-6897-9500 Scheduled date of Ordinary General Meeting of Shareholders: June 21, 2023 Scheduled date of commencing dividend payments: June 6, 2023 Scheduled date of filing securities report: June 22, 2023 Availability of supplementary briefing material on financial results: Available Schedule of financial results briefing session: Scheduled (conference call for institutional investors and securities analysts) (Amounts of less than one million yen are rounded down.) 1. Consolidated Financial Results for the Fiscal Year Ended March 31, 2023 (April 1, 2022 to March 31, 2023) (1) Consolidated Operating Results (% indicates changes from the previous corresponding period.) Profit attributable Net sales EBITDA* Operating income Ordinary income to owners of parent Fiscal year ended ¥ million % ¥ million % ¥ million % ¥ million % ¥ million % March 31, 2023 146,867 20.4 29,482 33.6 24,820 39.4 18,250 3.5 5,161 (49.7) March 31, 2022 122,030 2.3 22,073 (18.6) 17,808 (22.3) 17,626 (23.4) 10,262 (34.6) * EBITDA (Earnings Before Interest, Taxes, Depreciation, and Amortization) is amount based on operating income excluding depreciation and amortization of goodwill. (Note) Comprehensive income: Fiscal Year ended March 31, 2023: ¥6,050 million [(37.8)%] Fiscal Year ended March 31, 2022: ¥9,727 million [(40.6)%]
rnings Before Interest, Taxes, Depreciation, and Amortization) is amount based on operating income excluding depreciation and amortization of goodwill. (Note) Comprehensive income: Fiscal Year ended March 31, 2023: ¥6,050 million [(37.8)%] Fiscal Year ended March 31, 2022: ¥9,727 million [(40.6)%] Basic earnings Diluted earnings Rate of return on Ordinary income Operating income per share per share equity to total assets to net sales Fiscal year ended ¥ ¥ % % % March 31, 2023 70.87 70.08 2.8 8.3 16.9 March 31, 2022 139.85 137.78 5.5 7.9 14.6 (Reference) Profit or loss on equity method investments: Fiscal Year ended March 31, 2023: ¥(6,604) million Fiscal Year ended March 31, 2022: ¥(341) million (2) Consolidated Financial Position Total assets Net assets Equity ratio Net assets per share ¥ million ¥ million % ¥ As of March 31, 2023 222,321 183,463 81.4 2,480.51 As of March 31, 2022 218,056 186,056 84.0 2,524.13 (Reference) Equity: As of March 31, 2023: ¥181,010 million As of March 31, 2022: ¥183,134 million (3) Consolidated Cash Flows Cash flows from Cash flows from Cash flows from Cash and cash operating activities investing activities financing activities equivalents at end of period Fiscal year ended ¥ million ¥ million ¥ million ¥ million March 31, 2023 15,751 (7,350) (8,326) 118,703 March 31, 2022 2,647 (17,436) (16,627) 118,433
2. Dividends Annual dividends Total Dividend Dividends to Dividends to 1st 2nd 3rd Year- dividends payout ratio shareholders' equity quarter- quarter- quarter- end Total paid (consolidated) equity (consolidated) end end end (annual) (consolidated) ¥ ¥ ¥ ¥ ¥ ¥ million % % % Fiscal year ended – 55.00 – 55.00 110.00 7,980 78.7 4.3 4.4 March 31, 2022 Fiscal year ended – 55.00 – 55.00 110.00 8,024 155.2 4.4 4.4 March 31, 2023 Fiscal year ending March 31, 2024 – 55.00 – 55.00 110.00 – 4.4 (Forecast) (Reference) We will aim for a target consolidated dividends to shareholders’ equity of 5 percent for the fiscal year ending March 31, 2024. 3. Consolidated Earnings Forecast for the Fiscal Year Ending March 31, 2024 (April 1, 2023 to March 31, 2024) (% indicates changes from the previous corresponding period.) Profit attributable Basic Net sales EBITDA Operating income Ordinary income to owners of earnings parent per share ¥ million % ¥ million % ¥ million % ¥ million % ¥ million % ¥ Full year 138,000 (6.0) 16,000 (45.7) 12,000 (51.7) 11,000 (39.7) 7,500 45.3 102.78 * Notes: (1) Changes in significant subsidiaries during the fiscal year ended March 31, 2023 (changes in specified subsidiaries resulting in change in scope of consolidation): No (2) Changes in accounting policies, changes in accounting estimates and retrospective restatement 1) Changes in accounting policies due to the revision of accounting standards: Yes 2) Changes in accounting policies other than 1) above: No 3) Changes in accounting estimates: No 4) Retrospective restatement: No
in accounting policies, changes in accounting estimates and retrospective restatement 1) Changes in accounting policies due to the revision of accounting standards: Yes 2) Changes in accounting policies other than 1) above: No 3) Changes in accounting estimates: No 4) Retrospective restatement: No (3) Total number of issued shares (common shares) 1) Total number of issued shares at the end of the period (including treasury shares): March 31, 2023: 78,230,850 shares March 31, 2022: 78,230,850 shares 2) Total number of treasury shares at the end of the period: March 31, 2023: 5,257,825 shares March 31, 2022: 5,677,300 shares 3) Average number of shares during the period: Fiscal year ended March 31, 2023: 72,837,560 shares Fiscal year ended March 31, 2022: 73,383,614 shares
(Reference) Outline of Non-consolidated Financial Results 1. Non-consolidated Financial Results for the Fiscal Year Ended March 31, 2023 (April 1, 2022 to March 31, 2023) (1) Non-consolidated Operating Results (% indicates changes from the previous corresponding period.) Net sales Operating income Ordinary income Period net income Fiscal year ended ¥ million % ¥ million % ¥ million % ¥ million % March 31, 2023 118,617 15.6 26,048 55.8 25,579 52.0 7,476 (9.9) March 31, 2022 102,598 (3.9) 16,722 (26.1) 16,827 (25.7) 8,299 (49.1) Basic earnings Diluted earnings per share per share Fiscal year ended ¥ ¥ March 31, 2023 102.64 101.50 March 31, 2022 113.10 111.43 (2) Non-consolidated Financial Position Total assets Net assets Equity ratio Net assets per share ¥ million ¥ million % ¥ As of March 31, 2023 206,171 182,873 88.2 2,490.59 As of March 31, 2022 200,470 183,230 90.6 2,504.69 (Reference) Equity: As of March 31, 2023: ¥181,746 million As of March 31, 2022: ¥181,724 million * These financial results are outside the scope of audit by a certified public accountant or audit firm.
arch 31, 2023 206,171 182,873 88.2 2,490.59 As of March 31, 2022 200,470 183,230 90.6 2,504.69 (Reference) Equity: As of March 31, 2023: ¥181,746 million As of March 31, 2022: ¥181,724 million * These financial results are outside the scope of audit by a certified public accountant or audit firm. * Explanation of the proper use of earnings forecast and other notes 1. The earnings forecast in this document are judgments made by MIXI based on information currently available which include latent risks and uncertainties. Please be acknowledged that actual results may differ from these forecasts due to changes in various factors when making investment decisions. 2. MIXI has scheduled a financial results conference call for institutional investors and securities analysts on May 12, 2023. Scene of the session and contents of the presentation will be posted along with the financial results briefing material on MIXI’s website shortly after the session.
KLab Inc. experienced a significant downturn during the third quarter of fiscal year 2025, characterized by an 18.6% year-over-year revenue decline to ¥4.93 billion. This contraction was primarily driven by weakening performance in established titles such as Captain Tsubasa: Dream Team and a general decrease in income from paid users within the game business. Despite aggressive cost-cutting measures and a ¥1.57 billion gain from the sale of investment securities, the company recorded a substantial net loss of ¥3.97 billion. This loss was largely precipitated by a massive ¥4.42 billion impairment charge on software assets related to EA SPORTS FC™ TACTICAL and a reduction in goodwill following the divestment of GlobalGear Co. Ltd. The financial strain resulted in a decrease of over ¥3.1 billion in total net assets, though the company mitigated some impact by raising approximately ¥719 million through the exercise of stock acquisition rights. While four consecutive years of operating deficits have prompted scrutiny regarding the company’s status as a going concern, management asserts that no material uncertainty exists. This confidence is based on steady progress with major intellectual properties, including Dragon Quest and My Hero Academia, alongside a strategic pivot toward generative AI and blockchain ventures to diversify future revenue streams. Operating within the Japanese market during a period of rapid industry volatility, the company has withheld future performance forecasts. The current strategy focuses on maintaining liquidity through strict cost controls and asset sales while transitioning the business model to leverage emerging technologies. Despite the current net losses and the impairment of software in progress, the segment profit of ¥592 million suggests that core operations remain functional as the group attempts to stabilize its capital position and return to long-term profitability.
KLab Inc. experienced a challenging first half of the fiscal year ending December 31, 2025, characterized by a 12.9% year-over-year revenue decline to 3,161 million yen and a substantial net loss of 4,748 million yen. This loss was primarily driven by a 4.43 billion yen impairment on software in progress, which contributed to a sharp reduction in total assets from 15.7 billion yen to 10.9 billion yen. Despite these pressures, the game business segment achieved a profit of 313 million yen, and operating losses showed slight improvement compared to the previous year. Due to ongoing volatility and the difficulty of projecting future performance, no full-year forecast has been provided, and interim dividends have been suspended. To stabilize its financial position and pivot its corporate strategy, the firm executed several capital-raising and restructuring initiatives. These included the sale of the subsidiary GlobalGear for 1.1 billion yen and the issuance of new stock acquisition rights. These rights are tied to rigorous performance hurdles, requiring the company to achieve over 1,000 million yen in non-game revenue and a market capitalization exceeding 10 billion yen before they can be exercised. These measures are designed to incentivize a recovery in market value and diversify revenue streams beyond traditional mobile gaming. Management remains focused on achieving profitability through aggressive cost-cutting, workforce optimization, and a refined development pipeline. While the company has faced four consecutive years of operating deficits and delays in the release of EA SPORTS FC™ TACTICAL, it maintains that there is no material uncertainty regarding its status as a going concern. Future growth is predicated on the successful launch of new projects, including a My Hero Academia title and an expansion into the hybrid casual gaming market. This strategic shift aims to balance the high-risk nature of major game development with more sustainable, diversified business operations.
Drecom Co., Ltd. reported its consolidated financial results for the first quarter of the fiscal year ending March 2026, covering the period from April 1, 2025, to June 30, 2025. The company’s primary mission centers on global entertainment expansion through the integration of intellectual property and technology. The financial results reflect a period of significant revenue growth offset by substantial impairment losses, leading to a net loss for the quarter. Total revenue for the first quarter reached 4,466 million yen, representing a 110.4% increase compared to the same period in the previous year. This growth was largely driven by the performance of the mobile game title Wizardry Variants Daphne. Despite this revenue surge, the company recorded an operating loss of 81 million yen and an ordinary loss of 107 million yen. A major factor in the quarterly performance was an extraordinary impairment loss of 1,563 million yen, attributed to the reassessment of future earnings for a mobile game title released in the previous fiscal year that performed below expectations. Consequently, the quarterly net loss attributable to owners of the parent company totaled 1,799 million yen. The company operates across two primary segments: the Game Business and the Content Business. The Game Business generated 4,327 million yen in sales, though segment profit declined by 51.6% due to increased variable and fixed costs associated with new title releases. The Content Business, which focuses on publishing and merchandise, saw revenue rise to 155 million yen, with a reduced segment loss of 204 million yen as the company continues to invest in new business areas. Following these results, the company has revised its full-year consolidated earnings forecasts for the fiscal year ending March 2026.
KLab Inc. experienced a significant financial downturn during the fiscal year ended December 31, 2024, characterized by a 22.5% year-over-year revenue decline to 8.3 billion yen. This contraction led to a net loss of 2.78 billion yen, a substantial increase from the 1.82 billion yen loss recorded in the previous year. The downturn was primarily driven by a reduced portfolio of active titles and the delayed global launch of EA SPORTS FC™ TACTICAL due to retention challenges. While established titles like Captain Tsubasa: Dream Team and BLEACH Brave Souls remained stable, the company faced 1.14 billion yen in extraordinary losses, including significant software impairments and valuation losses on investment securities. The company’s financial position weakened as it marked its fourth consecutive year of operating deficits, resulting in a breach of financial covenants and a 2.8 billion yen decrease in retained earnings. Total net assets fell to 10.37 billion yen, while cash equivalents dropped to 1.61 billion yen. In response to these challenges, the business narrowed its strategic focus to the core Game Business segment, effectively deconsolidating its blockchain-related operations through the partial sale of BLOCKSMITH&Co. Despite the fiscal strain, investment in software in progress increased by 1.4 billion yen to support three major global IP projects, including a title based on the My Hero Academia franchise. To address concerns regarding its status as a going concern, the company secured approximately 2.8 billion yen in funding through third-party allotments and unsecured bonds in early 2025. Management has implemented rigorous cost controls and personnel restructuring to mitigate ongoing losses. However, due to the complexity and scale of its lead development projects, no earnings forecast has been provided for the 2025 fiscal year. The company remains reliant on the successful launch of its upcoming pipeline to stabilize its long-term financial health and recover from its current liquidity constraints.