FinancialKLab
Summary of Financial Results for Fiscal Year Ended December 31, 2023: KLab
18 pages~26 min full read
Key insights
5 takeaways · ~2 min read- 01
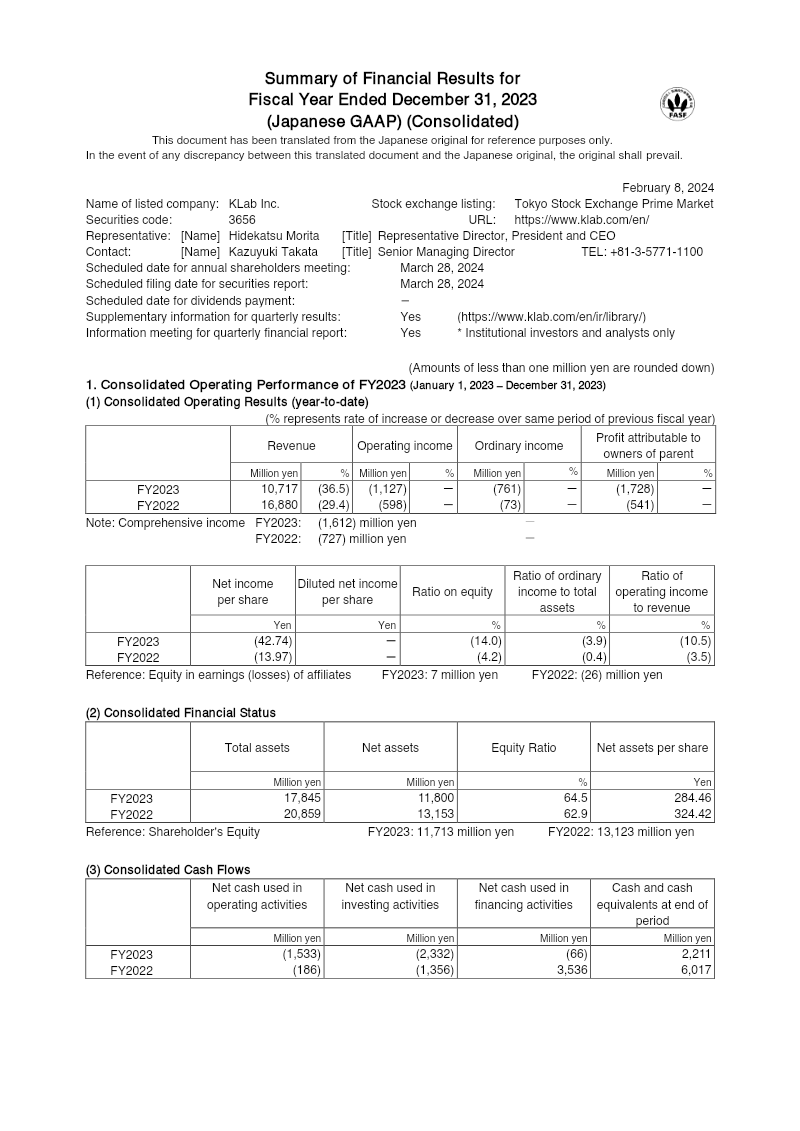
KLab Inc. reported its consolidated financial results for the fiscal year ended December 31, 2023, prepared in accordance with Japanese GAAP.
See it on page 1 - 02
The provided document serves as a reference translation of the original Japanese financial disclosure for the specified fiscal period.
See it on page 1 - 03
The report confirms the company's status as a listed entity under the name KLab Inc.
See it on page 1 - 04
The financial summary covers the full fiscal year performance concluding on December 31, 2023.
See it on page 1 - 05
In the event of any discrepancies between the provided English translation and the Japanese original, the Japanese original document takes precedence.
See it on page 7