Related Documents
Financial
AppLovin Financial Update: Q1 2026
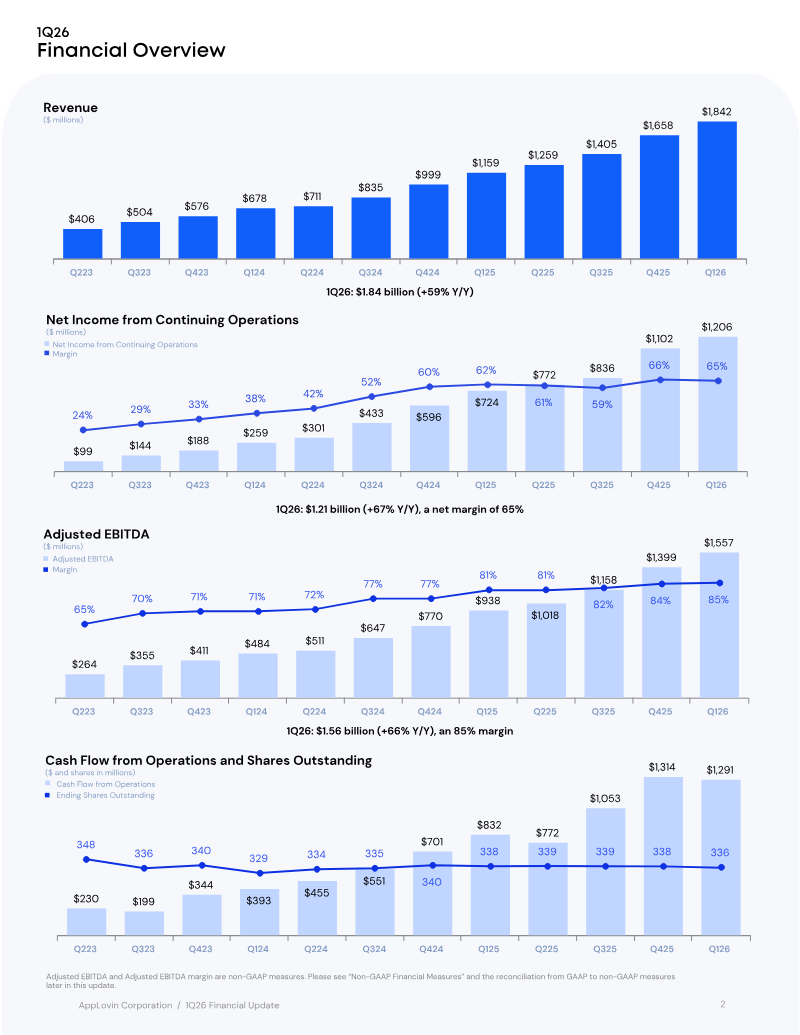
AppLovin’s Q1 2026 financial update reports a revenue of $1.842 billion, up 59% year‑over‑year, and net income from continuing operations of $1.206 billion, a 66% increase to a net margin of 65%. Adjusted EBITDA reached $1.557 billion, an 85% margin, reflecting a 66% rise from the prior year. Cash flow from operations matched Adjusted EBITDA at $1.556 billion, underscoring strong operating liquidity. Shares outstanding averaged 1.053 million, with diluted earnings per share of $3.56. The company’s balance sheet shows cash and equivalents at $2.759 billion, up from $2.487 billion, and total assets of $7.708 billion versus $7.260 billion a year earlier. Long‑term debt remained stable at $3.514 billion, while equity rose to $2.363 billion from $2.135 billion. Operating expenses grew modestly, with research and development increasing to $94 million from $56 million, while sales and marketing rose slightly to $60.8 million. Methodologically, the update presents both GAAP and non‑GAAP measures; Adjusted EBITDA is defined by excluding items such as stock‑based compensation, restructuring costs, and goodwill impairment. The reconciliation table shows cumulative Adjusted EBITDA margins climbing from 65% in Q1 2025 to 85% in Q1 2026, driven by revenue growth and controlled cost expansion. The update covers the United States market for Q1 2026, with data drawn from audited financial statements and internal reconciliations.
AppLovinMay 2026


Report
State of Gaming 2026
The 2026 State of Gaming analysis demonstrates a shifting landscape in which mobile gaming remains the largest driver of downloads—approximately 50 billion in 2025—but its growth rate is slowing. Revenue, however, continues to climb as monetization models mature and lifetime value deepens, especially within hybrid‑casual titles that now generate the most incremental income. In contrast, PC and console platforms experience record revenue growth, with Steam’s premium segment up 32 % and blockbuster releases such as Battlefield 6 capturing significant market share from incumbents. Shooter downloads on these platforms have plateaued, suggesting new titles are primarily cannibalizing existing audiences rather than expanding the category. Genre‑specific dynamics reveal that strategy games are the only mobile genre to grow in downloads, driven by 4X titles from Eastern developers. Action and shooter games dominate PC/console gains, while hyper‑casual remains the largest download engine but shows a notable lift in time spent, particularly in Tier 2 markets. Casual titles face declining day‑7 retention, indicating a stickiness challenge that could erode long‑term player value. Live‑ops and acquisition strategies have evolved toward retention‑focused events, multi‑tier season passes, and expedition‑style rewards. These mechanisms now represent the most reliable revenue drivers across competitive genres such as RPG, action, and simulation. Advertising spend remains concentrated on social channels—YouTube, Facebook/Instagram—and high‑attention formats like video, playable, and rewarded ads. Battlefield 6’s pre‑launch spend surpassed Call of Duty titles, leveraging Facebook, Reddit, and desktop display, while its post‑launch strategy pivoted to YouTube with cinematic, celebrity‑hook creatives. Geographically, the U.S. market shows a skew toward lifestyle and puzzle categories despite lower IAP shares, whereas casino titles exhibit higher spend‑to‑revenue efficiency. Overall, the industry is moving from acquisition toward deeper monetization per user, with indie shooters and simulation titles gaining traction amid intense competition in the shooter segment.
Sensor TowerApr 2026


Report
Ad Monetization Without Killing Retention
Hybrid monetization can increase revenue without eroding player retention by treating advertisements as an integral part of the game’s design system. Three core ad formats—interstitials, rewarded video (RV), and banners—are positioned strategically through careful gating on level progression, playtime, or cooldown periods. Optimal triggers and placement reduce player frustration while maximizing eCPM, ensuring that monetization flows naturally with gameplay. Rewarded video is most effective when offered during high‑stakes moments such as revives, boosters, or time‑limited rewards. Leveraging scarcity and urgency in these contexts drives conversions while preserving the core experience. Consistent visual cues, a clear distinction between coin rewards and RV value, and optional “No Ads” bundles further balance monetization with player comfort. Selling “No Ads” bundles requires thoughtful presentation. Bundles should appear side‑by‑side with regular items, use distinct visual cues and anchoring to convey high value, and be gated behind a minimum purchase tier to protect payer retention. Segmenting ad exposure—capping impressions, applying cooldowns, and filtering out disruptive creatives—maintains a positive user experience while sustaining revenue. Overall, the strategy blends ad formats with gameplay mechanics, employs scarcity and urgency for rewarded video, and offers high‑value “No Ads” options. This approach delivers robust monetization across diverse segments while safeguarding long‑term player engagement and retention.
Sensor TowerApr 2026

Financial
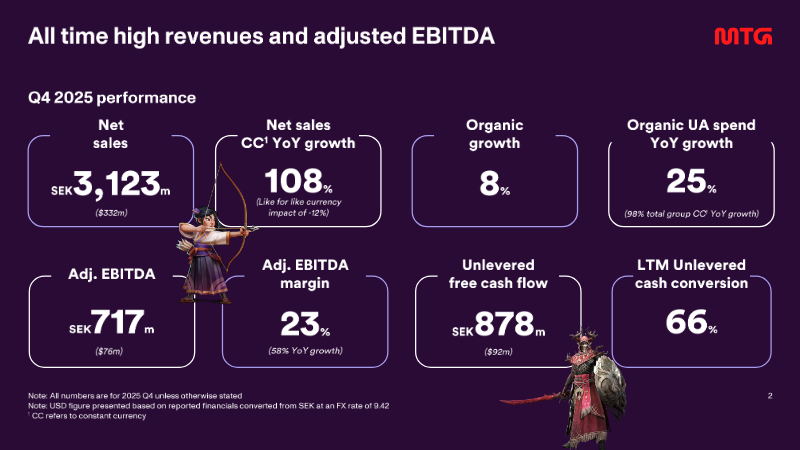
Q4 2025 Interim Report
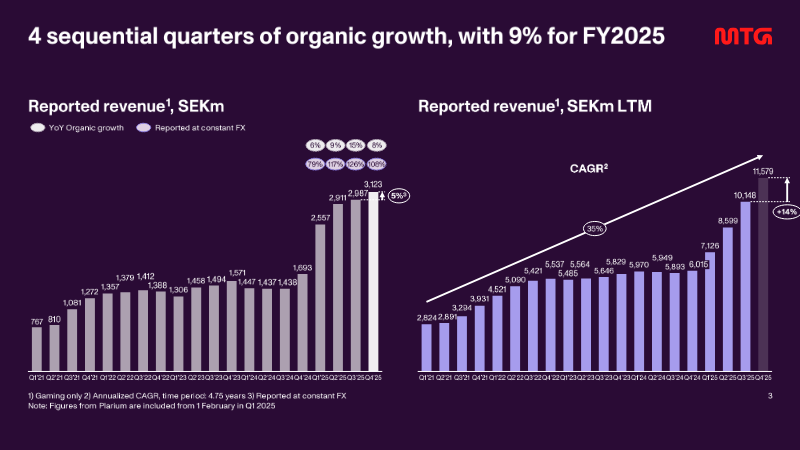
The interim filing presents the fourth‑quarter 2025 financial results for a midcore‑casual gaming group, emphasizing a record‑setting revenue run and the successful execution of a transformation agenda that includes the integration of the Plarium acquisition and the rollout of a new district structure in early 2026. Revenue reached SEK 3,123 million, reflecting 108 % organic growth year‑on‑year and a 25 % increase on a constant‑currency basis, while adjusted EBITDA rose to SEK 717 million, delivering a 23 % margin that matches the full‑year figure. Unlevered free cash flow amounted to SEK 878 million, with a cash‑conversion rate of 66 % and a leverage ratio of five times EBITDA, underscoring robust liquidity and disciplined capital management. User‑acquisition spending accelerated, representing 38 % of quarterly revenue—up from 37 % in the prior quarter—and grew 76 % on a reported basis, driven by heightened investment in original studios, new casual titles, and the racing franchise. The direct‑to‑consumer channel expanded by 600 basis points to 32 % of total revenue, reflecting a strategic shift toward higher‑margin in‑app purchases. Across the fiscal year, the company posted a 9 % organic revenue increase, with word‑games, racing, and RAID franchises delivering the strongest quarter‑end performance. Operating cash flow for the quarter stood at SEK 840 million, while adjusted net income was SEK 1,390 million, translating to an adjusted EPS of SEK 11.33. The financial outcomes exceed guidance and position the firm to meet its medium‑term outlook, with a pre‑IPO study for PlaySimple concluded and the midcore transformation progressing as planned.
Modern Times GroupFeb 2026