FinancialTOHO HOLDINGS CO.
Financial Results: First Half of Fiscal Year Ending March 2013
14 pages~23 min full read
Key insights
6 takeaways · ~2 min read- 01
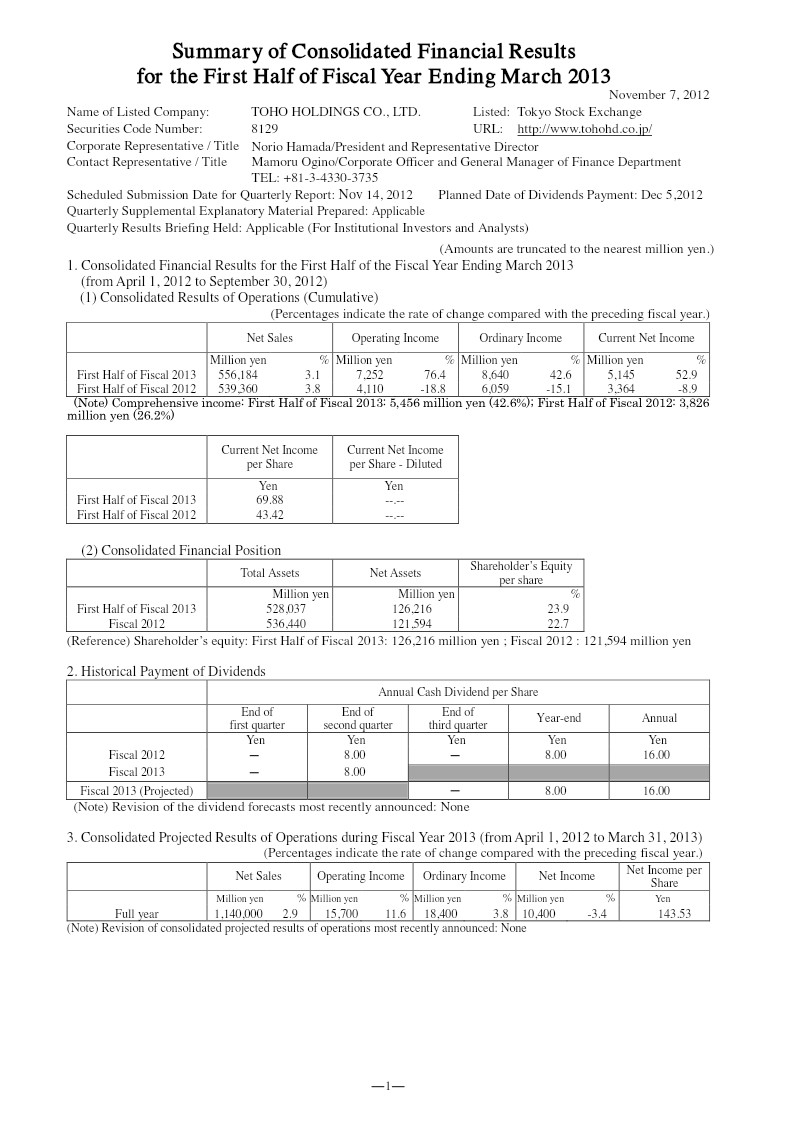
TOHO HOLDINGS reported strong H1 FY2013 growth, with net sales rising 3.1% to 556,184 million yen and operating income surging 76.4% to 7,252 million yen.
See it on page 1 - 02
The pharmaceutical wholesaling segment drove overall performance, generating 535,234 million yen in sales and a 214.6% increase in segment profit.
See it on page 4 - 03
The dispensing pharmacy segment saw a 13.8% decline in profit, driven by the costs of opening new locations and hiring additional pharmacists.
See it on page 4 - 04
The company successfully navigated a 6.0% average reduction in National Health Insurance (NHI) drug prices by focusing on distribution efficiency and proposal-based marketing.
See it on page 4 - 05
Ordinary income and net income grew by 42.6% and 52.9% respectively compared to the same period in the previous fiscal year.
See it on page 1 - 06
The company maintained its full-year earnings projections, supported by a stable financial position with total assets of 528,037 million yen and a 23.9% shareholder equity ratio.
See it on page 1