Monetization & Live Ops
Revenue models, in-game economies, retention and live operations.
282 documents


PitchBook · 2024
ReportGaming Public Comp Sheet and Valuation Guide
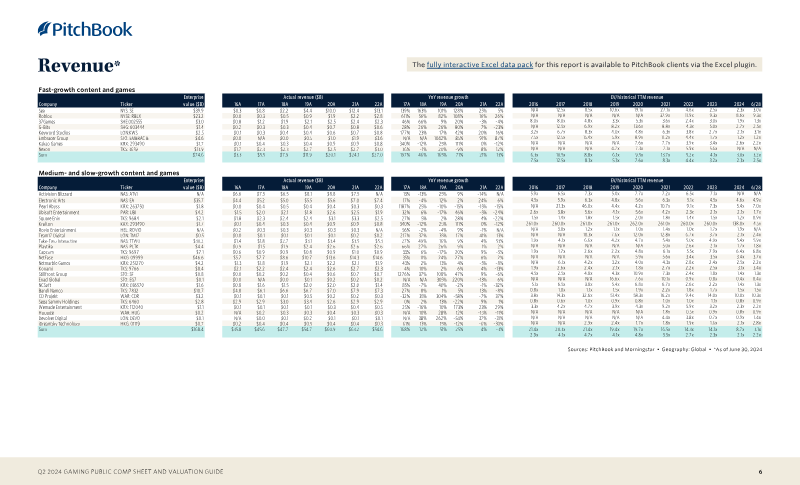
The analysis presents a snapshot of the U.S. public‑equity environment for the gaming industry in the second quarter of 2024, contrasting overall technology strength with sector‑specific performance. While the S&P 500 Information Technology index surged 14 percent, the broader gaming segment failed to keep pace, delivering only modest gains for most publishers. In contrast, the gambling sub‑category generated a robust 29 percent year‑to‑date return, underscoring divergent dynamics within the industry and suggesting that betting‑related businesses are currently the primary drivers of market outperformance. A parallel valuation component evaluates three publicly listed gaming‑related entities—Guild, Simplicity Esports, and EBET—using multiples sourced from PitchBook and Morningstar as of June 30 2024. The data reveal a scarcity of reliable pricing metrics, with several multiples either unavailable or markedly negative. EBET, in particular, exhibits extreme negative multiples (‑62.7×, ‑5.0×, ‑8.1×, ‑3.8×), reflecting either severe earnings shortfalls or market skepticism about its valuation. These anomalous figures highlight the challenges of applying conventional valuation frameworks to niche or underperforming gaming firms. Overall, the findings suggest that, despite a bullish backdrop for U.S. technology equities, the gaming sector’s heterogeneous performance and the paucity of credible valuation multiples limit investors’ ability to benchmark and price companies effectively. The evidence points to a need for more granular analysis of sub‑segments, especially gambling, and for alternative valuation approaches when traditional multiples prove unreliable.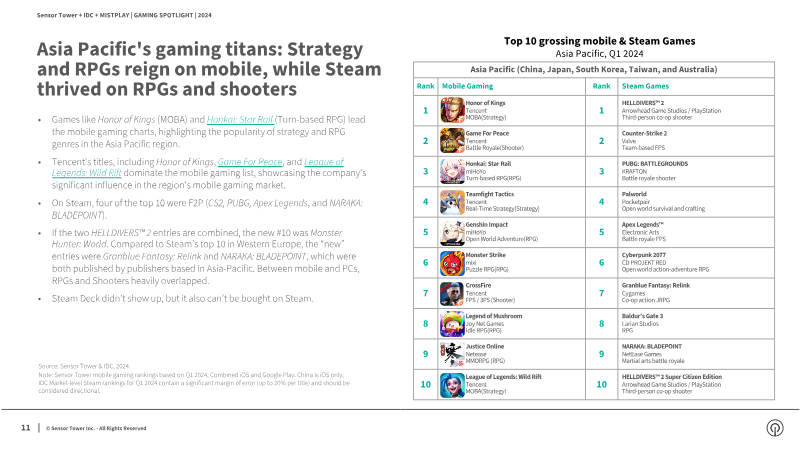
Sensor Tower · 2024
ReportGaming Spotlight H1 2024
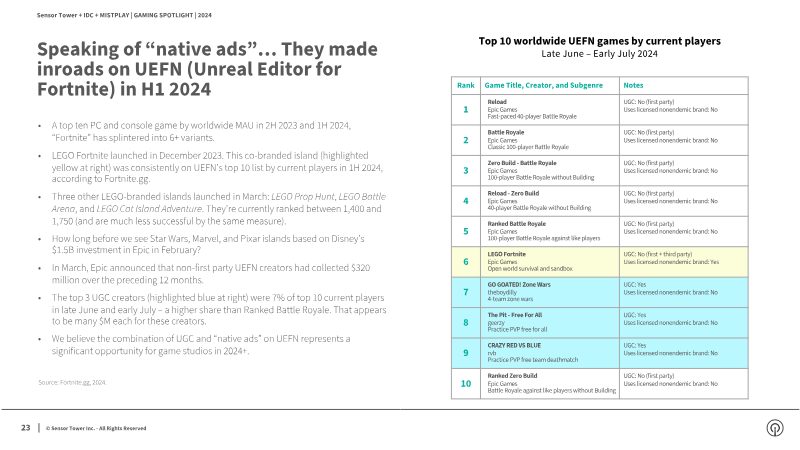
Mobile gaming solidifies its position as the leading segment of the global video‑game market, with revenue projected to reach $83 billion in 2024, reflecting a 6 percent year‑over‑year increase. In contrast, home‑console spending is expected to decline by 1 percent to $42 billion, while handheld revenues are slated to fall 2 percent to just under $2.5 billion. The upward trajectory of mobile is driven primarily by rapid expansion in emerging regions such as India and Indonesia, where user acquisition and spending are accelerating faster than in mature markets. Within mobile, fast‑growing sub‑genres—particularly simulators and multiplayer online battle arenas—accounted for $2.34 billion, representing 5.8 percent of total mobile revenue, and achieved a modest 0.4‑point rise in download share during the latest reporting period. In the United States, monetisation patterns among mobile players continue to favour rewarded‑video advertisements. These ads recorded the highest net‑sentiment score of +20 points and were the most frequently encountered format in the third quarter of 2023. Other ad formats, including playable, native, banner/display, and standard video, lagged behind both in visibility and user sentiment, indicating a clear preference hierarchy that shapes publisher revenue strategies. Overall, the data underscore a market increasingly centred on mobile platforms, propelled by growth in developing economies and reinforced by user‑friendly ad experiences. Console and handheld segments face modest contractions, suggesting that future investment and innovation will likely concentrate on mobile‑first titles, emerging‑region outreach, and optimisation of rewarded‑video ad ecosystems to sustain growth.
Video Games Europe · 2024
ReportChildren’s In-Game Spending 2024
Ipsos’ fifth edition of the In‑Game Spending by Children and Parent Supervision study tracks how European families manage micro‑transactions in video games, focusing on trends from 2018 through 2024. The research aims to gauge the prevalence of child‑initiated spending, the amount of money involved, and the supervisory mechanisms parents employ. The 2024 survey covered the United Kingdom, France, Germany, Spain and Italy, sampling 2,772 adults with children who play games and 10,998 gamers aged 11‑64, using quota‑based online panels weighted to national populations. Three‑quarters of parents report that their children do not purchase in‑game extras, a proportion that has remained stable since 2020. Among the 26 % who do spend, average monthly outlays fell to €31, down €8 from the previous year, with 73 % of spenders allocating €1‑20 per month. Gameplay‑impacting items such as new weapons or powers attract the most expenditure (38 %), while decorative cosmetics account for 30 % and loot‑box‑type rewards remain the least popular at 21 %. Parental oversight is high: 95 % of spending households have an agreement with their child, and 63 % maintain explicit rules, either requiring permission (49 %) or setting limits (27 %). Permission‑based agreements and two‑factor authentication have risen year‑on‑year, while a minority (5 %) admit to monitoring nothing. Among all gamers surveyed, only 11 % have ever bought real‑money in‑game currency and 4 % have purchased loot boxes, figures that have shown little change over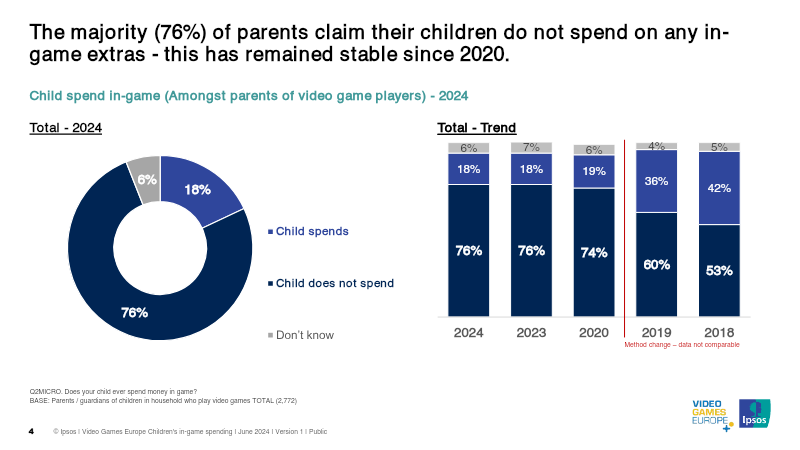
Ipsos · 2024
ReportChildren’s In-Game Spending: Europe
This research analyzes trends in children’s in-game spending and parental oversight across major European markets, including Great Britain, France, Germany, Spain, and Italy. Based on an Ipsos survey conducted between February and April 2024, the study draws on responses from 2,772 parents of children who play video games, as well as a broader sample of nearly 11,000 players aged 11 to 64. The primary thesis is that while in-game monetization is a known element of modern gaming, the vast majority of children do not spend money on extras, and those who do are subject to high levels of parental monitoring and declining average expenditure. Findings indicate that 76% of parents claim their children do not spend money on in-game extras, a figure that has remained stable since 2020. Among the minority who do spend, the average monthly expenditure dropped significantly from €39 in 2023 to €31 in 2024. The most common purchases are items that impact gameplay, such as new weapons or powers (38%), followed by cosmetic items (30%). Conversely, unknown rewards like loot boxes are the least popular category, with only 21% of spending children engaging with them. Among the general player population aged 11 to 64, only 11% have spent real money on in-game currency and only 4% on loot boxes. Parental supervision remains a dominant factor in managing these transactions. Approximately 95% of parents whose children spend money in-game have an established agreement regarding expenditure. These agreements are often explicit, with 49% of children required to ask for permission and 27% operating under strict spending limits. The use of technical controls, such as two-factor authentication and spending caps, has seen a year-on-year increase, suggesting that parents are becoming more proactive in utilizing platform tools to regulate digital consumption.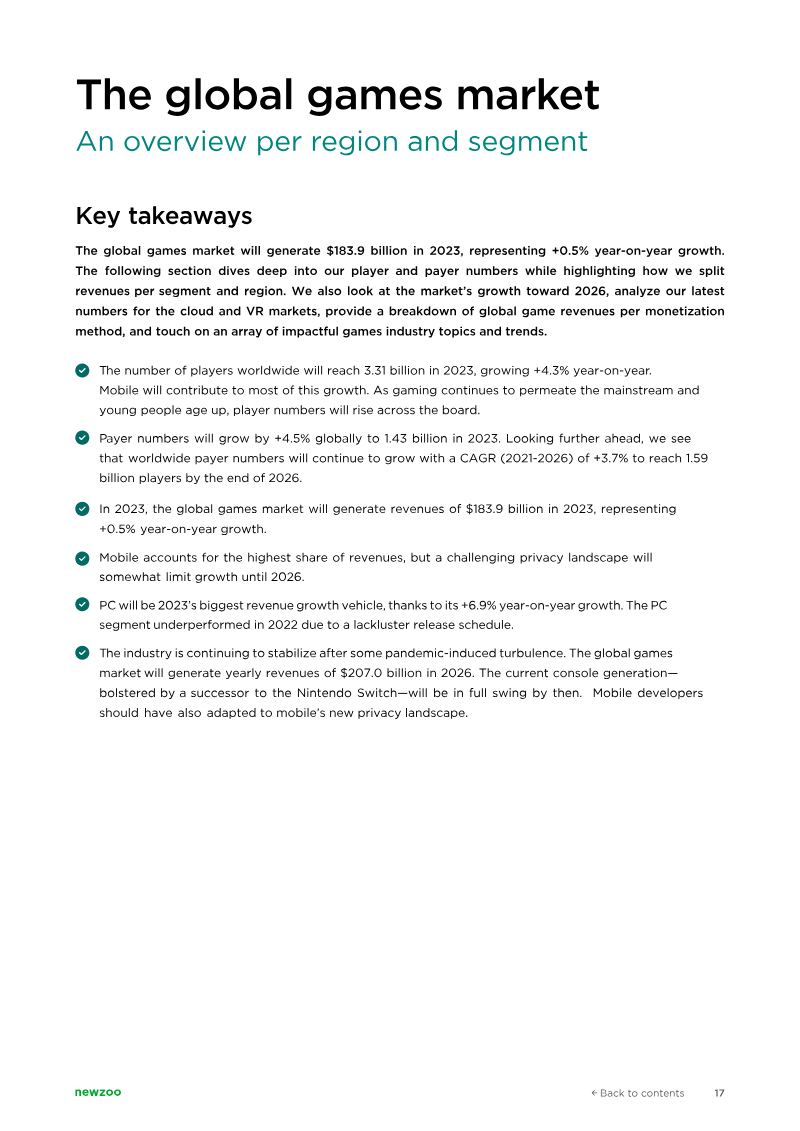
Newzoo · 2024
ReportGlobal Games Market Report 2023
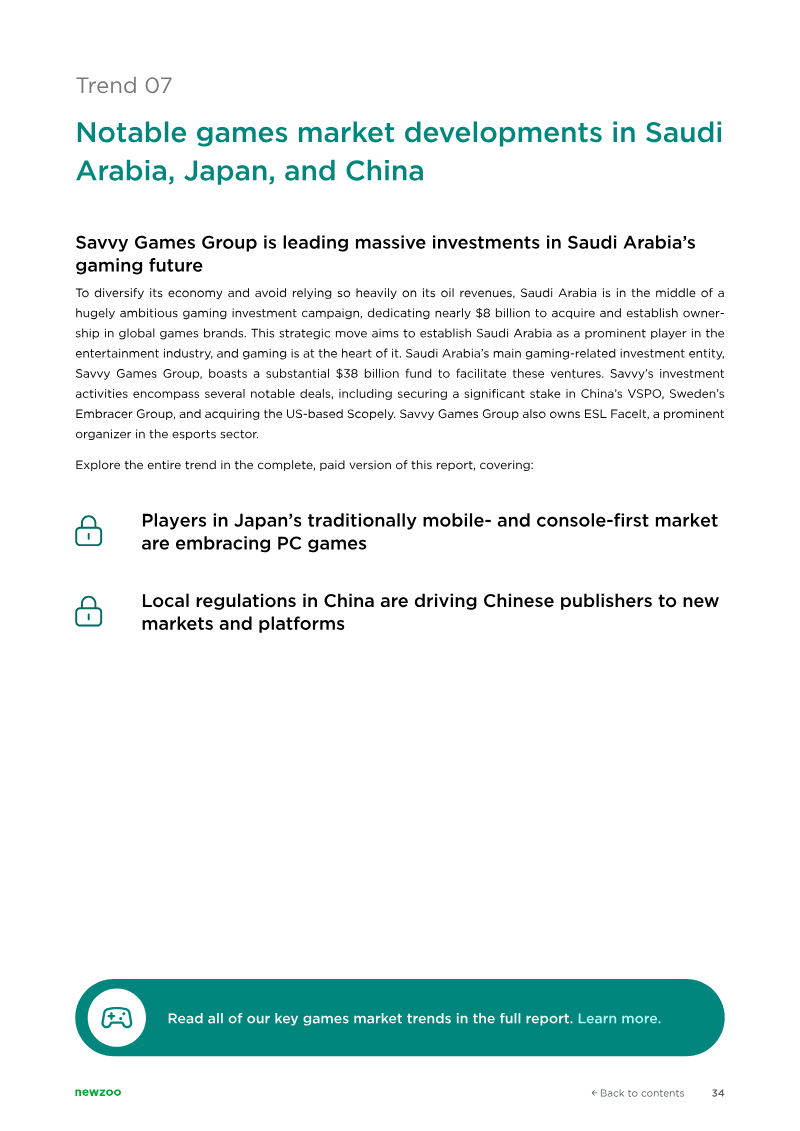
The analysis projects that worldwide consumer spending on video games will reach $183.9 billion in 2023, serving more than 3.3 billion players. Revenue is now detailed by downloadable content, micro‑transactions and in‑game subscriptions across PC and console platforms, reflecting a more granular view of monetisation. Estimates are derived from a top‑down model that integrates macro‑economic and census data with primary research from over 74,000 respondents in 36 key markets, supplemented by partner‑provided transaction figures and updated each quarter. Geographically, the Asia‑Pacific region remains the dominant market, accounting for 46 % of global gaming revenues, yet its growth turned negative at ‑0.2 % year‑over‑year, driven by declines in China, Japan and South Korea. The region’s publisher landscape is led by Tencent, which tops the list of publicly‑traded companies by revenue. The study covers 35 countries that together represent more than 90 % of worldwide game income, encompassing PC, console and mobile segments. Genre performance highlights shooters as the leading PC category, generating $5.5 billion—14.1 % of PC revenue—and expanding 4.9 % YoY, buoyed by titles such as Valorant, Counter‑Strike, Payday 3 and S.T.A.L.K.E.R. 2. On mobile, role‑playing games hold the largest share at 23.1 % of mobile revenue, but they are experiencing a year‑on‑year decline as Apple and Google privacy reforms have raised user‑acquisition costs. Overall, the market retains its massive scale but shows signs of slowing growth, particularly in its largest region, while shifts in privacy policy are reshaping mobile economics and shooter titles continue to drive PC revenue growth.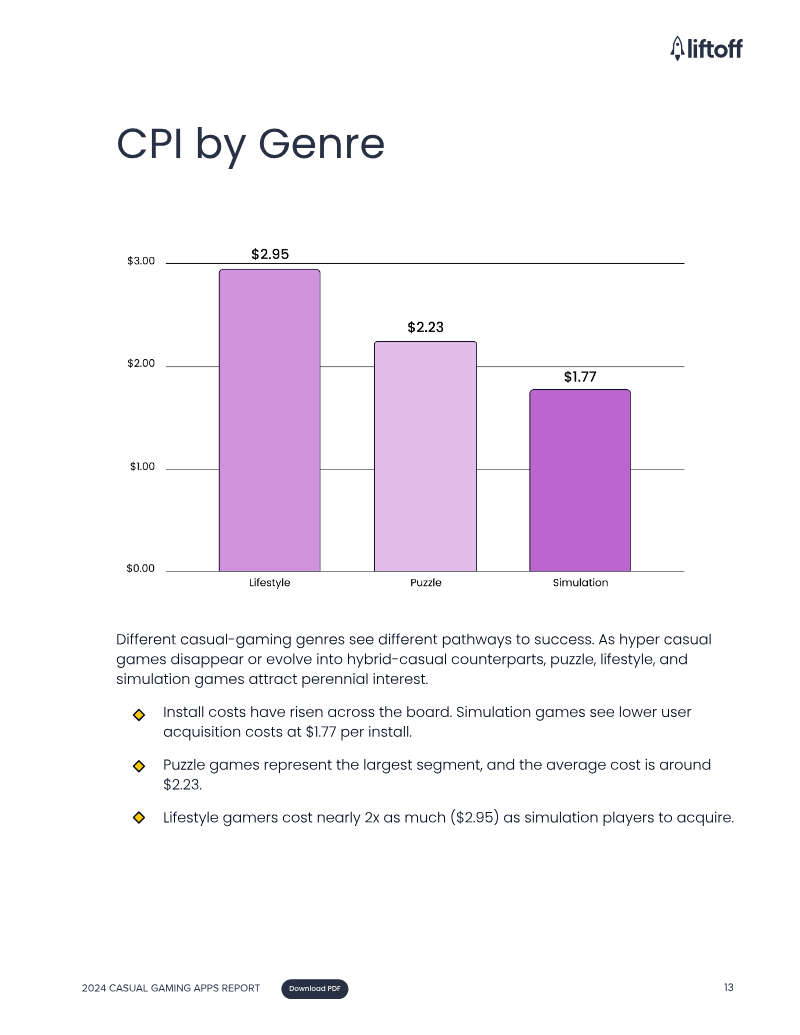
Liftoff · 2024
Report2024 Casual Gaming Apps Report
The global casual gaming market entered a period of recovery between April 2023 and April 2024, characterized by rebounding consumer spend despite a slowdown in total downloads. This shift is defined by a strategic migration from hyper-casual titles toward more complex hybrid-casual and 3D match models. User acquisition remains highly bifurcated by platform; iOS costs average $4.83 per install compared to just $0.65 on Android, though iOS continues to deliver a superior Day 7 return on ad spend. North America remains the most expensive and lucrative geographic region, while simulation games have emerged as the most cost-effective genre for acquisition. Casual games function as a critical ecosystem driver, generating 91% of their own installs and significantly influencing mid-core titles. Puzzle subgenres, particularly Match3 and Mahjong Solitaire, now command 37% of casual installs, while the 3D Match category has seen explosive growth, increasing its US iOS market share fivefold in a single year. To sustain this growth, market leaders are increasingly relying on sophisticated LiveOps and social mechanics. Successful strategies include collaborative partner events, social win streaks, and "digging" minigames, all of which leverage group competition to drive engagement and baseline revenue. Monetization strategies have evolved toward player choice and direct-to-consumer models. Progressive offers and "pick-one" bundles are now standard in 70% of top-performing US casual games, providing structured value through tiered rewards. Furthermore, developers are aggressively adopting engagement-linked offers and external web stores. By linking premium rewards to gameplay tasks and moving transactions to proprietary web platforms, developers are successfully bypassing traditional app store fees while fostering long-term player loyalty through exclusive digital storefronts and daily login incentives.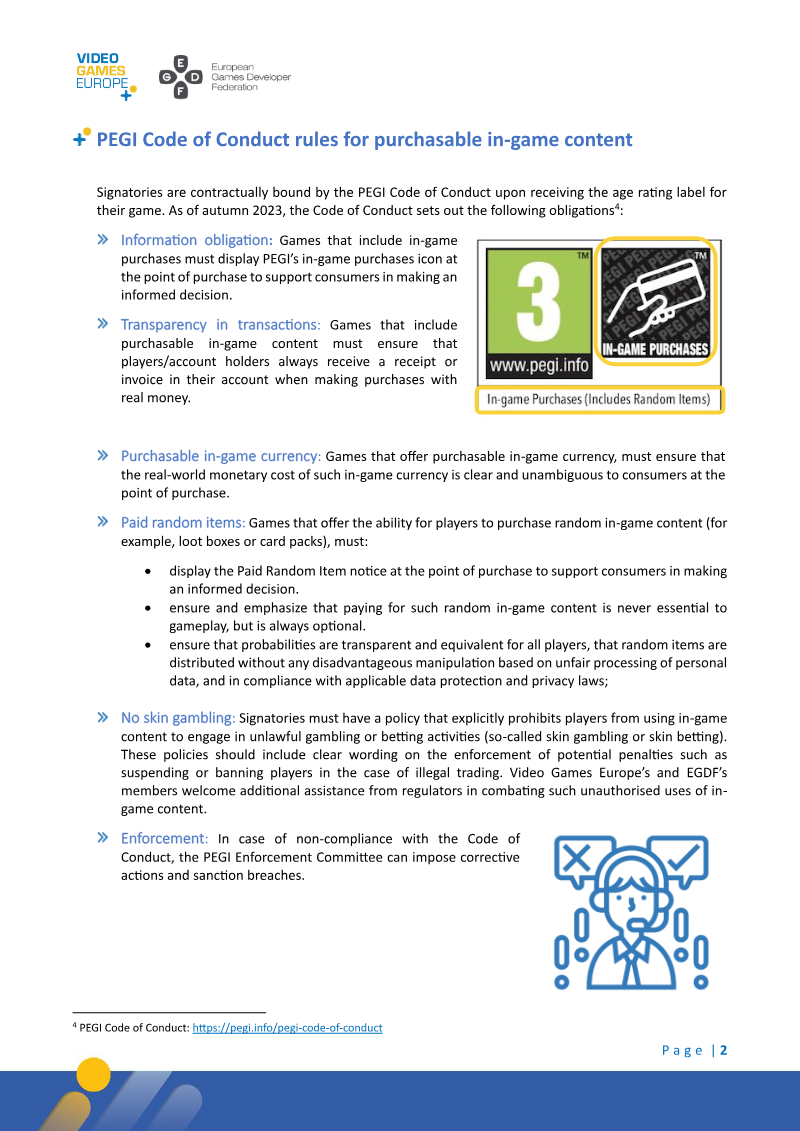
Video Games Europe · 2024
ReportTransparent and Fair Purchases of In-Game Content
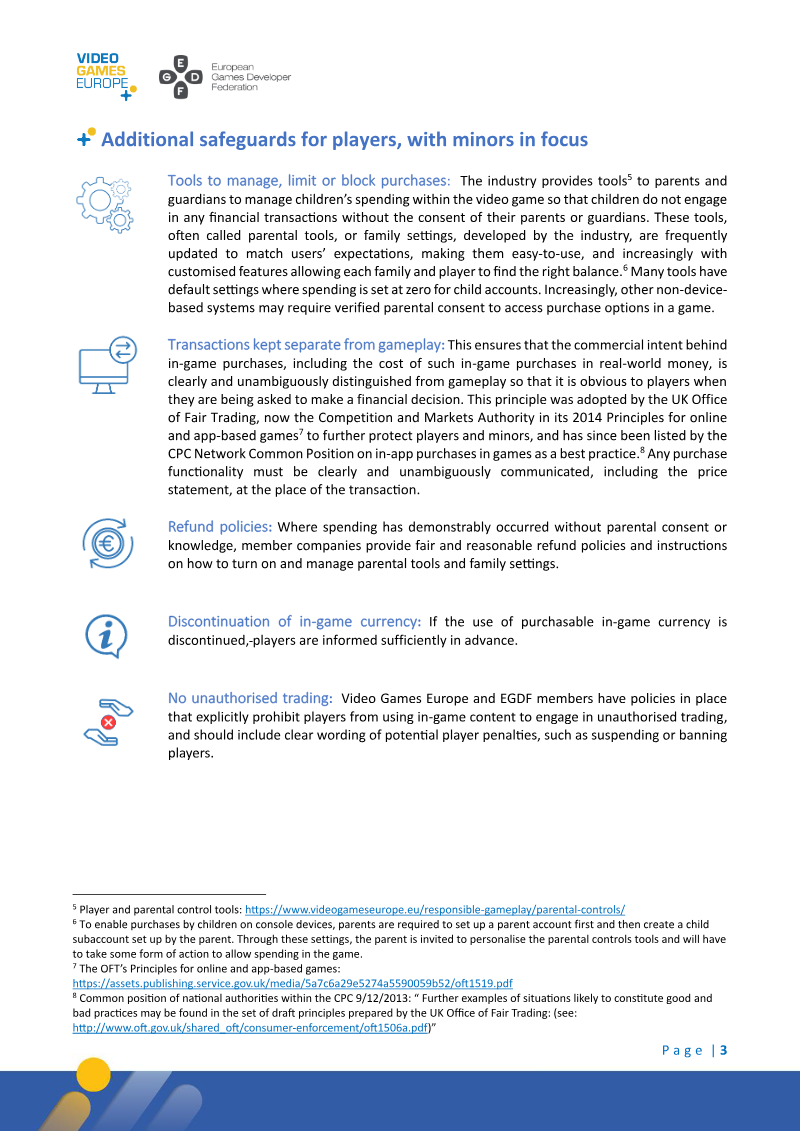
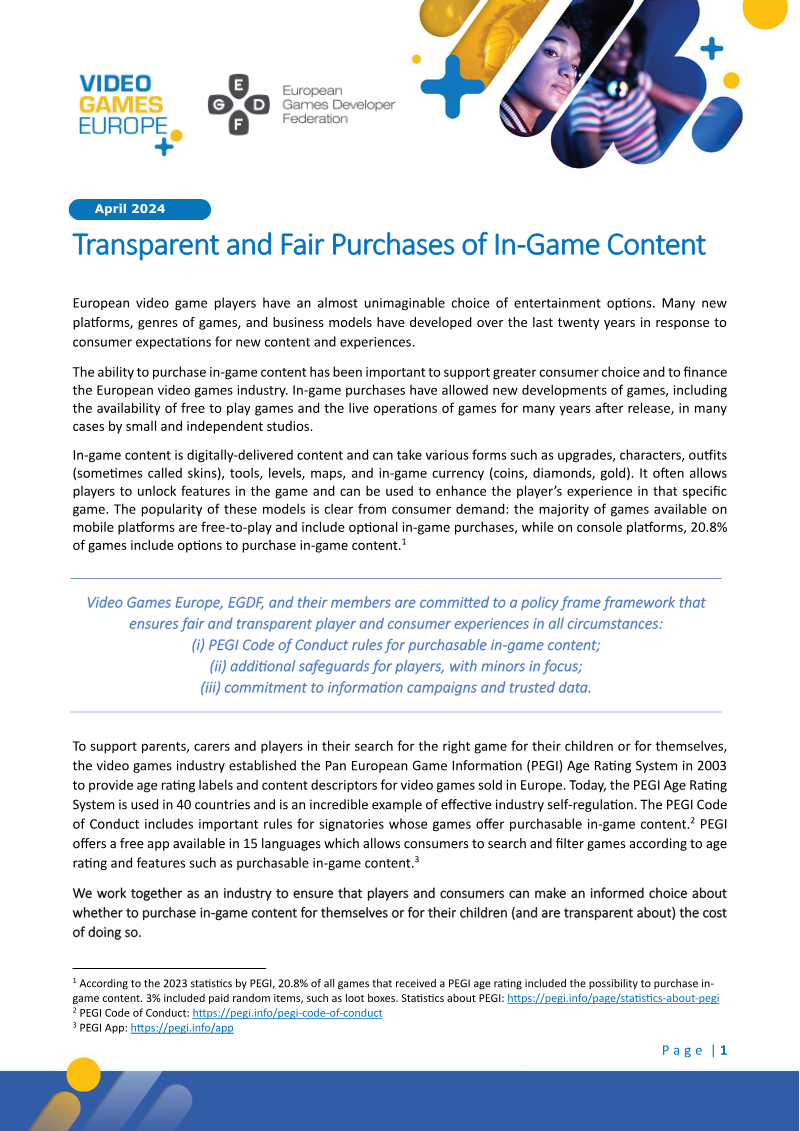
The initiative seeks to ensure that European players can make informed, transparent decisions when purchasing in‑game content, while safeguarding minors from unintended spending. It builds on the PEGI Age Rating System, now operating in forty countries, and introduces a three‑part policy framework: the PEGI Code of Conduct for purchasable content, additional safeguards focused on younger players, and coordinated information campaigns supported by trusted data. Statistical evidence shows that 20.8 % of all games receiving a PEGI rating include in‑game purchase options, with 3 % offering paid random items such as loot boxes. An annual Ipsos survey commissioned by Video Games Europe from 2018 to 2024, covering the five largest European consumer‑spend markets, reveals that parental supervision remains high—95 % of Swedish parents monitor spending—and that 76 % of parents report their children do not make in‑game purchases, a figure stable since 2020. Average spend among permitted purchasers fell 21 % in the Netherlands since 2023, and only 11 % of players aged 11‑64 have bought in‑game currency across the surveyed regions. The PEGI Code of Conduct obliges signatories to display a dedicated icon at the point of purchase, provide receipts, and clearly state the real‑world cost of any virtual currency. For paid random items, it mandates visible notices, confirms that such purchases are optional, and requires transparent probability disclosures in line with data‑protection laws. Additional safeguards include parental tools that default to zero spending for child accounts, separation of transaction interfaces from gameplay, and refund mechanisms for unauthorized purchases. Policies also prohibit the use of in‑game assets for illegal gambling or unauthorised trading, with enforcement powers vested in the PEGI Enforcement Committee. Information campaigns, such as the Pan‑European “Seize the Controls” effort, aim to raise awareness of these tools and safeguards in national languages, leveraging partnerships with Safer Internet Centres and other stakeholders. The industry welcomes further support from EU institutions and member states to amplify outreach and reinforce responsible spending practices across the European gaming ecosystem.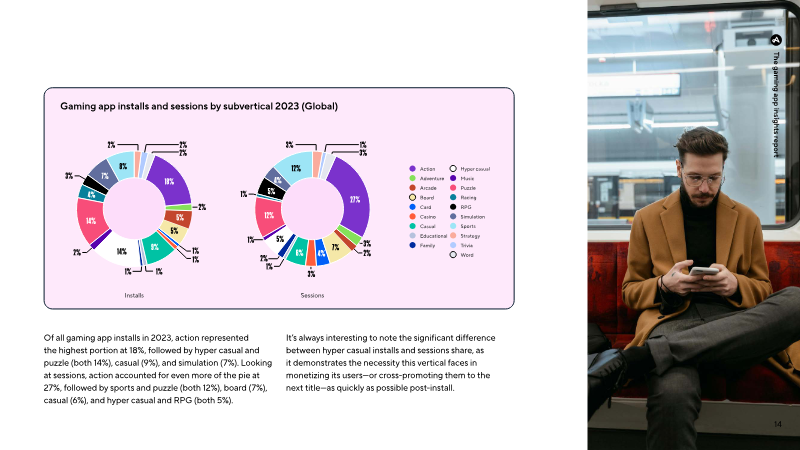

Adjust · 2024
ReportThe Gaming App Insights Report: Unlocking Growth Opportunities for Mobile Marketers
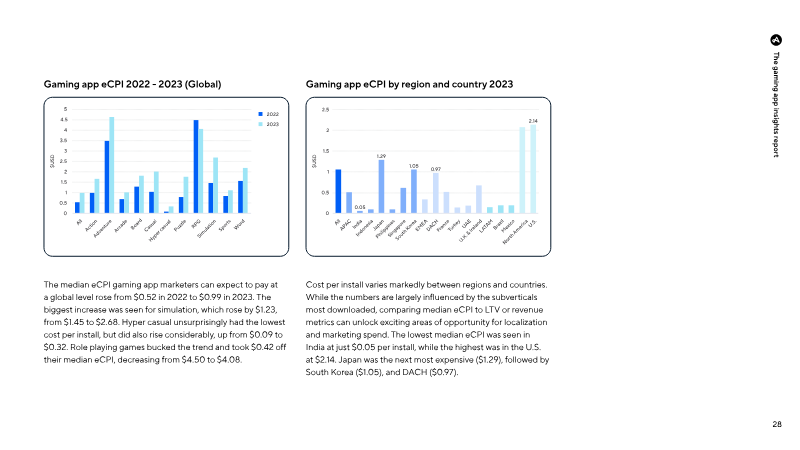
The mobile gaming industry is entering a period of stabilization and renewed growth following recent volatility, characterized by a 7% year-over-year increase in global installs during late 2023. While consumer spending saw a marginal decline throughout the previous year, early 2024 data suggests a recovery driven by the rise of hybrid casual titles and the integration of artificial intelligence to streamline production. This shift is particularly evident in the Latin American market and within specific subverticals like Racing and Simulation, which experienced install surges of 61% and 53%, respectively. Despite these gains, the landscape remains competitive as organic install shares dropped to 50% and median day-one retention rates softened to 28.3%. Monetization strategies are evolving as developers pivot toward hybrid models that combine in-app purchases with advertising revenue. Although global effective cost per install nearly doubled to $0.99 in 2023, in-app revenue grew by 6%, led by high-value genres such as RPGs and Adventure games. These categories command the highest lifetime value and average revenue per monthly active user, particularly in mature markets like the United States and Japan. Conversely, hyper-casual games continue to prioritize volume and efficiency, maintaining low acquisition costs despite a broader industry trend toward more complex, long-term engagement models. The industry has demonstrated significant resilience regarding privacy changes, with global App Tracking Transparency opt-in rates rising to 39%. This adaptation, coupled with the superior performance of hybrid casual games in click-through rates and ad revenue, indicates a strategic move toward data-driven marketing and diversified revenue streams. As the sector moves through 2024, success depends on balancing high acquisition costs in premium markets with the massive scale offered by emerging regions like India and Southeast Asia, all while navigating a more privacy-centric digital ecosystem.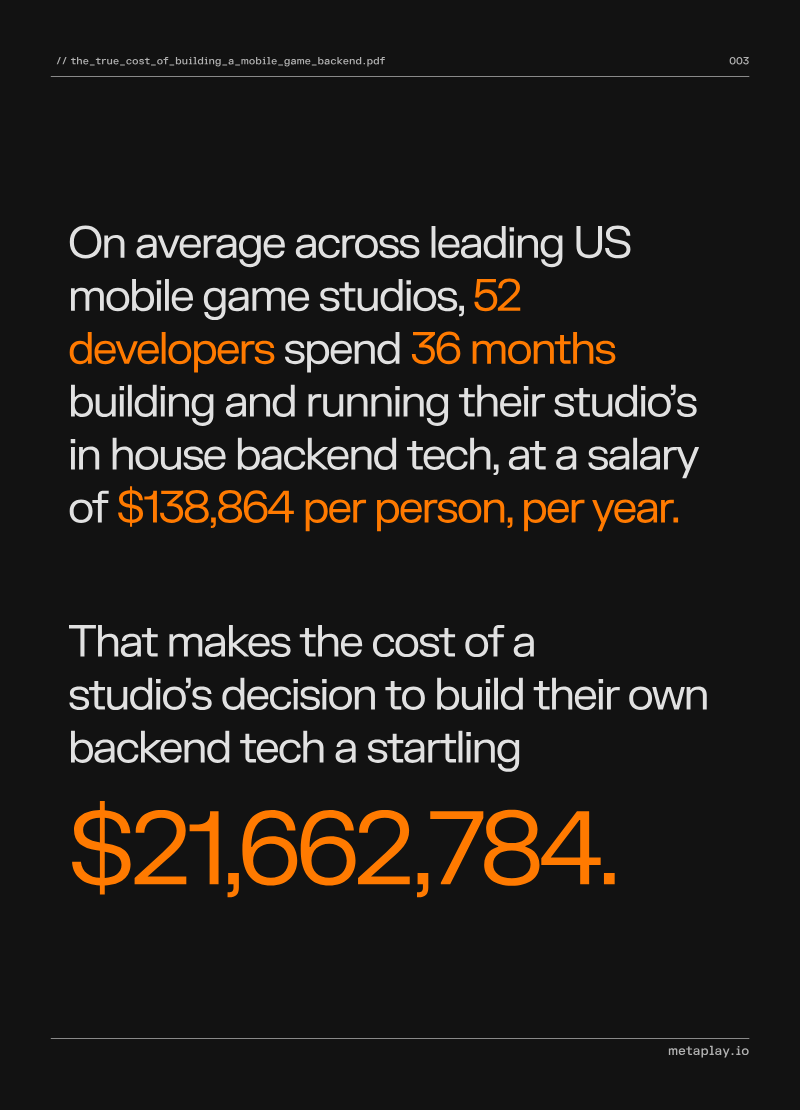

Metaplay · 2024
ReportThe True Cost of Building a Mobile Game Backend
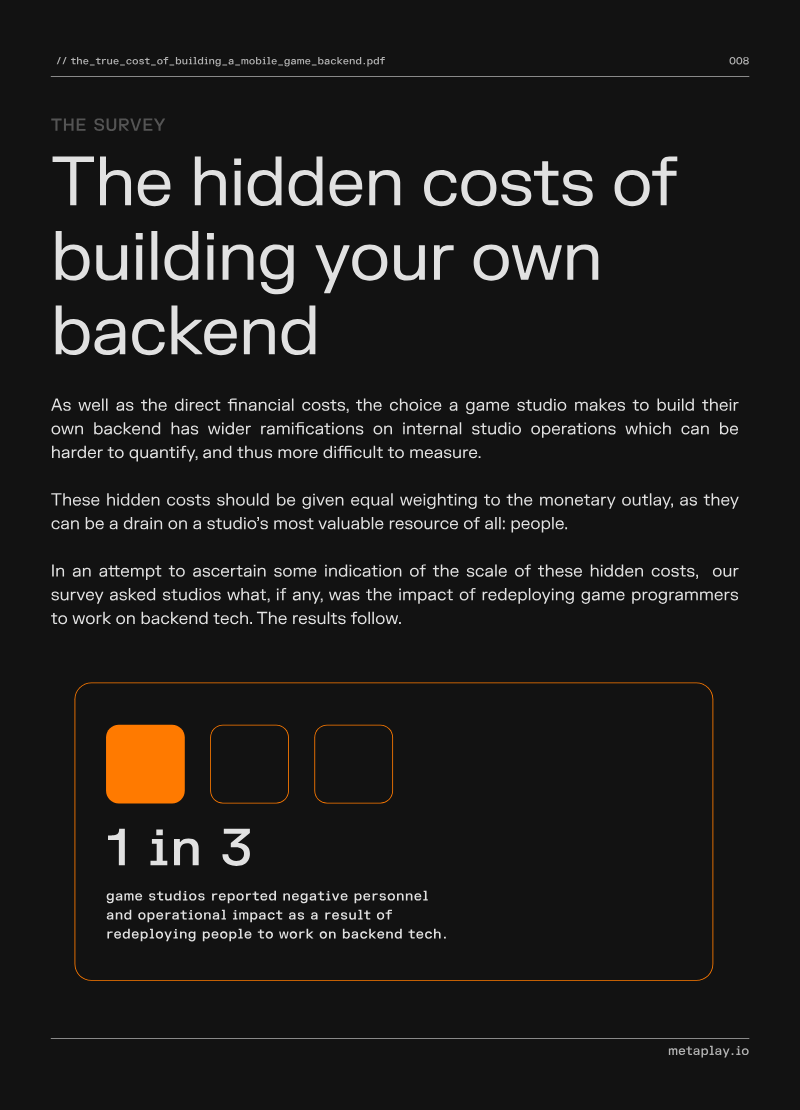
This analysis examines the financial and operational costs associated with developing in-house backend technology for mobile games. The primary thesis suggests that while third-party game engines have become industry standards, backend infrastructure is currently undergoing a similar shift as the technical demands of live-service games outpace the practicality of internal development. The findings are based on a survey of 125 C-level executives and tech leads at US-based mobile game studios with at least 50 employees, conducted in April 2024. Data indicates that the average leading US studio employs 52 developers for 36 months to build and maintain an internal backend. With an average annual salary of $138,864 per developer, the direct financial investment for a custom backend is estimated at approximately $21.6 million. The research notes that strategy and shooter genres are most likely to require these complex systems, while hypercasual games are increasingly adopting them to support "hybridcasual" live-ops models. Beyond direct costs, the analysis identifies significant "hidden" human and operational tolls. Approximately 50% of surveyed studios reported that diverting gameplay programmers to backend tasks slowed overall game development. Furthermore, one-third of respondents experienced higher employee turnover and increased "crunch" periods, while 20% reported direct revenue loss. The study concludes that the decision to build internal tech often results in negative knock-on effects across departments, suggesting that third-party solutions offer a more sustainable path for scaling live-service titles without sacrificing personnel well-being or development velocity.


SuperScale · 2024
ReportTurning Organic Success into Long-Term Revenue: A Framework for F2P Mobile Games
This industry guide provides a strategic framework for mobile game developers to transition from initial organic traction to sustainable, long-term revenue growth. The central thesis argues that while organic "sparks" are invaluable, lasting success requires a rigorous, two-step approach: first, optimizing the game’s internal economy for maximum Lifetime Value (LTV), and second, deploying data-driven paid User Acquisition (UA) campaigns. The first phase focuses on monetization through ad mediation and in-app purchases (IAP). Key findings suggest that implementing a hybrid ad mediation setup—combining real-time bidding with manual waterfalls—can yield a 10% to 20% uplift in Average Revenue Per Daily Active User (ARPDAU) immediately. The analysis emphasizes the importance of rewarded ads over intrusive interstitials and highlights that personalized, segmented IAP offers can increase player spending by up to 23%. It also advocates for regional pricing, noting that price cuts in lower-purchasing-power markets can boost ARPDAU by as much as 30%. The second phase details a methodology for scaling through paid UA, emphasizing the necessity of accurate data post-IDFA. The guide recommends a three-step framework of assessment, preparation, and optimization. It advises that while platforms like Meta and TikTok are accessible for smaller budgets, larger networks typically require a minimum monthly spend of $20,000 to exit the "learning phase" effectively. Furthermore, it stresses the role of App Store Optimization (ASO), citing a case where a simple icon change resulted in a 90% install uplift. The scope of the analysis covers the global free-to-play (F2P) mobile gaming market, applicable to various genres and studio sizes. The methodology relies on industry benchmarks, case studies, and data from SuperScale’s proprietary analytics engine, SuperInsights. The overarching conclusion is that developers must treat monetization and UA as iterative, scientific processes, using predictive modeling to forecast Return on Ad Spend (ROAS) up to a year in advance to ensure business-level profitability.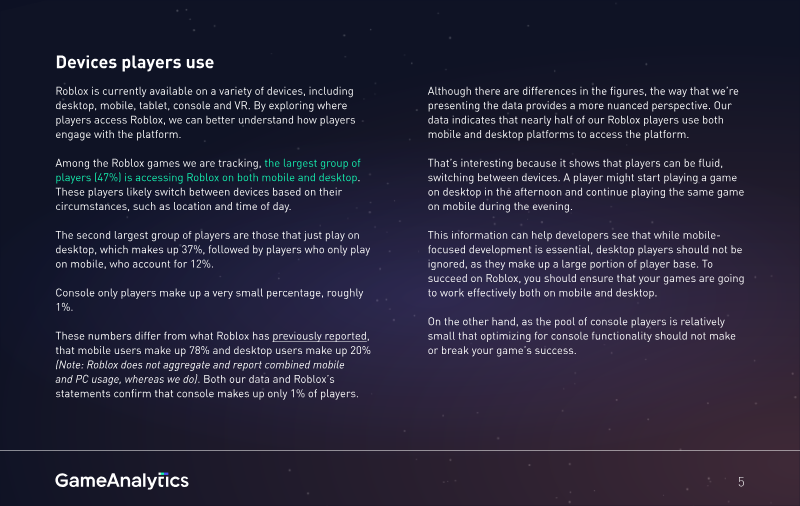

GameAnalytics · 2024
Report2023 Roblox Report: Behind the Data
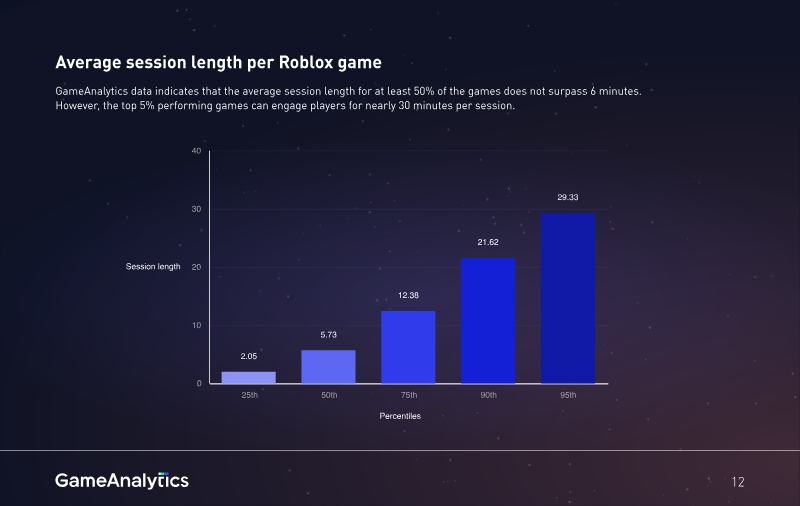
The 2023 Roblox Report, produced by GameAnalytics, provides a comprehensive analysis of player behavior and performance benchmarks across the Roblox platform. The study is based on 2023 data from thousands of games that utilize the GameAnalytics SDK, representing over 50% of total player engagement on the platform. The dataset includes a significant sample of high-performing titles, featuring 300 games with over one million monthly active users and 60 titles exceeding ten million monthly sessions. The findings reveal a highly fluid player base, with 47% of users accessing the platform via both mobile and desktop devices. Engagement is characterized by high frequency rather than single long sessions; over 50% of players engage at least twice daily, and the top 5% of games successfully bring players back more than 3.5 times per day. While the average session length for half of the tracked games is under six minutes, elite titles in the 95th percentile sustain engagement for nearly 30 minutes per session. Monetization remains a significant challenge on the platform. Only 4.2% of players spend Robux within games, and more than half of those spenders contribute less than $1 annually. However, a small segment of high-value "power spenders" drives the majority of revenue, with the top 5% of games earning approximately $77 per playing player annually. Retention is identified as a universal struggle across the platform regardless of game quality; Day 1 retention typically ranges between 12% and 15%, dropping to near 1% by Day 90. The report concludes that success on Roblox requires optimizing for cross-platform play, implementing aggressive LiveOps to counter natural retention decay, and focusing on session frequency to drive monetization.

Newzoo · 2024
Report