Mobile Games
The mobile market by genre, from hypercasual and puzzle to midcore and idle.
403 documents
Tenjin · 2022
ReportThe Hyper-Casual Benchmark Report: Q3 2022
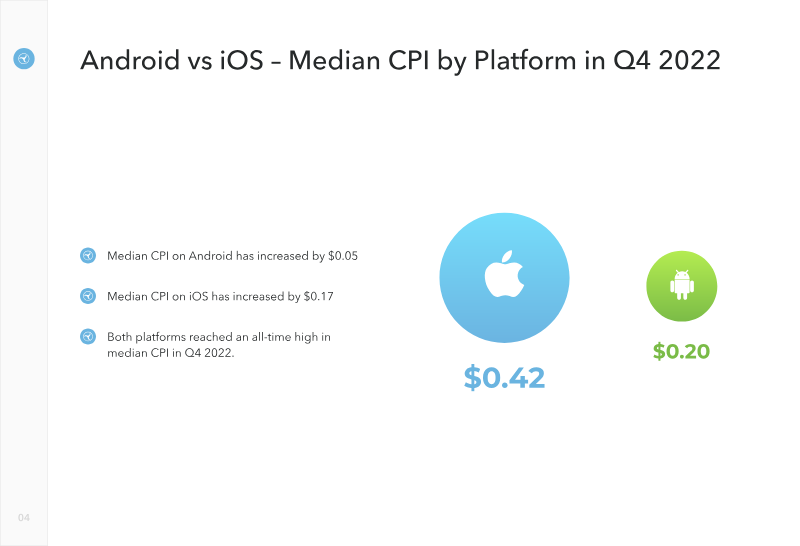
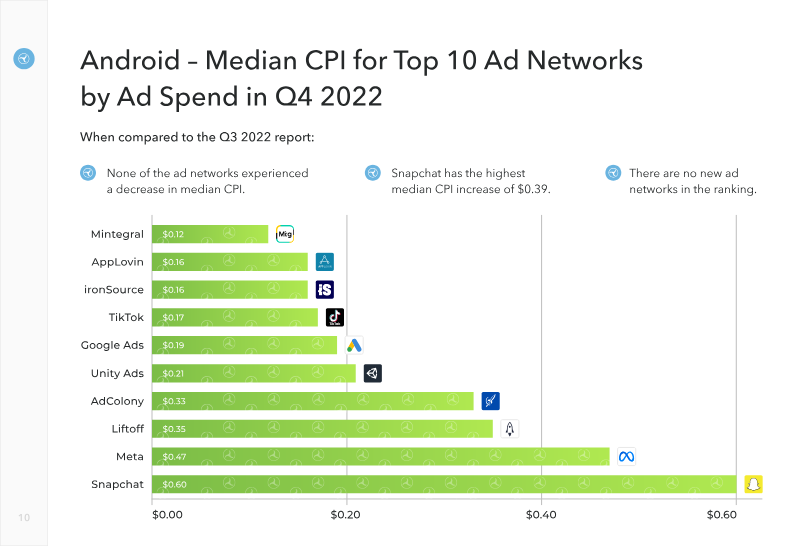
The hyper-casual mobile gaming sector experienced a notable escalation in acquisition costs during the latter half of 2022, characterized by rising median cost-per-install (CPI) rates across both Android and iOS platforms. By the fourth quarter of 2022, median CPI reached all-time highs of $0.20 on Android and $0.42 on iOS. This upward trend in acquisition spending was global, as no major market tracked by ad spend experienced a decrease in median CPI on Android, while iOS markets saw varied fluctuations, including a significant decrease in the United States and notable increases in France and Germany. Retention metrics reveal a consistent performance advantage for iOS over Android across all tiers of game quality. For the top 2% of hyper-casual titles, iOS achieved a 45% Day 1 retention rate compared to 38% on Android, with Day 7 retention figures similarly favoring iOS at 19% versus 14%. This performance gap persists among the top 25% of games and the median cohort, where iOS maintains a higher percentage of returning players. These findings underscore a widening disparity between high-performing titles and average games, emphasizing the critical importance of engagement optimization in a landscape of increasing user acquisition costs. The analysis draws upon data from over 100,000 games and one-third of the global mobile player base to establish these benchmarks. By segmenting performance by platform and geographic region, the data highlights the shifting economic landscape for developers and publishers. The findings suggest that while market saturation and rising costs present significant challenges, the ability to maintain player retention remains the primary differentiator between top-tier hyper-casual games and the broader market.


Sensor Tower · 2022
ReportThe State of Mobile Gaming: Market Trends and Top Titles in the U.S., Europe, and Asia 2022
The analysis demonstrates that the global mobile-gaming market entered a contraction phase in early 2022, with revenue falling 6% year-over-year and the first decline since 2019. The United States and Japan, historically dominant markets, experienced double-digit drops in consumer spending—particularly a 22% decline on Google Play in the U.S.—while emerging APAC regions such as India, Brazil, and Vietnam captured growing market share. Download volumes remained steady at roughly 14 billion worldwide; India retained the largest install base but is losing ground to Brazil, which is poised to overtake it. Regional dynamics reveal divergent trends. Europe’s spending rose 18% to $8.6 B, driven largely by hyper-casual titles and rapid growth in Turkey (6% YoY) and Poland (8% YoY). In contrast, Asia’s revenue fell 7% to $11.2 B, with China and Japan maintaining top positions but India’s spending accelerating despite lower monetisation rates. Genre-level data shows a decline across the five largest categories, yet strategy games remain the strongest, generating over $4 B quarterly since late 2020. Hyper-casual installs surged to 3.5 billion, accounting for 32.5% of all downloads, while puzzle and arcade titles saw double-digit revenue drops. Monetisation strategies continue to evolve. Gacha mechanics dominate the mid-core segment, often combined with season passes, subscriptions, or live-ops to boost spend. Season passes have proven effective beyond shooters, doubling weekly revenue for titles such as Lords Mobile and revitalising legacy games like Hay Day. The data underscores the necessity of flexible, hybrid monetisation models—particularly in markets where overall genre revenues are contracting—to sustain profitability across diverse player bases.
ironSource · 2022
ReportModern Mobile Consumer 2022: App Monetization Report
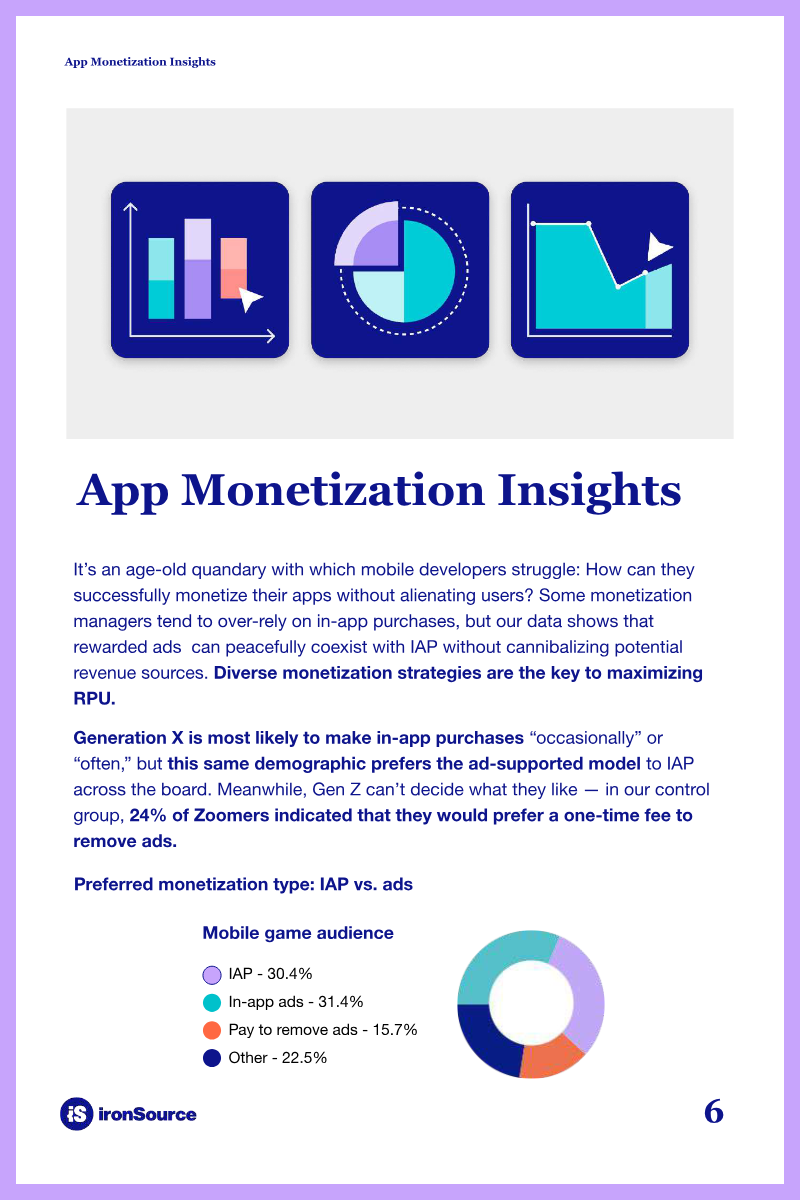
The report examines how modern mobile consumers interact with app monetization, revealing that rewarded ads and in-app purchases (IAP) coexist without cannibalizing revenue. Surveying 30,457 participants—18,894 from gaming apps and 11,563 from non-gaming apps on the ironSource network, plus a 500-person control group outside MobileVoice®—the study covers North America and global markets from April to May 2022. Respondents were verified as adults and opted in for virtual rewards, ensuring engagement accuracy. Key findings show an almost even split between IAP and ad-supported preferences across both gaming and non-gaming audiences. Generation X favors occasional or frequent IAP yet prefers ad support overall, while 24% of Gen Z would pay a one-time fee to remove ads. Approximately one third of users make occasional IAPs, a significant rise from the 2-3% noted five years earlier. Free apps with IAP dominate downloads (52% of gaming users), and 15-17% of consumers now spend more on IAPs than five years ago. Methodologically, the study combined custom MobileVoice® surveys with third-party polling (Pollfish) to mitigate bias. Data were analyzed using ironSource’s Offerwall and native survey offers, with age verification and global reach. The report concludes that diversified monetization strategies—balancing ads, IAPs, and optional removal fees—are essential to meet evolving consumer expectations. It recommends audience-specific research, price optimization, and value bundle offerings to maximize revenue while preserving user experience.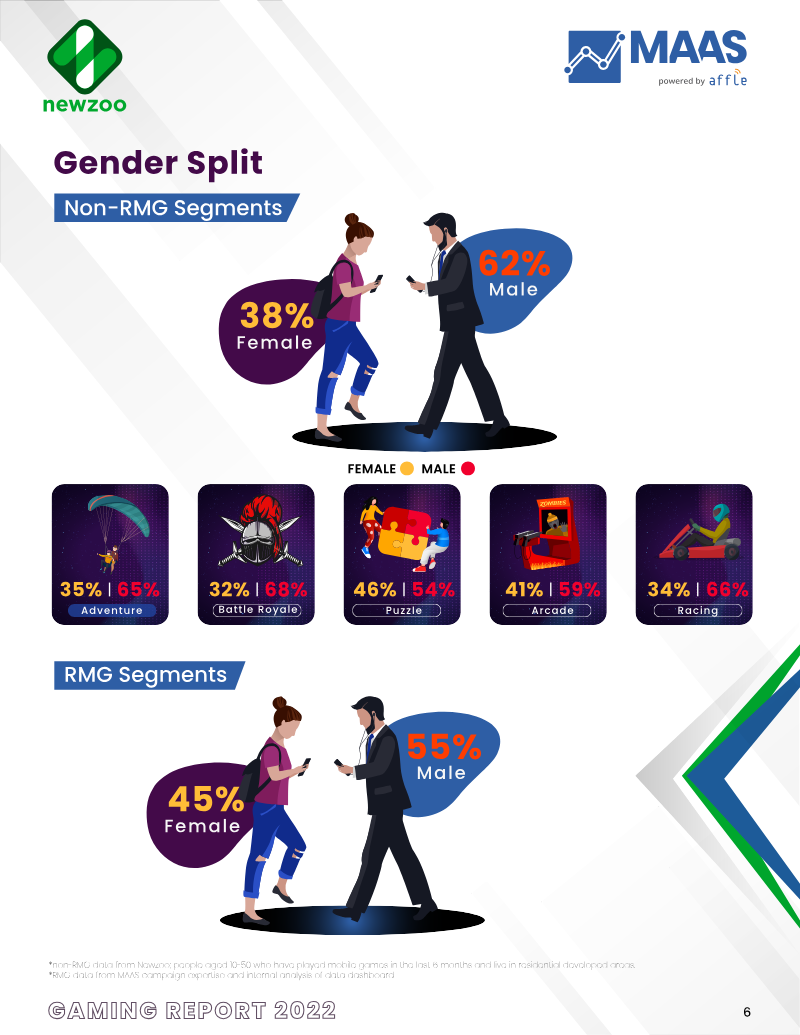
EA · 2022
ReportGames: India Plays!
The report examines the rapidly expanding Indian mobile gaming market, highlighting a projected 91% share of online gamers playing on smartphones and an estimated revenue of US$2.2 billion in 2022, with a projected average revenue per user of US$1.5 by 2027. It distinguishes between non-real-money gaming (non-RMG) and real-money gaming (RMG), focusing on the top five non-RMG genres—Adventure, Battle Royale, Puzzle, Arcade, and Racing—and key RMG categories such as card-based games, sports-fantasy, and casual RMG. Data sourced from Newzoo consumer research and MAAS campaign analytics reveal that 62% of non-RMG players are male, while RMG users skew slightly more balanced at 55% male. Millennials and Gen-Z (ages 13–41) dominate, with 55% of adventure and battle royale players in the 13-27 bracket. Motivations differ: non-RMG gamers seek entertainment and challenge, whereas RMG players are driven by seasonal events like cricket tournaments or festive card-game gatherings. Key performance indicators for advertisers include install-to-registration rates of ~50% for casual games and ~25% for card-based RMG, with retention dropping from 30% on day one to 3% by day thirty for casual titles. The analysis underscores the importance of vernacular creatives, cross-interest programmatic targeting, and multi-channel optimization to reduce audience overlap. It also notes emerging trends—Web3 play-to-earn models, esports growth, and super-app consolidation—that signal continued market maturation. The report concludes that while monetization remains a challenge for non-RMG segments, strategic acquisition and in-game advertising innovations can unlock substantial growth across India’s diverse gaming ecosystem.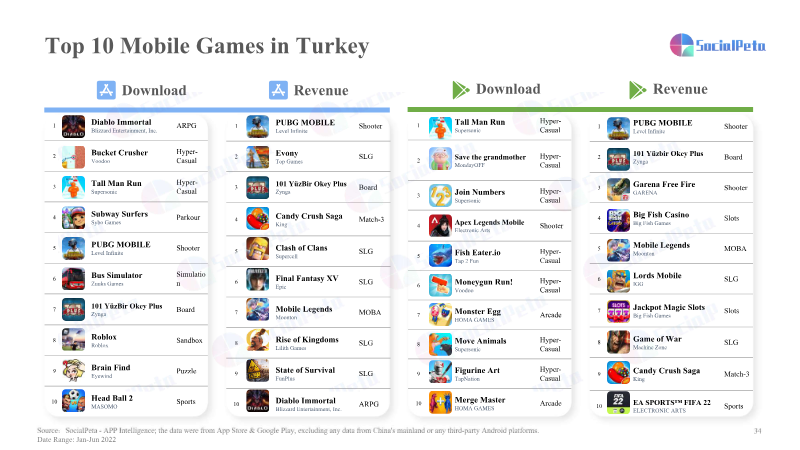
Tencent · 2022
ReportGlobal White Paper on Mobile Advertising & Marketing Game
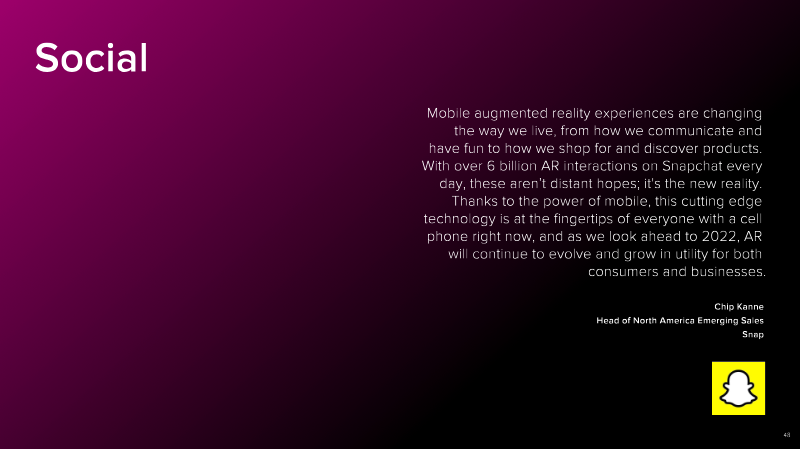
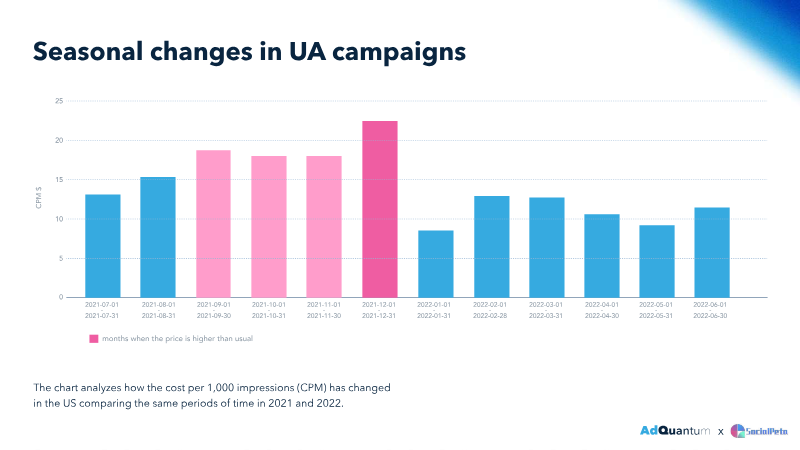
Mobile game advertising in 2022 experienced a pronounced contraction, with total creatives falling nearly 30% year-over-year to 15.8 million while the advertiser base stayed flat at 45,100. The decline stemmed from a shift toward quality-focused marketing and the impact of Apple’s IDFA changes, which pushed spend to Android. Video ads dominated the format mix (over 86% of creatives), and casual/puzzle titles captured the majority of spend, displacing RPGs in many markets. Tier 2 and Tier 3 regions saw significant growth, driven by cross-platform titles such as Genshin Impact and the rise of esports and metaverse expectations. Geographically, China’s HK/Macau/TW region maintained RPG dominance but broadened to action, casual and MOBA campaigns with large budgets. In the United States, mid-core and hardcore titles produced the most creatives despite a 10% revenue decline. Japan’s simulation games led advertising, while Korea shifted from MMOs to card-RPGs and early NFT experimentation. South Asia’s market was shooter-heavy, with casual games generating the most creatives and RPGs producing the highest volumes. Turkey’s top titles were ARPGs and shooters, with a surge in casual and parkour advertising tied to esports and influencer content. Cost dynamics varied by genre and platform: strategy games commanded the highest CPM ($21.58), while casual titles hovered around $17–$18; iOS ads were 15% costlier than Android. Female and older users (55–64) paid the highest CPMs ($22.26) and CPCs ($2.90), yet CTR increased with age across formats. Playable ads delivered the lowest CPI but weakest ROAS, whereas banner ads offered the best return on spend. Emerging channels such as social-first platforms and AR filters proved highly engaging, with Snapchat’s concise, sound-driven ads capturing attention within five seconds and AR filters generating 1.7× more immersive brand links. In India, vernacular marketing and programmatic unified platforms are expanding reach to Tier II/III audiences, while playable and rewarded video formats mitigate banner blindness. Overall, the data underscore a diversification of genre advertising, a continued emphasis on high-budget flexible media strategies, and a pivot toward video-centric, narrative-driven campaigns across high-revenue titles.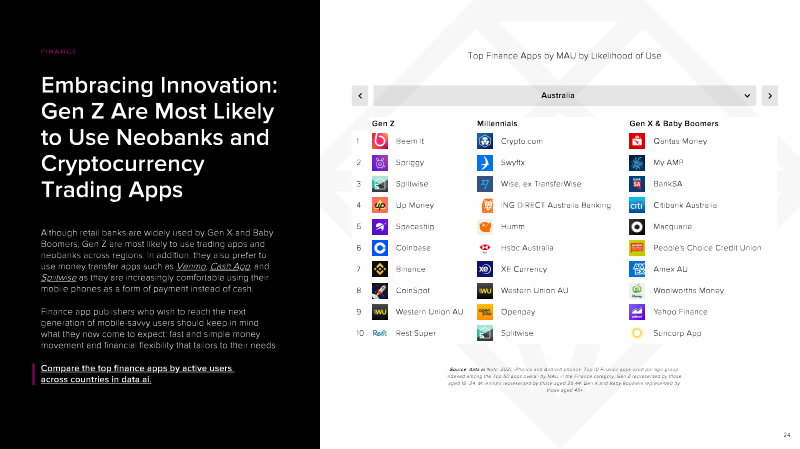
data.ai · 2022
ReportState of Mobile 2022
The global mobile economy experienced unprecedented expansion in 2021, characterized by a 19% year-over-year increase in app store spending to $170 billion and a 23% rise in mobile advertising to $295 billion. This growth was underpinned by a fundamental shift in consumer behavior, as users in leading markets now average 4.8 hours daily on mobile devices. Social, photo, and video applications dominate this engagement, accounting for 70% of time spent. The ecosystem's vitality is further evidenced by the release of 2 million new apps and the emergence of 233 individual titles that each surpassed $100 million in annual consumer spend. Mobile gaming remains the primary engine of monetization, reaching a record $116 billion in spend. While hypercasual titles drive download volume, core gaming experiences like 4X March-Battle strategy and creative sandboxes drive the highest revenue. Beyond gaming, the finance sector saw a 28% increase in downloads, propelled by the rise of neobanks in emerging markets and a surge in cryptocurrency adoption. Similarly, retail engagement surpassed 100 billion hours, while the food and drink sector reached record sessions through the rapid expansion of ultra-fast delivery services. The landscape also reflects a recovery in travel and sports, with engagement returning to pre-pandemic levels alongside a 95% increase in dating app spend since 2018. Emerging trends such as live streaming and avatar-based social platforms indicate growing consumer interest in the metaverse, with live streaming engagement outpacing the general market by nine times. Geographically and corporately, the market is led by U.S. giants like Google and Meta in general utility, while Chinese firms like Tencent dominate the gaming sector. This data illustrates a mature yet diversifying mobile industry that has become the central platform for finance, entertainment, and social interaction globally.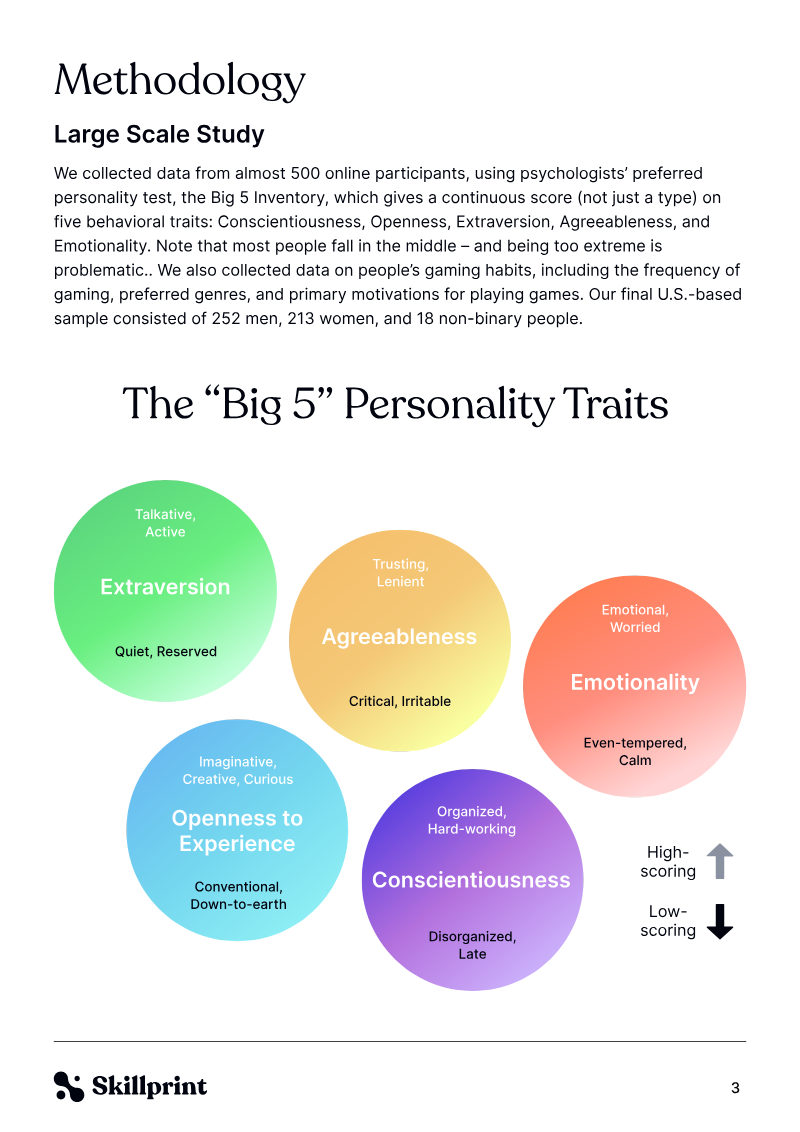

Skillprint · 2022
ReportGames Can Be Good for the Mind: State of Mobile Games – Cognitive and Psychological Benefits
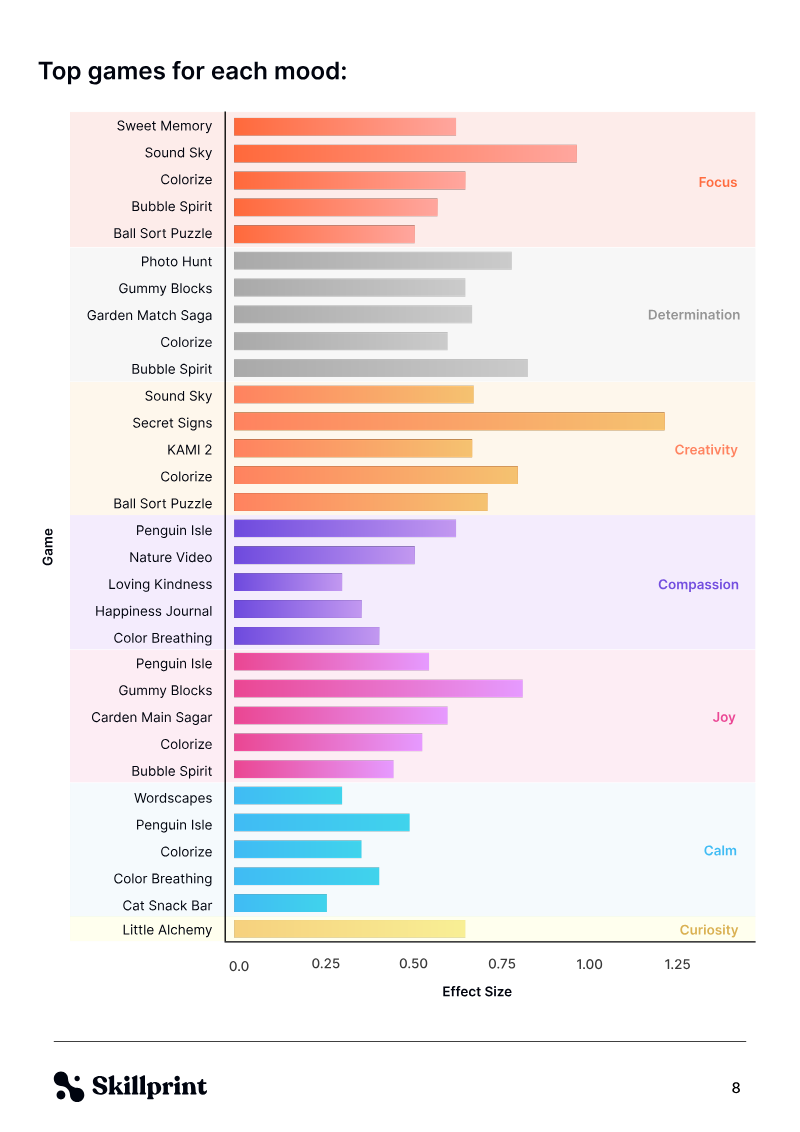
This empirical report by Skillprint examines the cognitive and psychological benefits of mobile gaming, challenging the narrative that gaming is primarily detrimental to mental health. Based on a large-scale study of nearly 500 U.S. participants and 28 individual game impact studies, the research explores the intersection of the Big 5 personality traits, player motivations, and the emotional shifts experienced after gameplay. The methodology utilizes the Big 5 Inventory to assess traits such as Conscientiousness and Emotionality, while measuring mood changes across categories like focus, creativity, and determination using Cohen’s d effect sizes. The findings indicate that mobile games can significantly enhance specific mental states, often outperforming traditional psychological interventions like guided meditation or journaling. For instance, rhythm and puzzle games such as Sound Sky and Colorize showed large effect sizes for improving focus and creativity. The data also reveals that personality traits moderate these benefits; more emotional players tend to prefer word and idle games for relaxation, while open-minded individuals seek immersion and inspiration. Younger players are notably more driven by challenge and focus-oriented gameplay. The report concludes that game developers should prioritize personalization to appeal to diverse personality profiles, such as offering adjustable difficulty levels to satisfy both high-conscientiousness and high-emotionality players. It suggests that health professionals consider mobile games as supplemental tools for treating mood and attention disorders. Ultimately, the research advocates for a nuanced understanding of gaming as a customizable resource for psychological well-being, where specific genres and mechanics—such as timed challenges for focus or sandbox environments for creativity—can be matched to individual user needs.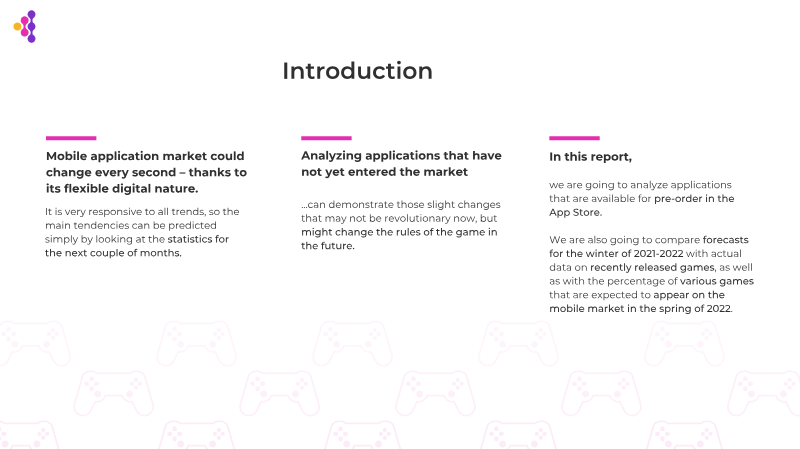
Apptica · 2022
ReportMobile Games on iOS: Winter Results and Forecasts for Spring 2022
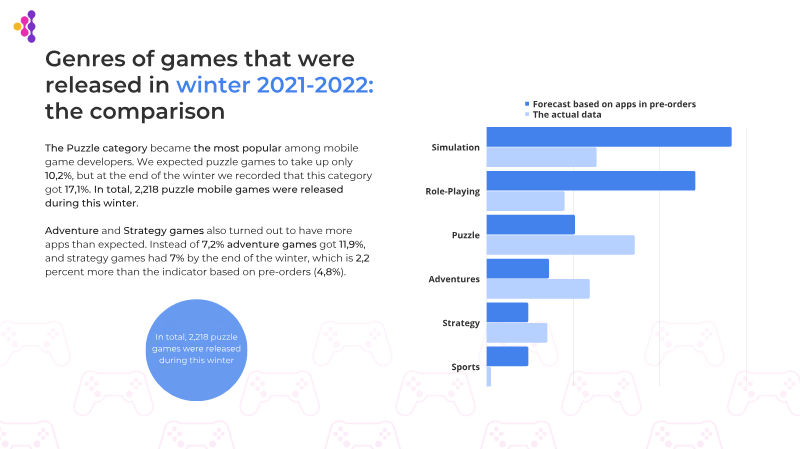
This analysis examines the performance and distribution of iOS mobile applications during the winter of 2021–2022 while providing a strategic forecast for the spring 2022 season. The primary objective is to identify market trends by comparing pre-order data with actual release statistics. The scope is global, focusing specifically on the iOS App Store ecosystem across various categories and gaming genres. Data was sourced exclusively from the Apptica platform, utilizing its pre-orders section to gauge developer intent and market direction. Findings indicate that while games were expected to dominate the winter release cycle at 81% of all upcoming apps, the actual market composition was more diversified. By the end of winter, games represented 11.3% of total new releases, followed closely by Lifestyle and Utilities at 10% each. Within the gaming sector, over 12,400 titles were launched. Although Simulation games were predicted to lead, Puzzle games emerged as the most frequent release, totaling approximately 2,200 titles and accounting for 17.1% of new games. Other significant genres included Action and Adventure, while Role-playing and Sports categories saw fewer releases than initially projected based on pre-order volume. The forecast for spring 2022 suggests continued dominance for the gaming category, which accounts for 82.4% of apps currently in the pre-order phase. Simulation and Role-playing games are tied as the most anticipated genres, each representing 26.5% of upcoming titles. The analysis also notes a shift in non-gaming categories, with an increase in Productivity, Dating, and Medical apps, while Food and Drink applications have disappeared from the spring pre-order list. Key takeaways emphasize that Puzzle, Role-playing, and Simulation genres remain the primary drivers of the iOS market, maintaining steady growth and developer interest moving into the next quarter.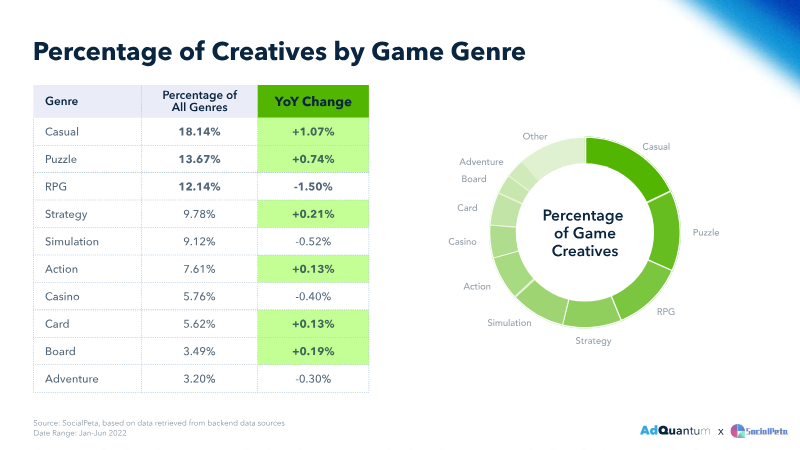
AdQuantum · 2022
ReportThe State of Mobile Game and App Markets: Global Report on App Marketing for H1 2022
The mobile app and gaming landscape underwent a significant strategic pivot during the first half of 2022, characterized by a transition from high-volume advertising to a quality-centric model. Faced with rising user acquisition costs and the ongoing impact of privacy-centric changes like Apple’s App Tracking Transparency, marketers reduced the total volume of ad creatives by nearly 30% year-over-year. This contraction reflects a broader industry shift toward predictive analytics, automated campaign management, and the prioritization of high-performing creative mechanics that resonate with increasingly selective audiences. Financial pressures intensified during this period, as evidenced by an 18% increase in average CPMs for mobile games and a 64% surge for non-gaming applications. To mitigate these rising costs, publishers are diversifying their traffic sources beyond traditional dominant platforms like Meta, increasingly turning to Unity Ads, AppLovin, and offerwall formats. Furthermore, the industry is actively adapting to the post-IDFA environment by prioritizing Android-based growth, leveraging Apple Search Ads, and implementing sophisticated creative onboarding strategies to improve user tracking opt-in rates. Geographically, while North America and Europe remain central to high-value user acquisition, there is a clear strategic expansion into Tier-2 and Tier-3 markets to sustain growth. Success in this challenging economic climate now relies on a multifaceted approach that integrates App Store Optimization, cross-departmental collaboration, and a focus on long-term metrics such as Cost Per Purchase and IAP ROAS. By emphasizing user-generated content and refining attribution windows, publishers are successfully navigating a more complex regulatory and competitive landscape, ensuring that marketing efforts remain both efficient and scalable despite the prevailing headwinds.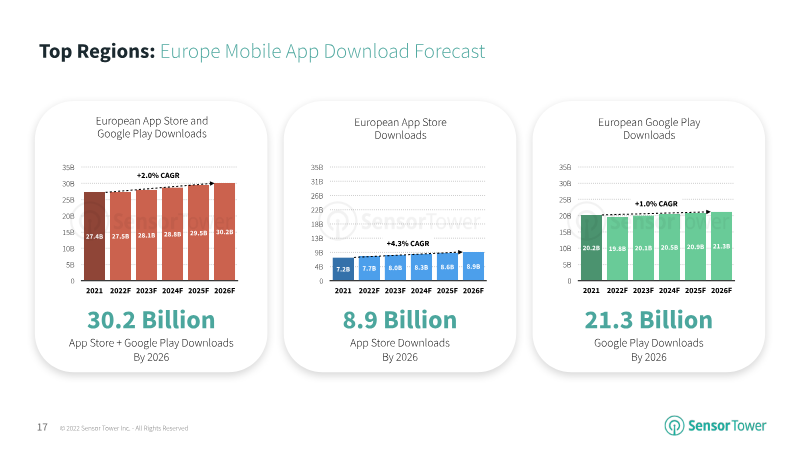

Sensor Tower · 2022
ReportMobile Market Forecast 2022‑2026
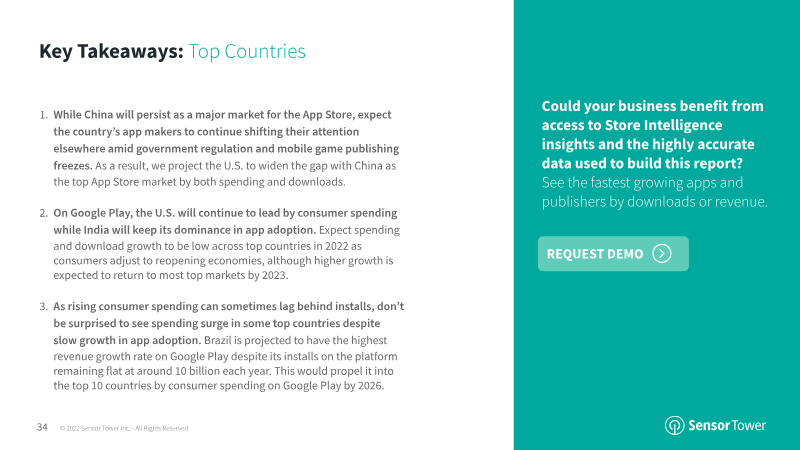
The forecast projects a decisive shift in the global mobile app economy between 2022 and 2026, positioning the United States as the pre-eminent App Store market for both consumer spending and download volume, overtaking China for the first time. While the United States already leads Google Play revenue, India continues to register the highest adoption rates, and Brazil is expected to break into the top tier of markets by the mid-term horizon. Growth is predicted to decelerate in 2022, reflecting macro-economic headwinds, but a robust rebound is anticipated from 2023 onward, driven by renewed consumer confidence and expanding monetisation strategies across emerging regions. The analysis draws on comprehensive data covering major geographic territories—including North America, Europe, East Asia, South Asia, and Latin America—and spans the full spectrum of mobile industry segments, from app store transactions and download activity to advertising spend and software-development-kit performance. By integrating these variables, the forecast delivers a granular view of revenue trajectories, market share dynamics, and user-acquisition trends that inform strategic planning for developers, marketers, and investors. Underlying the outlook is Sensor Tower’s suite of intelligence products—Store, App, Ad, Usage, and Benchmark Intelligence—designed to support organic growth, optimise paid acquisition, and evaluate SDK efficacy. The firm’s proprietary data and analytical tools underpin the projections, while usage policies restrict unauthorised redistribution of the findings. Contact channels for demonstrations, media, and sales are provided to facilitate deeper engagement with the platform’s capabilities.
SocialPeta · 2022
Whitepaper2022 Global White Paper on Mobile Advertising & Marketing Game
The global mobile market in the first half of 2022 underwent a significant transition, characterized by a contraction in total advertising volume alongside a strategic pivot toward high-quality, video-centric content. While the total number of advertisers and ad creatives declined year-over-year, emerging markets in the Middle East, South America, and Southeast Asia experienced robust growth. This period saw a sharp rise in advertising costs, with the average CPM reaching $19.31 and the United States and South Korea emerging as the most expensive regions for user acquisition. Casual and puzzle games dominated the advertising landscape by volume, yet RPGs and strategy titles commanded the highest revenue and advertising spend. A notable trend involved mid-core developers utilizing "lightweight" or drama-based video creatives to lower entry barriers for broader audiences. Video formats now constitute over 86% of all creatives, with interactive AR filters and short-form content on platforms like Snapchat and TikTok challenging the traditional dominance of Meta. In the non-gaming sector, shopping and finance apps led in advertiser activity, while reading apps produced the highest volume of individual creatives. The industry faced headwinds from Apple’s IDFA privacy changes, prompting a shift toward "motivation-based" creative strategies and localized global launches, particularly by Chinese firms seeking relief from domestic regulatory pressures. Despite rising costs and a 27% drop in creative volume, the market remains dynamic, driven by the expansion of esports, cross-platform play, and a growing consumer interest in the metaverse. Success is increasingly defined by down-funnel conversion optimization and the use of immersive, emotionally resonant storytelling to engage diverse global demographics.


Liftoff · 2022
Report