Reports in the Market (Overall) category.
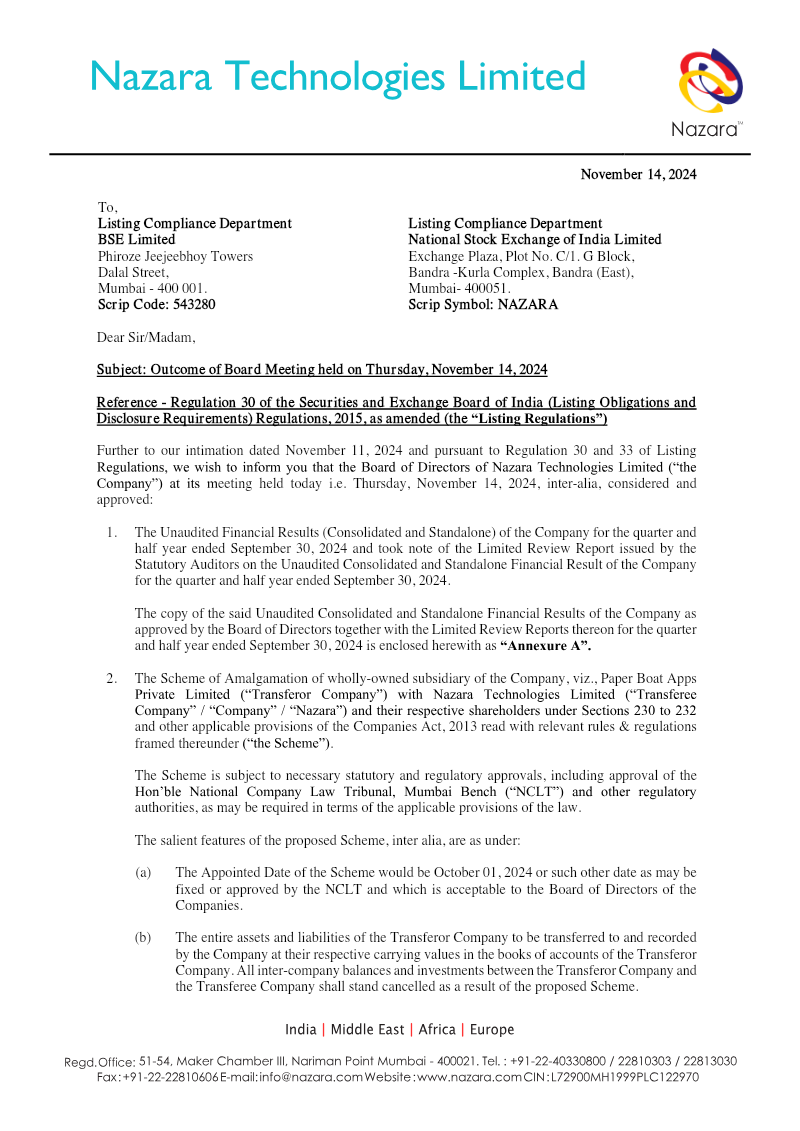
Nazara Technologies Limited is undergoing a period of aggressive strategic expansion and operational consolidation, as evidenced by its financial performance for the quarter and half-year ended September 30, 2024. The company reported a 7% year-over-year increase in consolidated revenue, reaching ₹56,902 lakh, with the eSports segment serving as the primary growth engine. While standalone net profits saw a substantial increase to ₹1,273 lakh for the quarter, total comprehensive income experienced a slight decline due to rising operational costs and losses from discontinued operations. This financial landscape is further complicated by significant industry-wide regulatory challenges, specifically outstanding Goods and Service Tax show cause notices totaling approximately ₹1,120 crore across two subsidiaries.
The corporate strategy focuses heavily on streamlining the portfolio through both high-value acquisitions and the divestment of non-core assets. Key developments include the full acquisition and subsequent merger of Paper Boat Apps, the strategic purchase of Fusebox Games, and the integration of Freaks 4U Gaming. To fuel this inorganic growth and support future projects, the board authorized a substantial fundraise of ₹90,000 lakh through preferential equity issuance. This capital injection is intended to bolster a balance sheet that saw a net cash outflow from operating activities during the first half of the fiscal year.
Geographically and operationally, the company is positioning itself as a global gaming and eSports powerhouse, evidenced by its investment in Moonshine Technology and the expansion of its international stepdown subsidiaries. By divesting stakes in entities like Crimzoncode Technologies and NzMobile Kenya while simultaneously consolidating domestic holdings, the organization aims to optimize its corporate structure. This dual approach of aggressive capital deployment and internal restructuring defines the current fiscal period, as the entity seeks to balance rapid scaling with the management of significant tax-related legal contingencies.
The financial results for the third quarter of 2024 reveal a period of stabilization and shifting cost structures within the gaming portfolio. Revenue for the quarter reached $111 million, reflecting a 5% increase from the previous quarter but an 8% decline compared to the same period in 2023. Profitability showed significant recovery from a net loss of $3 million in the first quarter of 2024 to a profit of $15 million in the third quarter, while Adjusted EBITDA remained steady at $16 million.
Operating metrics indicate a transition in user engagement and monetization. Monthly Paying Users (MPUs) grew to 381,000, a 21% increase year-over-year, though Average Bookings Per Paying User (ABPPU) declined by 11% to $92. Total bookings for the quarter stood at $108 million, showing a 6% year-over-year decrease but remaining relatively flat compared to the first half of 2024. The geographic distribution of revenue remains concentrated in the United States at 53%, followed by Europe at 22% and Asia at 14%.
The product portfolio is led by the Hero Wars franchise, with Hero Wars: Alliance and Hero Wars: Dominion Era accounting for 37% and 34% of revenue, respectively. Island Hoppers has emerged as a significant contributor, growing its revenue share from 4% in Q3 2023 to 7% in Q3 2024. Platform distribution remains dominated by mobile at 62%, with PC contributing 38%. Cost management efforts are evident in the reduction of total costs and expenses (excluding depreciation and amortization) to $94 million, down 13% from the prior year, driven largely by a decrease in selling and marketing expenses which now represent 25% of the cost base.
Skillz Inc. reported its unaudited financial results for the third quarter ended September 30, 2024, highlighting a period of strategic transition focused on operational efficiency and disciplined expense management. The company generated $24.6 million in revenue, a decrease from $36.4 million in the prior-year period. Despite the revenue decline, the company narrowed its net loss to $21.1 million compared to $33.5 million in the third quarter of 2023. Adjusted EBITDA loss also improved year-over-year, moving from $18.5 million to $13.9 million.
Key performance indicators for the mobile gaming platform showed a paying monthly active user (PMAU) count of 121,000, which remained stable on a sequential quarterly basis. The average revenue per paying monthly active user (ARPPU) stood at $67.60. Management emphasized a shift toward high-efficiency user acquisition, achieving a systemwide payback period of approximately six months. Total operating expenses, excluding cost of revenue, were reduced to $42.2 million, reflecting significant cuts in research and development, sales and marketing, and general and administrative costs.
The geographic scope of the report covers global operations from the company’s Las Vegas headquarters, focusing on the three- and nine-month periods ending September 30, 2024. Financial stability remains a core pillar of the company's thesis, with a balance sheet carrying over $300 million in cash and restricted cash. This liquidity is intended to fund turnaround initiatives, including new product features and a planned increase in user acquisition spend. Leadership expressed optimism regarding the company's trajectory, projecting a return to positive Adjusted EBITDA on a run-rate basis in 2025. The results were disclosed via a Form 8-K filing with the SEC, incorporating standard GAAP to non-GAAP reconciliations.
The November 2024 Game Developer Collective Survey examines how game developers allocate resources to software tools and services, focusing on the adoption of game engines, cloud platforms, and ancillary technologies. The central thesis is that while the market now offers a broader array of solutions than ever before, studios face divergent realities: many are eager to leverage these options to boost efficiency and output, yet a substantial portion confronts tightening budgets that limit further investment. This tension is reflected in the “Industry Conditions and Performance” findings, which portray a challenging commercial environment for the sector.
Key observations indicate that developers increasingly view diversified toolsets as pathways to improved productivity, but cost pressures are intensifying across regions. The survey highlights a split between studios that can expand their technology stack and those that must defer additional spending, underscoring a growing disparity in capability to innovate. The analysis also signals that forthcoming research on “Working Environments,” slated for release in January 2025, will delve deeper into how these financial constraints intersect with workplace dynamics and talent management.
The study spans a global developer base, encompassing respondents from the Americas, Europe‑Middle East‑Africa, and Asia‑Pacific, and captures sentiment as of November 2024. Although specific sample sizes and data sources are not disclosed in the excerpt, the findings are presented under the Omdia research umbrella, with standard disclaimer language indicating that the material is provided “as‑is” and reflects the original publication date. The survey’s conclusions serve as a barometer of current investment trends and the fiscal pressures shaping the game development landscape.
The Indian interactive media and gaming market reached a valuation of $3.8 billion in FY24, representing a significant 30% share of the country’s broader $12.5 billion new media sector. Growth is characterized by a 20% five-year projected CAGR, with expectations to exceed $9.2 billion by FY29. This expansion is primarily driven by a 41% year-on-year increase in in-app purchase revenue, particularly within the midcore segment, which grew by 53%. While Real Money Gaming (RMG) remains a major contributor, recent changes to the GST regime have led to margin compression and increased user acquisition costs for operators in that sub-sector.
The player base in India has expanded to 590 million gamers, with 148 million identified as paying users. Engagement metrics show a 30% increase in average weekly time spent, rising from 10 to 13 hours. Demographic data reveals a diversifying landscape where 44% of gamers are women and 66% reside in non-metro cities. Notably, there is a high degree of overlap between gaming categories, as over 60% of RMG paying users also spend money on midcore titles. Payment behaviors are heavily modernized, with 83% of users utilizing UPI or digital wallets for transactions.
The regulatory environment is shifting toward formal recognition and support, with the government identifying gaming as a "sunrise sector." New frameworks distinguish between RMG and Free-to-Play (F2P) games for taxation purposes, while esports has been officially integrated under the Ministry of Youth Affairs and Sports. These findings are based on a mixed-methods research design conducted between May and October 2024, incorporating a primary survey of 2,269 smartphone users across 16 Indian cities alongside secondary analysis of financial statements and proprietary industry data.
This analysis examines the evolving landscape of game development tools and services amidst a period of significant market volatility. Based on a November 2024 survey of the Game Developer Collective, the findings track shifts in engine preference, cloud infrastructure, and overall industry sentiment. The survey includes a global sample of developers, with 48% based in North America and 39% in Europe, primarily representing roles in programming, management, and game design.
A primary focus is the game engine market, which continues to react to Unity’s 2023 "runtime fee" controversy. Despite Unity eventually scrapping the fee, the company has steadily lost market share to Unreal Engine. While the percentage of Unity users planning to switch engines dropped from a peak of 70% in late 2023 to 36% in late 2024, this remains significantly higher than the 14% switch rate seen among users of competing engines. Sentiment toward Unity has moderated, but only 30% of developers report being happy with the company, suggesting a lasting impact on brand trust.
The broader industry environment is characterized by increasing financial pressure and underperformance. Approximately 55% of developers now describe market conditions as "bad," a notable increase from 47% six months prior. Business performance has also declined, with 41% of studios reporting they are underperforming against expectations. Consequently, while investment in tools remains steady for most, there is a growing emphasis on productivity and efficiency as the primary drivers for new purchases. AI-powered tools are a rare area of growth, with studios more likely to increase spending in this category compared to traditional services.
In specialized segments, Blender has emerged as the leading 3D modeling tool, used by 50% of studios. Cloud platform usage is at an all-time high, led by AWS and non-hyperscaler options, though these services remain highly "sticky" with low intent to switch providers. Conversely, specialist backend platforms struggle with low penetration, as only 38% of studios currently utilize these centralized solutions. Overall, the findings depict a cautious industry prioritizing efficiency and stability while navigating a difficult commercial climate.
The second quarter 2024 financial results for the organization reveal a period of strategic transition characterized by a slight decline in revenue alongside a significant recovery in profitability. Revenue for the quarter reached $106 million, representing an 8% year-over-year decrease. However, the company reported a net profit of $15 million, a substantial improvement from the $1 million loss recorded in the first quarter of 2024. Adjusted EBITDA followed a similar trajectory, rising to $16 million in the second quarter after a negative $3 million result in the previous period.
Operating metrics indicate a stabilizing user base with 381,000 monthly paying users, consistent with the first quarter but down from 392,000 in the prior year. Average bookings per paying user stood at $88, reflecting a 6% year-over-year decline. The company’s portfolio remains heavily reliant on the Hero Wars franchise, with Hero Wars: Alliance and Hero Wars: Dominion Era accounting for a combined 89% of revenue. Geographically, the United States remains the primary market at 51% of revenue, followed by Europe at 22% and Asia at 15%.
Strategic highlights for the period include the successful launch of Pixel Gun 3D on PC via Steam, which recouped development costs on its first day without dedicated marketing spend. Additionally, a high-profile collaboration between Hero Wars and the Tomb Raider brand drove a 25% year-over-year increase in new payers during the month of the campaign. While mobile remains the dominant platform at 58% of revenue, the PC segment grew to 42%, up from 38% in the same period last year, signaling a successful push toward platform diversification. These unaudited results suggest that while top-line growth remains pressured, disciplined cost management and brand collaborations are effectively supporting the bottom line.
Paradox Interactive reported a significant increase in profitability for the third quarter of 2024 despite a broader year-to-date decline in revenue. Quarterly revenues rose 2% to MSEK 434.0, while operating profit surged 67% to MSEK 142.8. This quarterly performance was driven by core titles including Cities: Skylines, Crusader Kings III, Hearts of Iron IV, and Stellaris, alongside the full release of Mechabellum. However, for the first nine months of 2024, revenues decreased by 9% to MSEK 1,491.8, and operating profit fell 39% to MSEK 326.1, largely due to MSEK 208.0 in write-downs related to the cancellation of Life by You and the performance of The Lamplighters League.
The strategic focus has shifted toward doubling down on the core Grand Strategy and Management niches while streamlining third-party publishing processes. This transition included the indefinite delay of Prison Architect 2 to ensure product quality. Geographically, the United States remains the dominant market, accounting for approximately 86% of year-to-date revenue. From a platform perspective, PC remains the primary segment, contributing MSEK 1,285.6 of total revenue, with the Steam platform alone representing the vast majority of group sales.
Financial stability remains high with a cash balance of MSEK 1,190.4 and an equity/assets ratio of 80%. While the average number of employees decreased from 634 to 584 year-over-year, the company maintains an active pipeline of eight games. The methodology for these findings involves a condensed interim financial report prepared under IAS 34 and reviewed by external auditors, covering the global operations of the Stockholm-based parent company and its five international studios for the period ending September 30, 2024.
The analysis presents a quarterly snapshot of investment activity in the global video‑games ecosystem for the third quarter of 2024, aiming to map how capital is flowing across content creators, platform and technology providers, and the broader market. By aggregating closed‑deal data from public sources and proprietary research, the study tracks private equity, venture capital, corporate venture, mergers and acquisitions, and public offerings, while excluding gambling, betting and blockchain‑focused entities.
Capital deployment in Q3 2024 reached $113 billion in private investments, $119 billion in merger‑and‑acquisition transactions, and $63 billion in public‑market offerings, reflecting a stabilization of private rounds at roughly $1 billion across 120 deals. M&A activity shows a resurgence, with at least one transaction exceeding $1 billion announced each quarter, whereas public listings remain scarce, with the first IPO in two years and continued market pressure. Gaming studios secured more than $100 million per quarter across 30 rounds, with early‑stage VC funding concentrated in North America and Western Europe (13 deals totalling $48 million and 10 deals totalling $45 million respectively), while late‑stage rounds and corporate investments were modest.
Investments in platform and technology ventures outpaced pure gaming content, accumulating $768 million in private capital across 28 rounds, driven by AI
Sega Sammy Holdings reported a steady start to the fiscal year ending March 2025, characterized by strategic portfolio restructuring and targeted expansion into the online gaming market. For the first quarter, the company recorded sales of 104.7 billion yen and an operating income of 19.3 billion yen. While these figures represent a slight year-over-year decline in top-line revenue, profit attributable to owners of the parent rose significantly to 24.5 billion yen. This increase was primarily driven by an extraordinary income of 8.4 billion yen following the transfer of Phoenix Resort shares to Fortress Investment Group, a move intended to leverage specialized expertise in the hospitality sector while retaining a 20% voting interest.
The Entertainment Contents segment remains the primary growth engine, generating 72.5 billion yen in sales during the quarter. Performance was bolstered by favorable foreign exchange impacts and the integration of Rovio. Although full-game unit sales reached 5.86 million units—surpassing the previous year—the company expects its most significant revenue contributions to occur from the third quarter onward with the launch of major titles such as Sonic X Shadow Generations and Metaphor: ReFantazio. In the Pachislot and Pachinko segment, the company maintained a steady pace with 28.8 billion yen in sales, preparing for the second-quarter launch of the featured smart pachinko title, e Hokuto No Ken 10.
Geographically, the company is aggressively targeting the North American market. This is evidenced by the July 2024 announcement to acquire Stakelogic B.V. for an enterprise value of €130 million. This acquisition, combined with the previous GAN agreement, aims to establish a comprehensive B2B online gaming platform. Additionally, the Gaming segment saw strong U.S. performance from the Railroad Riches slot series. Looking ahead, Sega Sammy has outlined a three-year capital allocation plan through FY2027, earmarking over 120 billion yen for R&D and 100 billion yen for strategic investments, while maintaining a shareholder return policy of at least a 3% DOE or a 50% total return ratio.
This analysis of the 2024 U.S. video gaming market identifies a resilient landscape where 71% of the population, or approximately 236.4 million people, engage with games. While this reflects a slight decline from the 74% peak seen in 2020, it remains significantly higher than the 67% recorded in 2018. The study utilizes a survey of 5,100 active gamers aged two and older, conducted between May and June 2024, to categorize the audience into six distinct behavioral segments: Super Gamers, Console Warriors, Transitionals, Easy Accessors, Daily Dabblers, and Incidental Players.
A primary finding is that while the total player count has dipped slightly, engagement and monetization are increasing. Gamers now spend an average of 14.5 hours per week playing, an increase of 1.8 hours since 2022. Spending has also risen to an average of $56.20 over a six-month period. Mobile remains the most pervasive platform, used by 65% of the total population, while console gaming has seen the most significant growth in weekly time investment. Conversely, PC gaming saw a 4% decline in reach since 2022.
The market is shifting toward more dedicated segments. There has been a notable decrease in casual "Incidental Players" and "Daily Dabblers," with a corresponding migration toward "Super Gamers" and "Transitionals." Super Gamers represent the most valuable demographic, typically consisting of males aged 18 to 34 who play across multiple platforms and engage deeply with gaming culture, including streaming and esports. Although teens and young adults remain the most valuable segments in terms of time and spend, the report notes that player investment is rising across nearly all age groups despite the overall contraction in the total number of gamers.
This analysis examines global consumer engagement with video games, drawing on data from over 73,000 surveyed individuals across 36 markets. The findings reveal that gaming has become a dominant pillar of modern entertainment, with 80% of the total online population playing games and 85% engaging with the medium through playing, viewing content, or participating in social communities. Engagement is highest among younger demographics; over 90% of Gen Alpha and Gen Z consumers are game enthusiasts, with Gen Alpha notably spending more time on gaming (5.2 hours per week) than on social media.
The data highlights a significant shift in how different generations and genders interact with the medium. While Adventure is the top genre for Gen Alpha, Gen Z, and Millennials, younger female players are increasingly likely to invest in pay-to-play titles, challenging traditional industry stereotypes. On PC and console platforms, players are motivated primarily by vast open worlds and deep storytelling. These platforms also attract higher-spending audiences compared to mobile; 22% of console players spend more than $25 per month, and over half are classified as medium-to-high spenders.
Despite a market where a small number of established franchises capture the majority of playtime, a vital segment of "new game seekers" remains. Approximately 31% of PC and console players actively hunt for trending titles. This cohort is highly valuable, as 80% of them spend money on games monthly and they are 50% more engaged than the average player. Geographically, this appetite for new experiences is strongest in emerging markets like China, India, and Saudi Arabia, while more mature markets like Japan and Western Europe show more conservative play patterns. The findings suggest that success in a competitive landscape requires moving beyond playable experiences to engage consumers across multiple dimensions, including social media, creator content, and transmedia brands.