
Report93 pages
Die Games - Branche in Deutschland 2025
The study evaluates the German games industry in 2025, building on earlier reports to assess economic performance, employment, and the influence of federal funding. It surveys 343 companies—28 % of a population of 1,205—and integrates primary data with secondary sources such as gamesmap and DLR. The sector has expanded rapidly, doubling core‑market firms from 619 in 2018 to roughly 1,200 by mid‑2025 and nearly doubling the extended core market. Revenue rose from €3.06 bn in 2018 to €3.73 bn in 2024, a 22 % increase, with development‑sector sales growing 148 %. Despite this growth, the market remains highly fragmented: three‑quarters of firms employ fewer than ten people and only 19 % belong to foreign conglomerates. Export earnings dominate, accounting for 76 % of revenue, largely within the EU and North America/Asia.
Employment data reveal a clear link between company size and workforce composition. Larger firms (>€25 M revenue) employ 85 % full‑time staff, whereas micro‑enterprises rely heavily on owners and freelancers. Female representation has risen to nearly one‑third of the workforce, and international talent now constitutes 35 % of employees. Technical and creative roles dominate, while commercial positions have declined. Salaries average €62 k annually, with lead‑level pay ranging from €50–80 k and a strong correlation between company size and remuneration.
Federal funding has been pivotal, with 71 % of developers receiving or planning to receive support. In 2023, €70 million in subsidies generated €277 million of investment and €453 million of total value‑creation, yielding a multiplier of 6.5 for output and 2.5 for fiscal impact. However, high personnel costs remain a significant challenge, with 57 % of respondents rating them as “very bad.” The industry also serves as a talent magnet and innovation catalyst, with 70 % of spill‑overs stemming from game engines, gamification, and AR/VR technologies adopted across automotive, architecture, film, training, AI, and other sectors.
- The German games industry has nearly doubled its core-market presence since 2018, growing from 619 to approximately 1,200 firms by mid-2025.
- Federal funding acts as a major economic driver, where €70 million in 2023 subsidies generated €453 million in total value-creation, representing a 6.5x output multiplier.
- Industry revenue reached €3.73 billion in 2024, a 22% increase since 2018, with the development sector specifically surging by 148%.
- Export earnings are the primary revenue driver, accounting for 76% of total sales, with key markets located in the EU, North America, and Asia.
- The sector is highly fragmented, with 75% of companies employing fewer than ten people and only 19% of firms owned by foreign conglomerates.
gameApr 2026

Report33 pages
2026 Global Non‑Gaming App Trends Report
The report argues that non‑gaming mobile applications are experiencing accelerated growth driven by AI integration, short‑form content, and intensified user acquisition competition. Key findings show that Android dominates download volume—particularly in Utilities (79 % of installs) and Life Services (58 %)—while iOS generates a higher share of revenue, especially in Finance & Business (56 % of iOS revenue) and Life Services (57 %). In 2025, AI‑focused apps such as ChatGPT (+1,340 %) and Perplexity (+3,613 %) achieved the highest year‑over‑year download growth, and Short Drama titles like Kuku TV (+45 % k) and RapidTV (+498 %) recorded explosive revenue increases, with AI Social apps (e.g., Character AI +918 %) also driving significant monetization.
User acquisition activity expanded across all major categories, with Life Services (+42 %) and Finance & Business (+43.5 %) leading the rise in app counts. Smart bidding adoption surged, with Target ROAS spend increasing by 50 % and Target CPE spending up 57 %, particularly in Utilities and Entertainment. Cost‑per‑install (CPI) analysis revealed that E‑Commerce on Android commands a 3× premium, while Finance & Business on iOS reaches 4.6×, underscoring high competition for transactional users.
Monetization patterns shift toward in‑app advertising (IAA), dominating across Education, Utilities, and Entertainment. Video formats—rewarded and interstitial—outperform banner ads by 128–165× eCPM, with North America delivering the highest rewarded video eCPMs (up to 11.8× in Short Drama). The report covers global markets excluding Mainland China from January to December 2025, drawing on anonymized data from Mintegral and Insightrackr across 100+ key app categories.
- AI-focused applications experienced massive 2025 growth, led by Perplexity (+3,613%), ChatGPT (+1,340%), and Character AI (+918%).
- Short Drama apps like RapidTV (+498%) and Kuku TV (+45k%) are driving explosive revenue, with North American rewarded video eCPMs for this category reaching up to 11.8x.
- Android leads in global download volume, particularly in Utilities (79%) and Life Services (58%), while iOS captures the majority of revenue in Finance & Business (56%) and Life Services (57%).
- User acquisition competition is intensifying, evidenced by a 50% increase in Target ROAS spending and a 57% rise in Target CPE spending, particularly within Utilities and Entertainment.
- Cost-per-install (CPI) premiums remain high for transactional users, reaching 3x for E-Commerce on Android and 4.6x for Finance & Business on iOS.
MintegralApr 2026

Report97 pages
State of Mobile 2026
The 2026 State of Mobile report demonstrates that the global mobile ecosystem remains mature yet increasingly monetized, with 2025 in‑app purchase (IAP) revenue reaching $85.6 billion—a 21 % year‑over‑year rise that now places non‑game apps ahead of games for the first time. Generative AI and short‑form drama have become the fastest‑growing subgenres, driving double‑digit IAP growth; AI assistants such as ChatGPT alone generated $3.4 billion in 2025, while short‑drama apps captured more than ten percent of global video‑entertainment time. These categories also show a shift from acquisition to retention, with session volumes outpacing downloads and time spent tripling in AI apps.
Hybrid‑casual and hyper‑casual games continue to lead revenue growth, especially in Tier 2 markets where downloads are falling but engagement is surging. Publishers targeting these segments can capture higher revenue per user, though they face tighter ad‑spend competition and a move toward high‑attention formats. In the gaming web arena, Roblox dominates with 74 % of game‑publisher site visits in 2025, underscoring the importance of product‑centric web design.
Beyond entertainment, general‑shopping apps such as Temu and Amazon maintain massive download volumes, with grocery and buy‑and‑sell subgenres growing 5 % and 4 % YoY, respectively. Food & drink apps hit a record 2.4 billion downloads in 2025, driven largely by emerging markets like India and the Middle East. Mobility and sports apps also show notable shifts: Waymo’s standalone app captured 15 % of rideshare MAUs in key U.S. metros, while DFS‑style sports betting apps now command 80 % of the betting‑app MAU share, reflecting regulatory impacts and new market entrants.
Overall, the report covers a global geographic scope with particular emphasis on the U.S., India, Western Europe, and emerging Tier 2 markets. It spans 2025 data with forward‑looking insights for 2026, highlighting AI’s transformative role across monetization, user engagement, and competitive dynamics in the mobile industry.
- Non-game apps surpassed games in in-app purchase (IAP) revenue for the first time in 2025, contributing to a total global IAP market of $85.6 billion, a 21% year-over-year increase.
- Generative AI and short-form drama are the fastest-growing subgenres, with AI assistants like ChatGPT generating $3.4 billion in 2025 and short-drama apps capturing over 10% of global video-entertainment time.
- Roblox solidified its dominance in the gaming web arena, accounting for 74% of all game-publisher site visits in 2025.
- Hybrid-casual and hyper-casual games are seeing surging engagement and higher revenue per user in Tier 2 markets, despite a broader trend of declining download volumes.
- Daily Fantasy Sports (DFS)-style apps now command 80% of the betting-app monthly active user (MAU) share, driven by new market entrants and regulatory shifts.
Sensor TowerApr 2026

Report52 pages
State of the Game Industry 2026
The industry snapshot reveals a workforce that remains predominantly male and White, yet shows growing diversity in gender identity, sexual orientation, and geographic mobility. Two‑thirds of respondents are male, 24 % female, and 8 % non‑binary, with 28 % identifying as LGBTQ+. The U.S. dominates the sample (54 %), and California remains the top state of residence, while Washington has experienced the largest influx. Most workers are under 35 (64 %) and concentrated in design, programming, and visual arts roles.
Layoffs continue to be a significant concern, especially within AAA studios where two‑thirds of respondents report company layoffs and nearly one in five have been personally let go. Indie studios experience fewer corporate cuts, yet a higher proportion of individuals report personal layoffs. Roughly half of all respondents anticipate no layoffs in the next year, but those with prior layoff experience express greater uncertainty.
Generative AI elicits polarized views: 42 % see it as a productivity catalyst, while 38 % view it as ethically problematic and potentially job‑threatening. The debate centers on balancing efficiency gains against concerns over originality, labor displacement, and environmental impact.
VR/AR/MR remains a niche segment, with only 8 % of respondents engaged in such projects. Meta Quest/Horizon dominates the market, and accessibility features are widely adopted, though advanced options lag behind. Monetization trends show premium titles favor digital downloads and physical copies, whereas free‑to‑play games rely heavily on in‑app purchases for currency and cosmetics.
Crunch culture persists, with 87 % of workers clocking overtime in the past year and over half citing essential work or self‑pressure as drivers. Union support is strong in the U.S., with 82 % backing unionization and a majority expressing interest, though leadership opinions are slightly more divided.
- Layoffs remain a critical industry issue, with two-thirds of AAA studio employees reporting company-wide cuts and nearly 20% of the total workforce having been personally let go.
- Workplace culture remains characterized by persistent crunch, as 87% of employees clocked overtime in the past year, largely driven by perceived necessity or self-imposed pressure.
- Generative AI adoption is deeply polarized, with 42% of professionals viewing it as a productivity tool while 38% fear it poses ethical risks and threats to job security.
- Support for labor organization is high, with 82% of U.S. respondents backing unionization and a majority expressing personal interest in joining a union.
- The industry workforce is predominantly male (66%) and under 35 (64%), with a significant concentration of talent located in the United States (54%), particularly in California and Washington.
GDCApr 2026

Report80 pages
PC & Console Gaming Report 2026
1. Market trajectory What direction is the PC and console market heading in 2026? 8 What direction is the PC and console market heading in 2026? 2. Attention & value allocation Where do players spend time and money on PC and console? 17 3. Market concentration What happens if you are not a top-20 game? 45 4.
- PC player base is projected to exceed one billion by 2028, with a CAGR of 2.9% from 2025-2028, while console player growth moderates with a 2.2% CAGR in the same period.
- Almost two-thirds of console revenues (PlayStation and Xbox) go to the top 20 games, whereas on PC, over half of revenue comes from games ranked 21+.
- PC is the only platform effectively monetizing Free-to-Play (F2P) games, with revenue holding stable despite falling playtime in the west; on console, F2P revenue is dropping faster than engagement.
- Games ranked 21+ are capturing a growing share of playtime across platforms, with PC showing the strongest shift since 2022, indicating market disaggregation and growth from outside the top 20 titles.
- Premium game revenue is growing on PC and PlayStation, but Xbox's more modest growth cannot offset declines in F2P and Call of Duty.
+3
NewzooApr 2026
Report33 pages
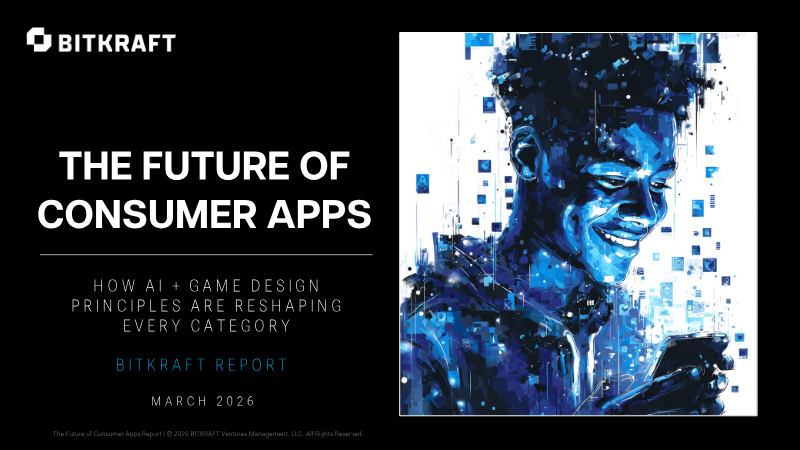
The Future of Consumer Apps: How AI and Game Design Principles Are Reshaping Every Category
The analysis establishes that consumer applications are entering a “Game‑Design 2.0” era, driven by AI‑native personalization, real‑time feedback and progression systems that elevate engagement and monetization across education, fintech, e‑commerce, health, social media and emerging verticals. 2025 data reveal that spending on non‑gaming apps has already eclipsed gaming, with AI emerging as the primary revenue catalyst and consumer demand for instant, tailored experiences rising sharply. Founders are advised to secure durable competitive advantages by harvesting proprietary data from launch, embedding culturally resonant narratives, and deploying AI to deliver seamless, game‑like value rather than merely branding an app as “AI‑powered.”
In high‑friction sectors, AI‑augmented game mechanics transform user behavior. Fintech platforms such as StockGro employ practice portfolios, leaderboards and AI‑personalized tutorials to convert financial discipline into instant gratification. E‑commerce brands like Temu and Bins use algorithmic discovery feeds, mystery boxes and streak rewards to boost retention beyond price. Health apps leverage voice‑first AI coaches with progression loops, while social networks such as TikTok demonstrate that behavioral AI coupled with variable rewards can drive record‑setting daily engagement. These examples underscore how immersive, AI‑enhanced game design unlocks higher user engagement and monetization in traditionally low‑engagement sectors.
BITKRAFT Ventures positions itself as a top‑decile investor in consumer apps, employing equity, crypto and non‑dilutive user acquisition financing to accelerate growth. The firm projects that by 2025 non‑gaming mobile apps will surpass gaming revenue, reaching $150 B by 2030, and that AI‑driven gamification will create rapid, defensible moats. By 2035, BITKRAFT forecasts that at least five consumer non‑gaming companies could exceed $10 B in valuation, highlighting the strategic importance of AI and game design for future digital experiences.
- Non-gaming mobile app revenue is projected to reach $150 billion by 2030, with spending in this sector already surpassing traditional gaming apps as of 2025.
- AI-driven gamification is the primary catalyst for revenue and engagement, with BITKRAFT forecasting at least five non-gaming consumer companies will exceed $10 billion valuations by 2035.
- High-friction sectors are successfully using game mechanics to drive retention; for example, fintech platforms like StockGro use leaderboards and AI-personalized tutorials to convert financial discipline into instant gratification.
- E-commerce brands such as Temu and Bins are leveraging algorithmic discovery feeds, mystery boxes, and streak rewards to boost user retention beyond simple price competition.
- Behavioral AI combined with variable rewards, as demonstrated by TikTok, is the current industry standard for driving record-setting daily engagement across social platforms.
+2
BITKRAFT VenturesMar 2026
Report19 pages
Ubisoft First-Half 2025-26 Earnings Figures
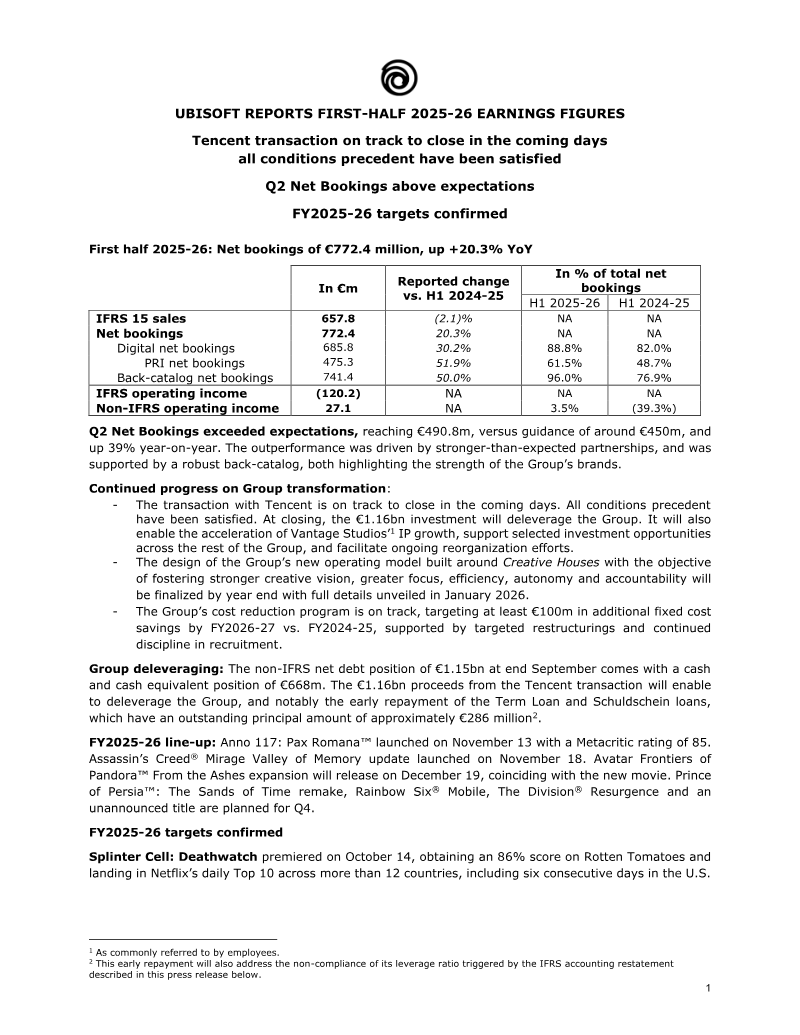
UBISOFT REPORTS FIRST-HALF 2025-26 EARNINGS FIGURES Tencent transaction on track to close in the coming days all conditions precedent have been satisfied Q2 Net Bookings above expectations First half 2025-26: Net bookings of €772.4 million, up +20.3% YoY Reported change In % of total net In €m vs.
- Ubisoft's H1 2025-26 net bookings reached €772.4 million, a 20.3% year-over-year increase, with Q2 net bookings exceeding expectations at €490.8 million (versus guidance of €450 million) due to strong partnerships and back-catalog performance.
- The transaction with Tencent, involving a €1.16 billion investment, is on track to close soon, with all conditions precedent satisfied, which will deleverage Ubisoft by enabling early repayment of approximately €286 million in loans.
- Ubisoft confirmed its FY2025-26 targets, expecting stable net bookings year-on-year, approximately break-even non-IFRS operating income, and negative free cash flow, but anticipates returning to positive non-IFRS operating income and free cash flow in FY27.
- Digital net bookings grew by 30.2% year-over-year to €685.8 million, representing 88.8% of total net bookings, while back-catalog net bookings increased by 50.0% to €741.4 million.
- Ubisoft's headcount decreased by approximately 1,500 employees over the past 12 months to 17,097, with a targeted Voluntary Leave Program and restructuring introduced at Nordic studios in October.
+2
Ubisoft
Report9 pages
Ubisoft Reports Third-Quarter 2025-26 Sales
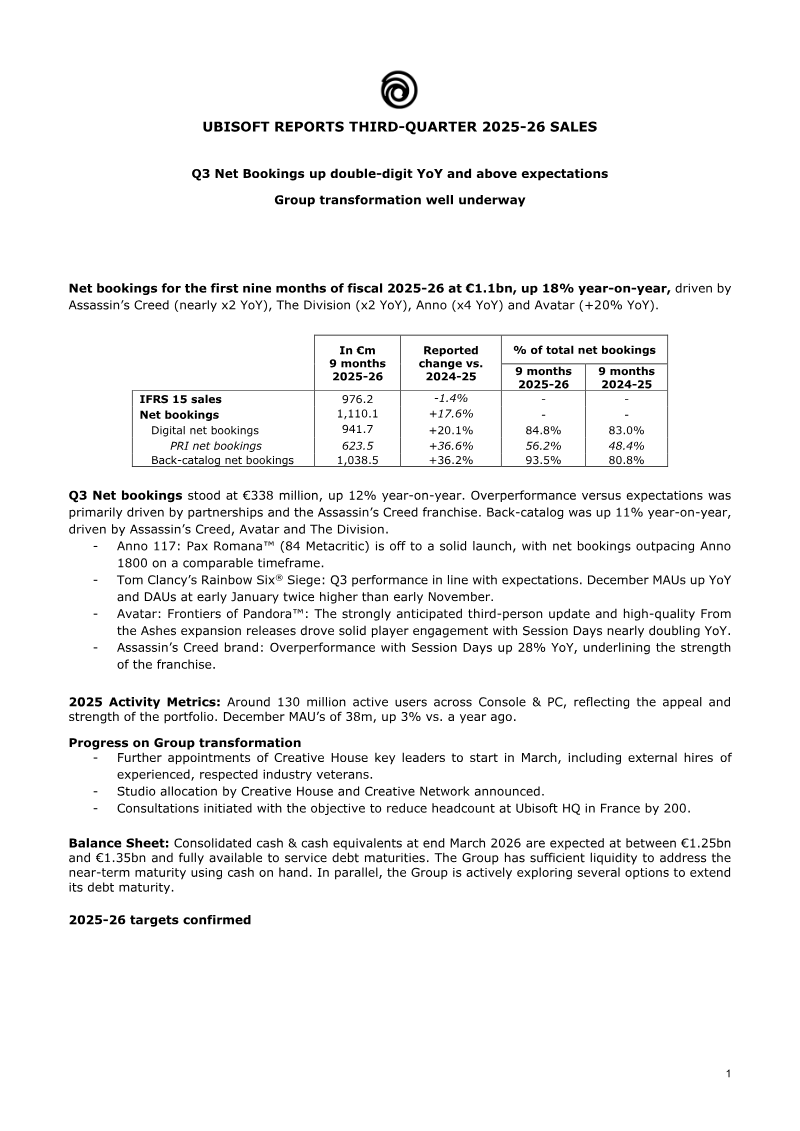
Ubisoft announced that net bookings for the first nine months of fiscal 2025‑26 reached €1.11 billion, an 18 % year‑on‑year increase driven by strong performance from Assassin’s Creed, The Division, Anno 117: Pax Romana and Avatar. Digital net bookings rose 20 % to €941.7 million, while back‑catalog sales grew 36 % to €1.04 billion, reflecting sustained demand for legacy titles and new releases such as Assassin’s Creed Shadows on Switch 2 and the Avatar: Frontiers of Pandora expansion. The third‑quarter figure of €338 million exceeded guidance by 12 %, with partnerships and franchise sales contributing most to the lift. Player activity metrics remained robust, with 130 million unique active users in 2025 and December MAUs at 38 million, up 3 % YoY.
The Group’s transformation continues, with the new Creative House operating model taking shape through studio reallocation and senior leadership appointments. Headcount reductions of 200 positions at Ubisoft HQ France are underway to streamline operations. Financially, consolidated cash stands between €1.25 billion and €1.35 billion, sufficient to cover near‑term debt maturities while the Group explores extensions of its debt profile.
Outlook for 2025‑26 confirms net bookings near €1.5 billion, non‑IFRS EBIT around –€1 billion, and free cash flow between –€400 million and –€500 million. Q4 launches include Rainbow Six Mobile, scheduled for February 23, and The Division Resurgence, with additional content planned across the franchise portfolio. Geographic revenue shares show Europe at 40 %, Northern America 46 %, and the rest of the world 14 %. Platform distribution remains dominated by consoles (55 %) and PCs (28 %), with mobile contributing 7 %.
- Ubisoft reported nine-month net bookings of €1.11 billion, an 18% year-on-year increase, with third-quarter results of €338 million exceeding guidance by 12%.
- Back-catalog sales grew 36% to €1.04 billion, driven by sustained demand for legacy titles and new releases like the Avatar: Frontiers of Pandora expansion and Assassin’s Creed Shadows.
- The company maintains a consolidated cash position between €1.25 billion and €1.35 billion while undergoing a restructuring that includes 200 headcount reductions at its French headquarters.
- Full-year 2025-26 outlook projects net bookings near €1.5 billion, with non-IFRS EBIT expected at –€1 billion and free cash flow between –€400 million and –€500 million.
- Player engagement remains strong with 130 million unique active users in 2025 and December monthly active users (MAUs) reaching 38 million, a 3% year-on-year increase.
+1
Ubisoft
Report2 pages
Announcement of Consolidated Results for Fiscal Year Ended March 31, 2025, a Comparison with Prior Year Results, Extraordinary Loss, and Non-operating Expense
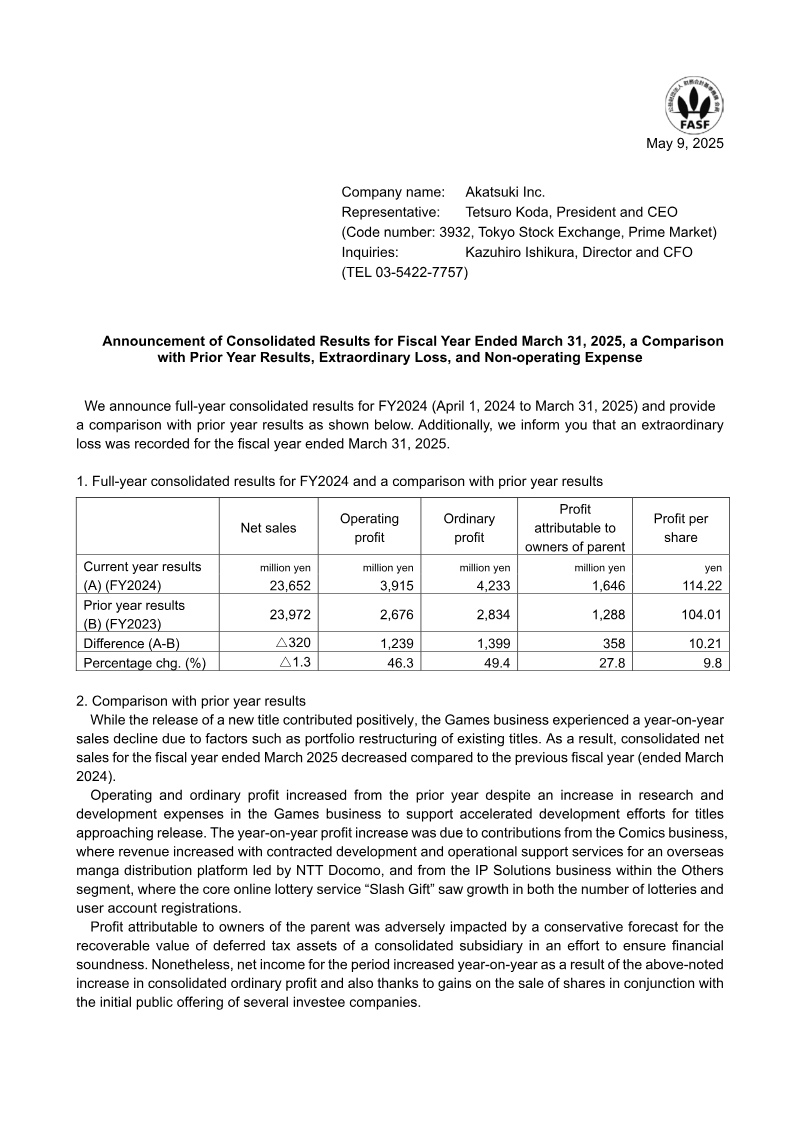
Akatsuki Inc. reported consolidated financial results for the fiscal year ending March 31, 2025 (April 1 2024–March 31 2025). Net sales fell by 1.3 % to ¥23,652 million from ¥23,972 million in FY2023, reflecting a decline in the Games segment despite a new title launch. Operating ordinary profit rose by ¥1,239 million (46.3 %) to ¥3,915 million, driven largely by gains in the Comics and IP Solutions businesses; the former benefited from contracted services for an overseas manga platform, while the latter saw growth in its online lottery service “Slash Gift.” Ordinary profit attributable to parent shareholders increased by ¥1,399 million (49.4 %) to ¥4,233 million, and net income attributable to owners of the parent grew by ¥358 million (27.8 %) to ¥1,646 million, aided by gains on share sales from IPOs of investee companies. A conservative write‑down of deferred tax assets reduced the profit attributable to owners, yet overall net income still improved.
An extraordinary loss of ¥593 million was recorded on the valuation of investment securities held by the group, reflecting a conservative assessment of recoverable value amid market uncertainty. On a non‑consolidated basis, the company recorded a ¥5,776 million provision for doubtful accounts and a ¥2,454 million loss on valuation of shares in affiliated companies; these items are largely confined to consolidated subsidiaries and have a minor impact on the consolidated results. The report covers Japan‑based operations for FY2025, with data derived from internal financial statements and market assessments.
- Akatsuki Inc. reported a 49.4% increase in ordinary profit to ¥4,233 million for the fiscal year ending March 31, 2025, despite a 1.3% decline in net sales to ¥23,652 million.
- Operating ordinary profit grew by 46.3% to ¥3,915 million, driven by strong performance in the Comics segment and the 'Slash Gift' online lottery service within the IP Solutions business.
- Net income attributable to owners of the parent rose 27.8% to ¥1,646 million, bolstered by gains from share sales related to the IPOs of investee companies.
- The Games segment experienced a decline in revenue during FY2025, failing to offset the overall sales decrease despite the launch of a new title.
- The company recorded an extraordinary loss of ¥593 million due to a conservative valuation of investment securities held by the group.
+1
Akatsuki
Report3 pages
Consolidated Results Supplementary Information: Fiscal Year Ended March 2025
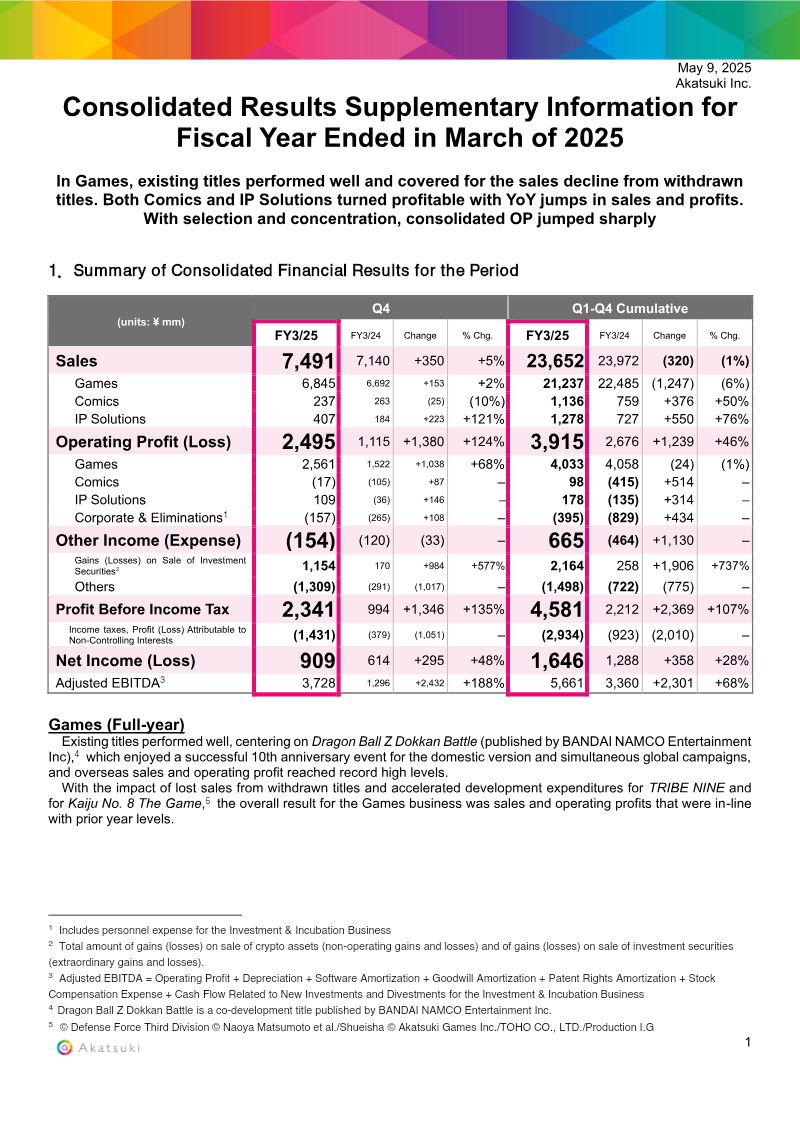
Akatsuki Inc. reported consolidated financial results for fiscal year ended March 2025, showing a modest 5 % increase in sales to ¥23.652 billion compared with the prior year, driven primarily by strong performance of existing games such as Dragon Ball Z Dokkan Battle. Games sales rose 2 % to ¥21.237 billion, while comics and IP Solutions segments returned to profitability with 10 % and 121 % year‑over‑year sales gains, respectively. Operating profit surged 124 % to ¥3.915 billion, largely due to a sharp rise in operating profit from games (68 % increase) and significant gains on the sale of investment securities, which contributed ¥1.154 billion to profit before tax.
Net income increased 48 % to ¥1.646 billion, supported by a 28 % rise in adjusted EBITDA (¥5.661 billion). The company’s balance sheet remained solid, with total assets of ¥54.632 billion and net assets of ¥41.455 billion, while total liabilities decreased to ¥13.177 billion. Cash balances were maintained at ¥33.300 billion, reflecting disciplined working‑capital management.
The results cover the Japanese market and global operations for games, comics, and IP solutions. Methodology includes consolidated financial statements with adjustments for investment and incubation business personnel expenses, and gains on crypto asset sales are classified as non‑operating. Overall, Akatsuki’s selective focus on high‑performing titles and profitable IP solutions has driven a sharp improvement in operating profitability despite the withdrawal of some titles.
- Akatsuki Inc. reported a 124% surge in operating profit to ¥3.915 billion for the fiscal year ended March 2025, driven by a 68% increase in gaming segment profit and ¥1.154 billion in gains from the sale of investment securities.
- Total sales grew 5% year-over-year to ¥23.652 billion, supported by the continued strong performance of existing titles like Dragon Ball Z Dokkan Battle.
- Net income rose 48% to ¥1.646 billion, while adjusted EBITDA increased 28% to ¥5.661 billion.
- The comics and IP Solutions segments returned to profitability, recording year-over-year sales gains of 10% and 121%, respectively.
- The company maintained a strong financial position with ¥33.300 billion in cash and a reduction in total liabilities to ¥13.177 billion.
+1
Akatsuki
Report4 pages
Consolidated Results Supplementary Information: Q1 FYE March 2026
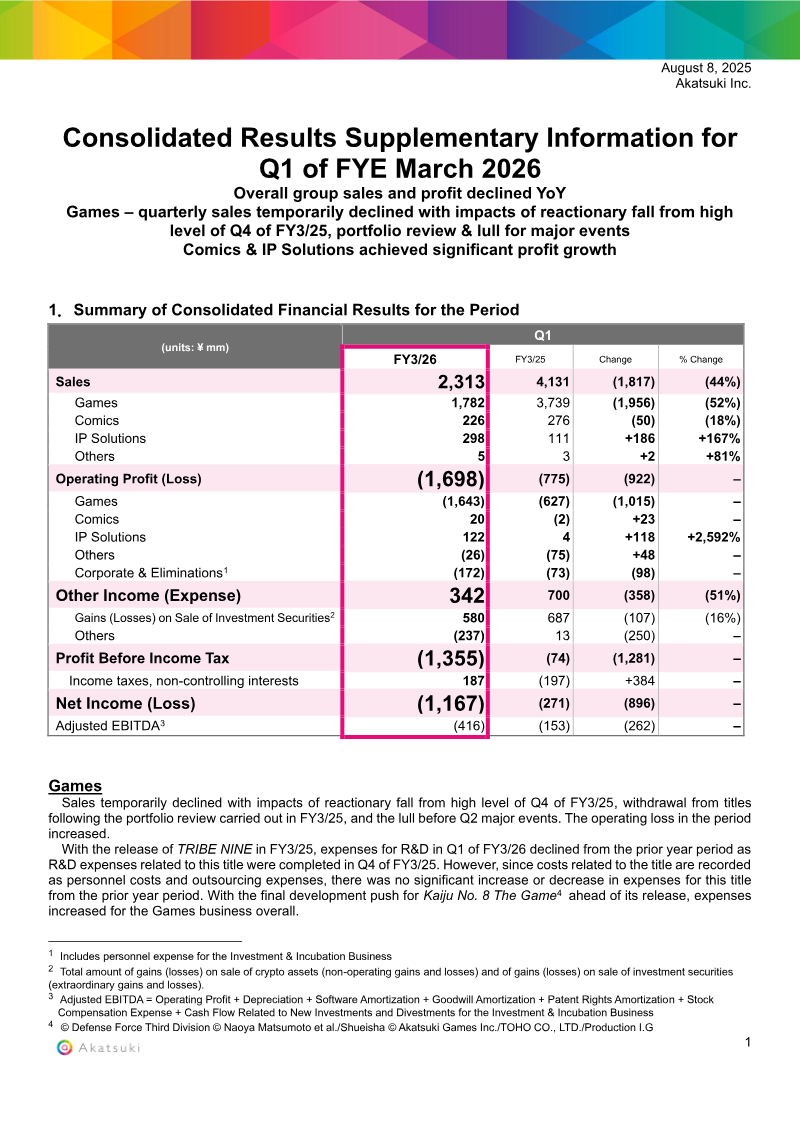
Akatsuki Inc. reported a sharp decline in consolidated sales and operating results for Q1 of the fiscal year ending March 2026, with total group sales falling 44% YoY to ¥2,313 million. The Games segment suffered the largest hit, dropping 52% to ¥1,782 million and recording an operating loss of ¥1,643 million, largely due to a post‑Q4 portfolio review withdrawal and the absence of high‑profile releases. R&D spending for the Games business fell from the previous year as development on “TRIBE NINE” concluded, but costs for the upcoming title “Kaiju No. 8 The Game” increased personnel and outsourcing expenses.
In contrast, the Comics division saw a modest 18% sales decline to ¥226 million but improved profitability, with operating profit rising from a loss of ¥2 million to ¥20 million. The division’s focus on original works and continued service provision to the overseas platform MANGA MIRAI contributed to this turnaround. The IP Solutions unit experienced explosive growth, with sales up 167% to ¥298 million and operating profit soaring 2,592% to ¥122 million, driven by the successful online lottery “Slash Gift” and the inclusion of CRAYON, Inc. in consolidation.
Other income sources shifted, with gains on investment securities decreasing by ¥107 million to ¥580 million. Net income swung from a loss of ¥271 million in FY3/25 to a larger loss of ¥1,167 million in FY3/26, reflecting the combined impact of segment downturns and higher operating losses. Adjusted EBITDA also deteriorated from ¥153 million to a loss of ¥416 million.
The financial data cover the Japanese market, covering all core segments—Games, Comics, IP Solutions, and ancillary services—from Q1 FY3/24 through Q1 FY3/26. The analysis relies on consolidated financial statements, trend tables, and explanatory notes detailing segment performance, expense composition, and investment activity.
- Akatsuki Inc. reported a 44% year-over-year decline in total consolidated sales to ¥2,313 million for Q1 FYE March 2026, resulting in a net loss of ¥1,167 million.
- The Games segment experienced a 52% sales drop to ¥1,782 million and an operating loss of ¥1,643 million, driven by a portfolio review withdrawal and a lack of major new releases.
- The IP Solutions unit achieved significant growth, with sales increasing 167% to ¥298 million and operating profit rising 2,592% to ¥122 million, bolstered by the 'Slash Gift' online lottery and the consolidation of CRAYON, Inc.
- The Comics division improved profitability, turning a ¥2 million loss into a ¥20 million operating profit despite an 18% decline in sales to ¥226 million.
- Adjusted EBITDA for the group deteriorated from a profit of ¥153 million in the previous year to a loss of ¥416 million in Q1 FY3/26.
+1
Akatsuki
Report3 pages
Consolidated Results Supplementary Information: Q2 of FYE March 2026
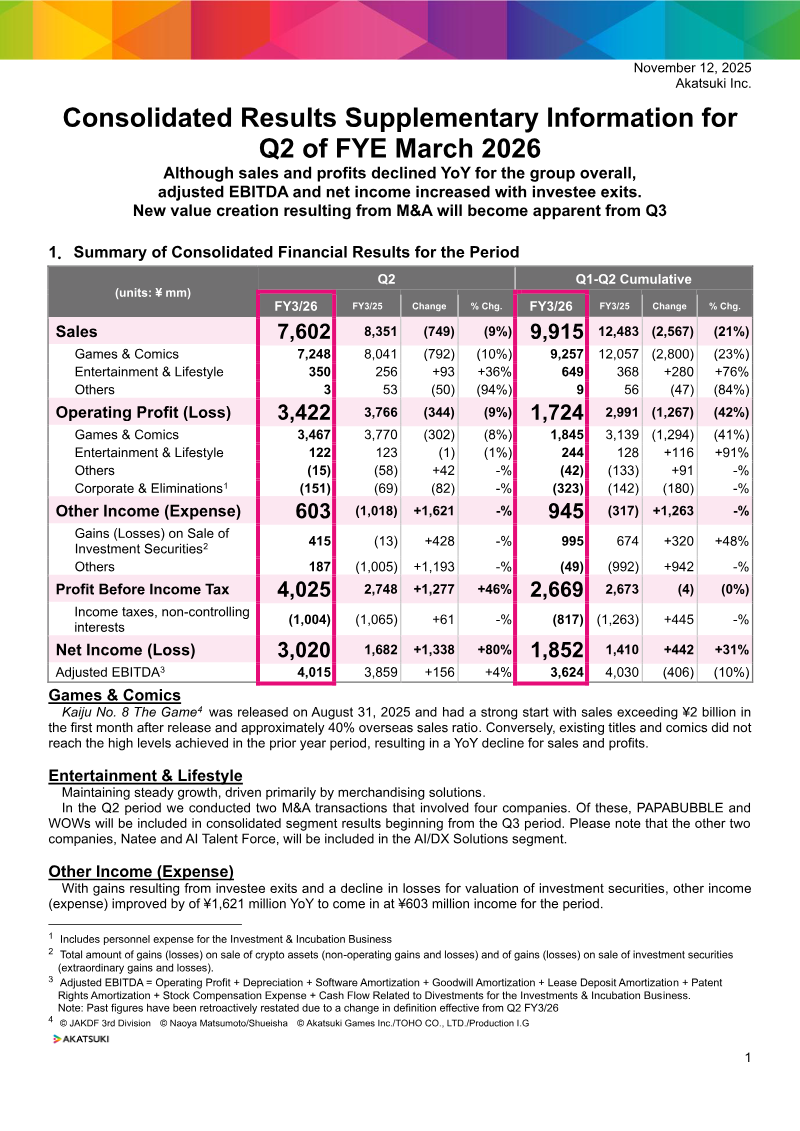
Akatsuki Inc. reported consolidated financial results for the second quarter of fiscal year ending March 2026, noting a 9 % decline in sales to ¥7,602 million and a 21 % drop in cumulative year‑to‑date sales of ¥9,915 million versus the prior year. The Games & Comics segment led the decline with a 10 % YoY fall to ¥7,248 million, while Entertainment & Lifestyle grew 36 % to ¥350 million, and the Others segment contracted sharply by 94 %. Operating profit fell 9 % to ¥3,422 million, largely due to weaker performance in the core Games & Comics unit; however, net income rose 80 % to ¥3,020 million, driven by gains from investee exits and reduced valuation losses on investment securities. Adjusted EBITDA increased modestly by 4 % to ¥4,015 million, reflecting a recovery in operating profitability after the release of new titles.
Key drivers include the launch of “Kaiju No. 8 The Game” on 31 August 2025, which generated over ¥2 billion in first‑month sales with a 40 % overseas share, partially offsetting declines from legacy titles. Two M&A transactions in Q2 added PAPABUBBLE and WOWs to the consolidated segment from Q3, while Natee and AI Talent Force will join the AI/DX Solutions segment. The company’s balance sheet shows a net asset base of ¥42,995 million and cash equivalents of ¥33,272 million, with current liabilities at ¥6,954 million.
Methodologically, the report aggregates data from all operating subsidiaries, restating prior figures to align with revised definitions effective Q2 FY3/26. The analysis covers Japan and international markets, focusing on the Games & Comics, Entertainment & Lifestyle, and AI/DX Solutions segments over a two‑quarter period.
- Akatsuki Inc. reported a 9% decline in quarterly sales to ¥7,602 million, primarily driven by a 10% YoY contraction in the core Games & Comics segment.
- Net income surged 80% to ¥3,020 million, bolstered by gains from investee exits and a reduction in valuation losses on investment securities despite lower operating profit.
- The launch of 'Kaiju No. 8 The Game' on 31 August 2025 generated over ¥2 billion in first-month sales, with 40% of revenue originating from overseas markets.
- Adjusted EBITDA increased by 4% to ¥4,015 million, signaling a recovery in operating profitability following the release of new titles.
- The company expanded its portfolio through Q2 M&A activity, acquiring PAPABUBBLE and WOWs for the Entertainment & Lifestyle segment, and Natee and AI Talent Force for the AI/DX Solutions segment.
+2
Akatsuki
Report11 pages
Consolidated Financial Statements for the Third Quarter of Fiscal Year Ending March 31, 2026
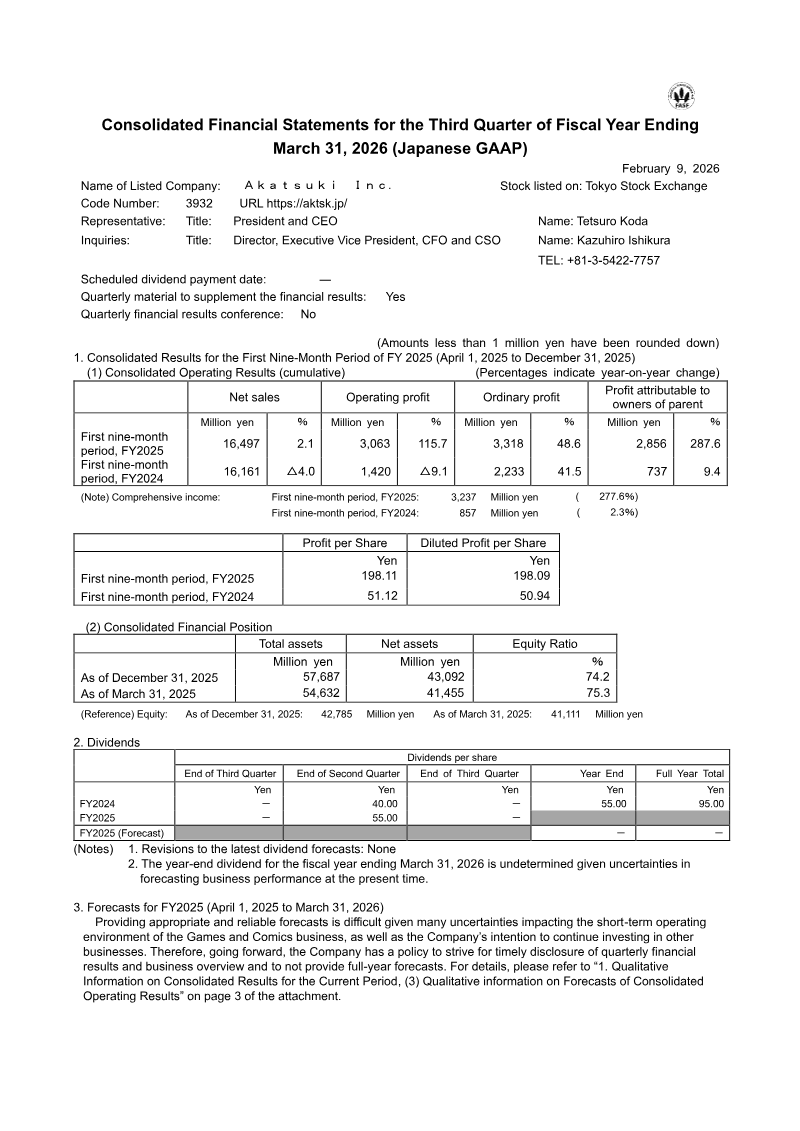
Akatsuki Inc. reports consolidated financial results for the first nine months of fiscal year 2025, ending December 31 2025. Net sales rose modestly by 2.1 % to ¥16,497 million, while operating profit surged 115.7 % to ¥3,063 million and ordinary profit increased 48.6 % to ¥3,318 million. Net profit attributable to parent shareholders climbed 287.6 % to ¥2,856 million, yielding diluted earnings per share of ¥198.11 versus ¥51.12 in the prior year. Total assets reached ¥57,687 million, up ¥3,054 million from March 31 2025, with net assets at ¥43,092 million and an equity ratio of 74.2 %. The company’s liquidity remained solid, with cash and deposits at ¥28,377 million and current liabilities down to ¥4,462 million.
Segment performance varied: the Games and Comics business posted a 5.3 % decline in sales but doubled operating profit through cost reductions; Entertainment and Lifestyle achieved a 76.1 % sales increase to ¥1,400 million but saw a modest profit decline; the newly reported AI/DX Solutions segment generated ¥600 million in sales and incurred a ¥112 million loss. The Others segment recorded a sharp 83.1 % sales drop and a ¥51 million loss.
The company added five subsidiaries to its consolidation scope, including CRAYON Inc. and PAPABUBBLE, while excluding Akatsuki Fukuoka after liquidation. No changes to accounting policies were noted. Forecasts for FY 2026 are withheld due to market uncertainties, and the company maintains a policy of not providing full‑year guidance.
- Akatsuki Inc. reported a significant surge in profitability for the first nine months of FY2025, with operating profit rising 115.7% to ¥3,063 million and net profit attributable to parent shareholders climbing 287.6% to ¥2,856 million.
- Net sales grew modestly by 2.1% to ¥16,497 million, while diluted earnings per share increased substantially to ¥198.11 compared to ¥51.12 in the prior year.
- The core Games and Comics business experienced a 5.3% decline in sales but successfully doubled its operating profit through effective cost-reduction measures.
- The Entertainment and Lifestyle segment achieved strong growth with a 76.1% sales increase to ¥1,400 million, though this was accompanied by a modest decline in profit.
- The company launched a new AI/DX Solutions segment, which generated ¥600 million in sales but incurred an operating loss of ¥112 million.
+1
Akatsuki
Report4 pages
Consolidated Results Supplementary Information: Q3 FY3/26
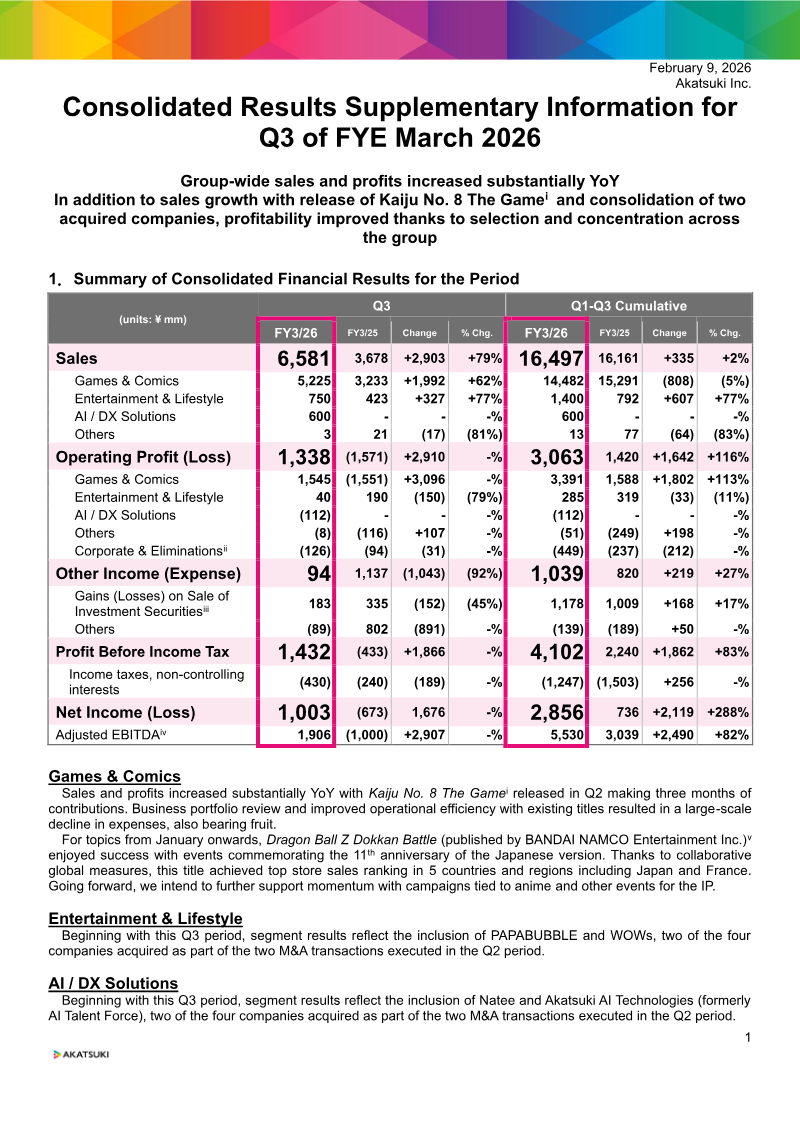
Akatsuki Inc. reported a dramatic turnaround in Q3 FY3/26, with group‑wide sales surging 79 % YoY to ¥6,581 million and operating profit turning from a loss of ¥1,571 million to a gain of ¥1,338 million. The rebound is largely attributed to the Q2 release of “Kaiju No. 8 The Game,” which contributed three months’ worth of revenue, and the consolidation of two acquired entities that broadened the Games & Comics portfolio. Within this segment, sales climbed 62 % to ¥5,225 million and operating profit rose 113 % to ¥1,545 million. The Entertainment & Lifestyle segment also grew 77 % in sales to ¥750 million, driven by the inclusion of PAPABUBBLE and WOWs following Q2 acquisitions. AI/DX Solutions, newly integrated through Natee and Akatsuki AI Technologies, generated ¥600 million in sales but recorded a loss of ¥112 million.
Net income for the quarter reached ¥1,003 million, a 288 % increase from the prior year’s loss of ¥673 million. Adjusted EBITDA expanded 82 % to ¥1,906 million, reflecting strong operating performance and effective cost management. Cash balances rose to ¥33,266 million, while total assets stood at ¥57,687 million. The company’s balance sheet remained solid with net assets of ¥43,092 million and total liabilities of ¥14,595 million.
Methodologically, figures are presented in Japanese yen (millions) and include retroactive restatements from Q2 FY3/26 due to prior period errors. The report covers the entire Japanese market and global operations, focusing on Q3 FY3/26 with cumulative data for FY3/26 versus FY3/25.
- Akatsuki Inc. achieved a significant financial turnaround in Q3 FY3/26, reporting ¥6,581 million in group-wide sales (up 79% YoY) and an operating profit of ¥1,338 million, reversing a prior-year loss of ¥1,571 million.
- The primary growth driver was the Q2 release of 'Kaiju No. 8 The Game,' which contributed three months of revenue and helped boost Games & Comics segment sales by 62% to ¥5,225 million.
- Net income reached ¥1,003 million, a 288% increase compared to the ¥673 million loss recorded in the same period last year.
- The Entertainment & Lifestyle segment grew 77% to ¥750 million in sales, bolstered by the integration of newly acquired entities PAPABUBBLE and WOWs.
- The newly integrated AI/DX Solutions segment, comprising Natee and Akatsuki AI Technologies, generated ¥600 million in sales but incurred an operating loss of ¥112 million.
+1
Akatsuki
Report8 pages
Consolidated Financial Statement: Q1 2019
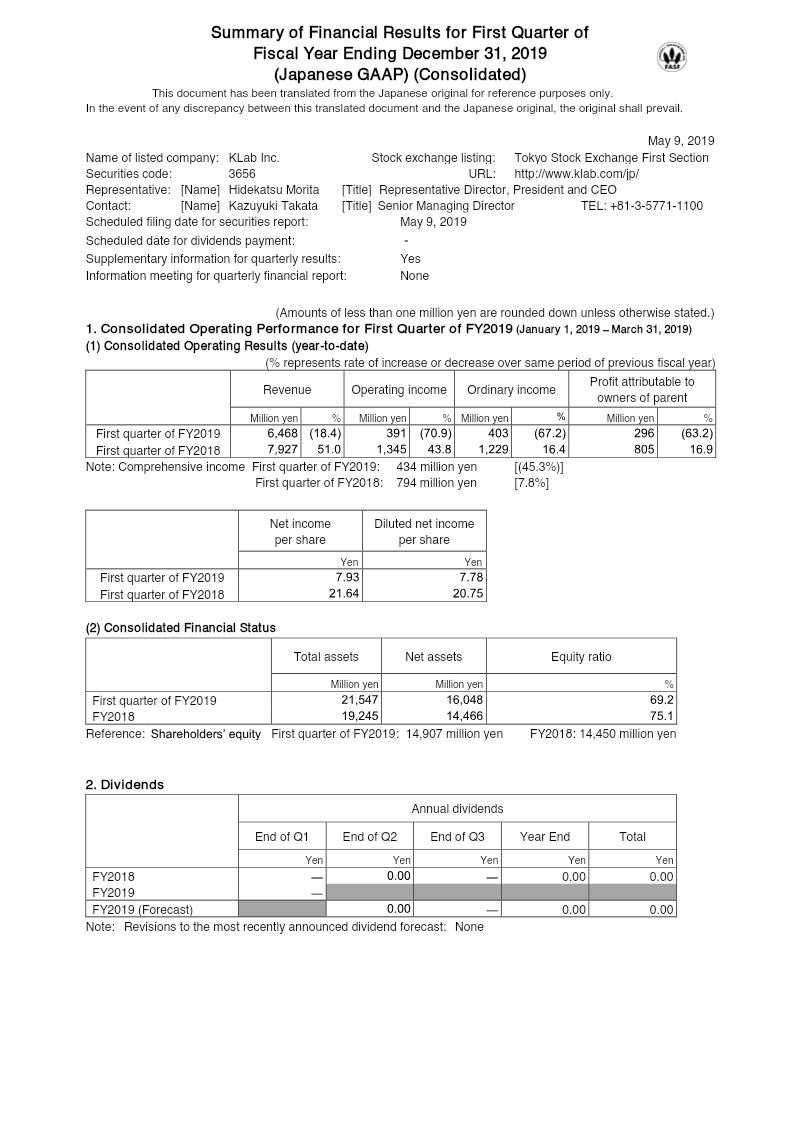
KLab Inc. reported consolidated financial results for the first quarter of fiscal year 2019 (January 1–March 31, 2019). Revenue declined 18.4 % to ¥6,468 million compared with the same period in FY2018, largely due to a drop in sales of the Love Live! School Idol Festival title. Operating income fell 70.9 % to ¥391 million, ordinary income decreased 67.2 % to ¥403 million, and profit attributable to owners of parent contracted 63.2 % to ¥296 million. Net income for the quarter was ¥303 million, a 65 % reduction from ¥805 million in FY2018. Comprehensive income also fell sharply, from ¥794 million to ¥435 million, reflecting a 45.3 % increase in other comprehensive income components.
Total assets rose to ¥21,547 million, up ¥2.3 billion from the prior year’s end, driven by increases in operating investment securities and software in progress. Net assets increased to ¥16,048 million, an addition of ¥1.58 billion, largely due to equity in a newly consolidated subsidiary. The equity ratio declined from 75.1 % to 69.2 %. Current liabilities decreased, while long‑term debt increased, contributing to the shift in leverage.
KLab forecasted FY2019 revenue between ¥32 billion and ¥40 billion, operating income between ¥1 billion and ¥4.5 billion, ordinary income in the same range, and profit attributable to owners between ¥700 million and ¥3.1 billion. The company noted that future results will depend heavily on the success of new game releases and market conditions, and it applied a range‑based presentation for forecasts. No dividends were declared for FY2019, and no significant changes in shareholders’ equity or accounting policies occurred during the quarter.
- KLab Inc. experienced a significant Q1 2019 downturn, with revenue falling 18.4% to ¥6,468 million and operating income dropping 70.9% to ¥391 million compared to the same period in 2018.
- The primary driver for the revenue decline was a decrease in sales for the 'Love Live! School Idol Festival' title.
- Profit attributable to owners of the parent contracted by 63.2% to ¥296 million, while net income fell 65% to ¥303 million.
- Total assets increased by ¥2.3 billion to ¥21,547 million, primarily due to growth in software in progress and operating investment securities.
- The company’s equity ratio declined from 75.1% to 69.2% as a result of shifting leverage, characterized by a decrease in current liabilities and an increase in long-term debt.
+1
KLab
Report8 pages
Consolidated Financial Report: Q2 2020
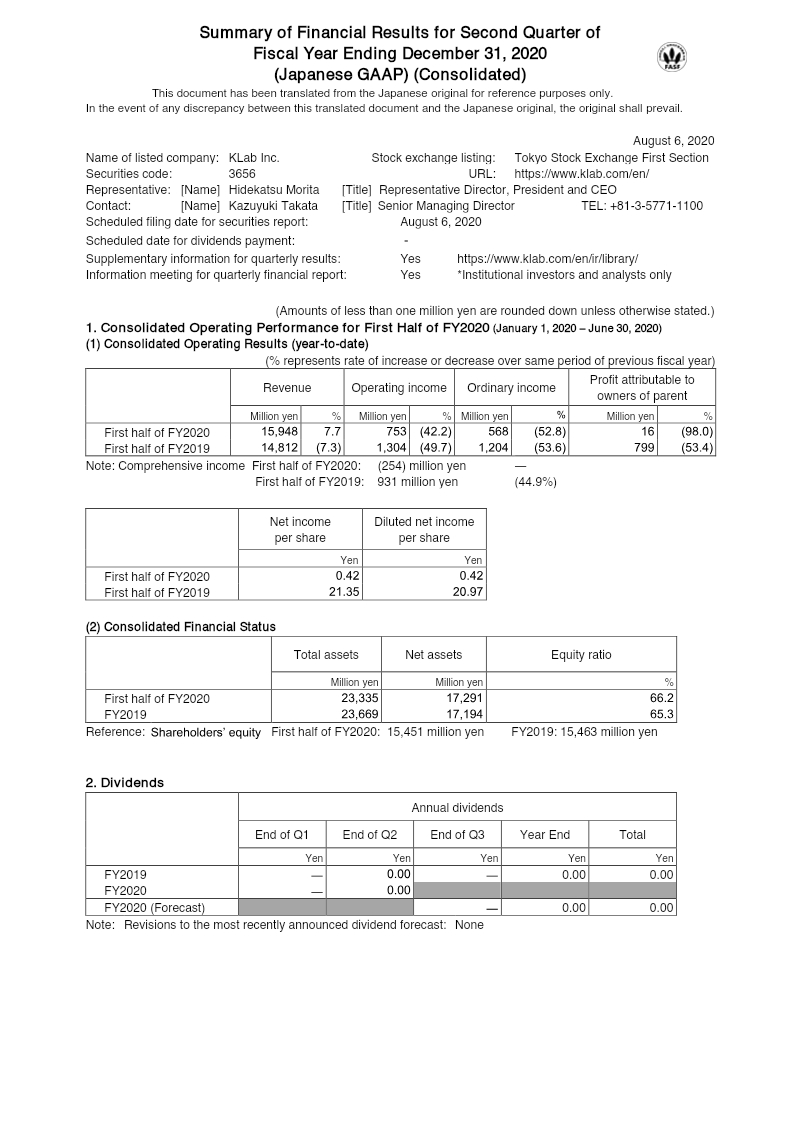
KLab Inc. reports consolidated financial results for the first half of fiscal year 2020 (January 1–June 30, 2020). Revenue rose to ¥15.95 billion from ¥14.81 billion in the same period of FY2019, a 7.7 % increase, driven by growth in the game business and other businesses such as research & consulting. Operating income fell sharply to ¥753 million from ¥1,305 million, a 42.2 % decline, largely due to higher cost of sales and lower gross profit margin. Ordinary income dropped 52.8 % to ¥568 million, and profit attributable to owners of parent fell 98 % to ¥16 million. Net income turned negative, with a loss of ¥44 million versus a profit of ¥21 million in FY2019, reflecting significant foreign exchange losses and impairment charges. Comprehensive income also turned negative at ¥254 million compared with a positive ¥932 million in FY2019, driven by valuation losses on available‑for‑sale securities and foreign currency translation adjustments.
Total assets decreased modestly to ¥23.34 billion from ¥23.67 billion, while shareholders’ equity remained stable at ¥17.29 billion, giving an equity ratio of 66.2 %. Net assets grew slightly to ¥17.29 billion, and the company maintained a strong liquidity position with cash and deposits of ¥6.38 billion. No dividends were declared for FY2019 or FY2020, and the forecasted dividend remained unchanged. The report covers Japan only, covering KLab’s core game development and ancillary businesses, with data derived from consolidated financial statements under Japanese GAAP. The methodology follows standard accounting principles without restatements or significant policy changes during the period.
- KLab Inc. reported a 98% decline in profit attributable to owners of the parent to ¥16 million for the first half of 2020, compared to the same period in 2019.
- Operating income fell 42.2% to ¥753 million, driven by an increased cost of sales and a lower gross profit margin.
- Revenue grew by 7.7% to ¥15.95 billion, supported by performance in the company's core game business and research and consulting services.
- The company recorded a net loss of ¥44 million for the first half of 2020, primarily due to significant foreign exchange losses and impairment charges.
- Comprehensive income turned negative at ¥254 million, impacted by valuation losses on available-for-sale securities and foreign currency translation adjustments.
+1
KLab
Report8 pages
Quarterly Financial Report: Q3 2020
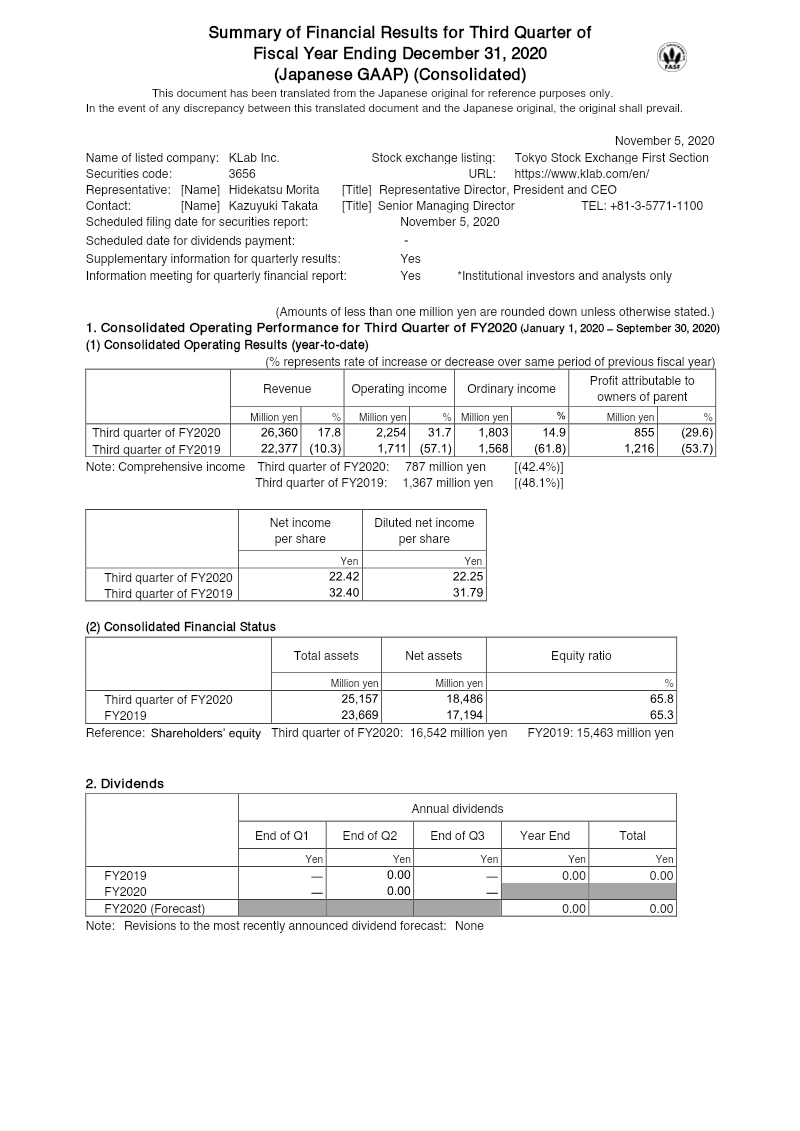
KLab Inc. reports a robust third‑quarter performance for fiscal year 2020, with revenue rising to ¥26.36 billion from ¥22.38 billion in the same period of FY2019, a 17.8 % increase driven by its game business segment. Operating income grew to ¥2.25 billion, up 31.7 % year‑over‑year, while ordinary income reached ¥1.80 billion, a 14.9 % rise. Net profit attributable to the parent fell to ¥855 million, a 29.6 % decline, largely due to higher foreign‑exchange losses and an impairment charge of ¥498.9 million on investments. Comprehensive income for the quarter was ¥787 million, down 42.4 % from ¥1.37 billion in FY2019, reflecting a reversal of the valuation gain on available‑for‑sale securities and foreign‑currency translation adjustments.
Total assets increased to ¥25.16 billion, with current assets up 13.8 % and non‑current assets slightly down due to a reduction in intangible software assets. Net assets rose to ¥18.49 billion, and the equity ratio improved to 65.8 %. Outstanding shares averaged 38.17 million, with no treasury shares held at quarter‑end.
The company maintained a dividend policy of zero for FY2020, with no forecasted dividends. No changes to accounting principles were reported, and the effective tax rate was applied consistently across periods. The report covers Japan‑based operations for FY2020 (January 1–September 30) and compares results to the same period in FY2019.
- KLab Inc. reported a 17.8% year-over-year revenue increase to ¥26.36 billion for the first nine months of FY2020, driven by strong performance in its game business segment.
- Operating income rose 31.7% to ¥2.25 billion, while ordinary income grew 14.9% to ¥1.80 billion compared to the same period in FY2019.
- Net profit attributable to the parent fell 29.6% to ¥855 million, primarily due to foreign-exchange losses and a ¥498.9 million impairment charge on investments.
- Comprehensive income declined 42.4% to ¥787 million, impacted by a reversal of valuation gains on available-for-sale securities and foreign-currency translation adjustments.
- The company’s financial position strengthened with net assets rising to ¥18.49 billion and an improved equity ratio of 65.8%.
+1
KLab
Report9 pages
Q1 2021 Financial Statement
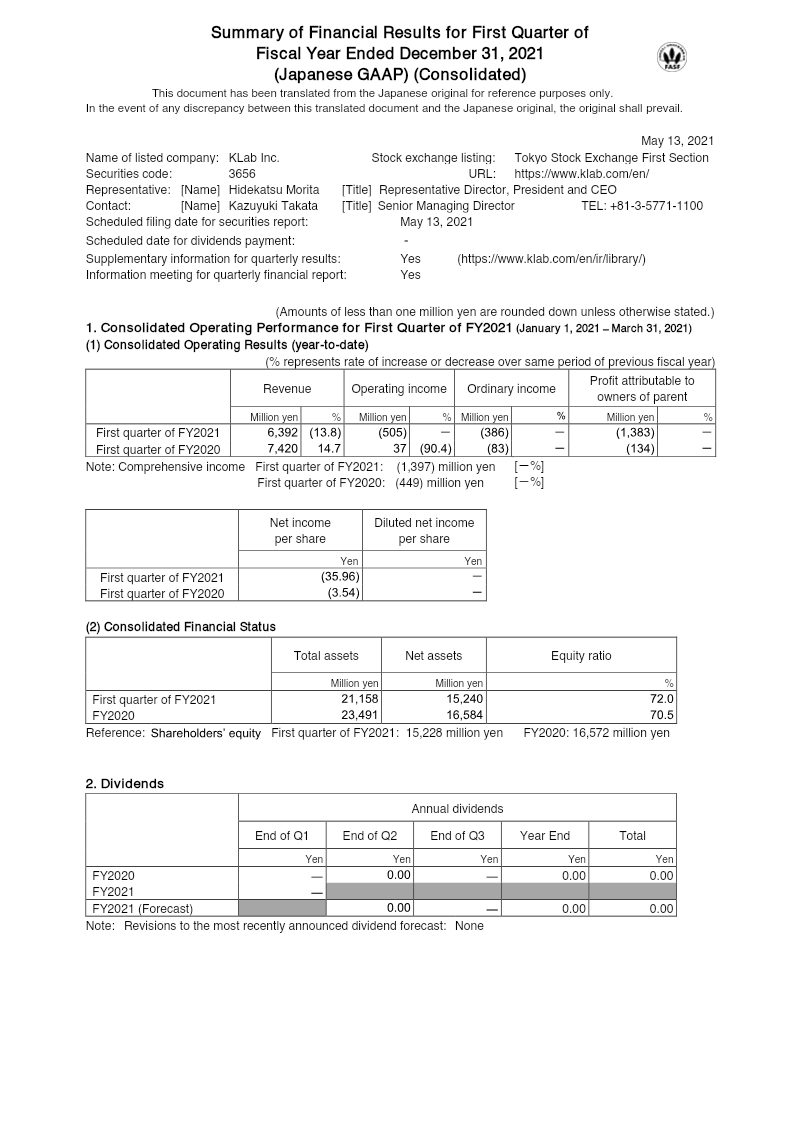
KLab Inc. reported a sharp decline in first‑quarter FY2021 operating performance compared with the same period of FY2020. Revenue fell to ¥6,392 million from ¥7,420 million, a 13.8% drop, while operating income turned negative at ¥(505) million versus a profit of ¥37 million in FY2020. Ordinary income and profit attributable to the parent also swung from a ¥(83) million loss to a ¥386 million loss, reflecting significant impairment charges of ¥1.54 billion on software assets that dominated the extraordinary loss line item. Comprehensive income deteriorated to a ¥1,397 million loss from a ¥449 million loss in FY2020, largely driven by the same impairment and foreign‑exchange losses.
Total assets decreased to ¥21.16 billion from ¥23.49 billion, with net assets falling to ¥15.24 billion and the equity ratio contracting from 70.5% to 72.0%. Cash and deposits were ¥6.38 billion, while current liabilities stood at ¥5.10 billion, leaving a modest working‑capital cushion. No dividends were declared for FY2021, and the company maintained its share‑repurchase program capped at ¥500 million.
The quarter’s financials were prepared under Japanese GAAP, with no changes to accounting principles or estimates. The company’s segment analysis shows the game business as the sole revenue generator, with a reported impairment loss of ¥1.54 billion recorded in this segment. A subsequent acquisition of GlobalGear Co., Ltd. was announced, aimed at expanding KLab’s casual‑game portfolio and global reach.
- KLab Inc. reported a 13.8% year-over-year revenue decline in Q1 2021, falling to ¥6,392 million from ¥7,420 million.
- Operating income swung to a ¥505 million loss compared to a ¥37 million profit in the same period of 2020.
- The company recorded a significant ¥1.54 billion impairment charge on software assets, which was the primary driver of a ¥386 million loss attributable to the parent company.
- Comprehensive income deteriorated significantly to a ¥1,397 million loss, exacerbated by the software impairment and foreign-exchange losses.
- Total assets decreased to ¥21.16 billion from ¥23.49 billion, though the company maintains a working-capital cushion with ¥6.38 billion in cash against ¥5.10 billion in current liabilities.
+1
KLab
Report8 pages
Financial Report: Q2 2021
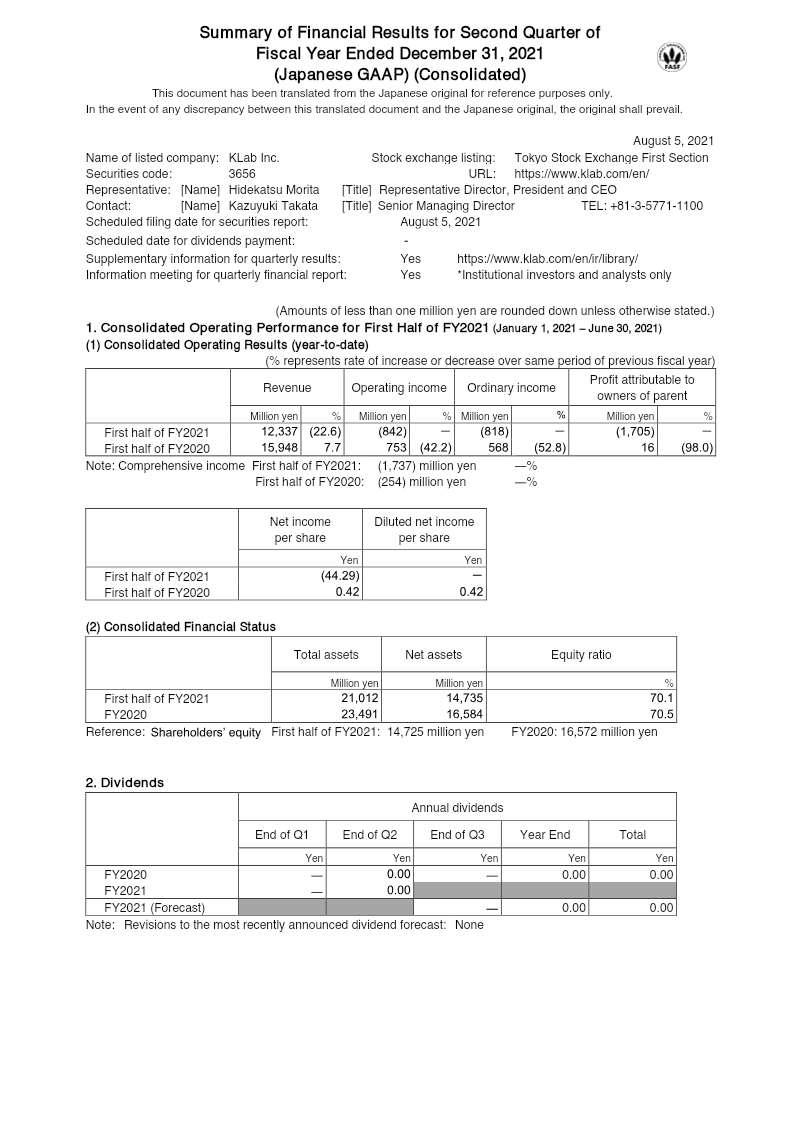
KLab Inc. reports a sharp contraction in operating performance for the first half of fiscal 2021 (January 1–June 30). Total revenue fell to ¥12.34 billion, a 22.6 % decline from the ¥15.95 billion recorded in the same period of FY2020, while operating income turned into a loss of ¥842 million versus an operating profit of ¥753 million in FY2020. Ordinary income and profit attributable to owners of the parent both swung into negative territory, with a loss of ¥818 million and ¥1.71 billion respectively, compared to profits of ¥568 million and ¥16 million in FY2020. Net income for the period was a loss of ¥44.3 million per share, contrasting with a modest profit of ¥0.42 per share in FY2020.
The comprehensive loss widened to ¥1.74 billion, driven largely by a ¥1.54 billion impairment loss on goodwill and other extraordinary losses. Asset‑side, total assets declined to ¥21.01 billion from ¥23.49 billion, while equity fell to ¥14.74 billion, maintaining an equity ratio of 70.1 %. Treasury stock increased to ¥200.985 million after a February acquisition of 286,600 shares.
Revenue concentration remained in the game business segment (≈¥12.13 billion), with a secondary “Other” segment contributing ¥209 million. The company disclosed no dividend for FY2021 and maintained a forecast of zero dividends for the year.
Methodologically, figures are presented under Japanese GAAP, with a consolidated view of all subsidiaries. No changes to accounting principles or restatements were reported for the period.
- KLab Inc. experienced a significant financial downturn in H1 2021, with total revenue falling 22.6% year-over-year to ¥12.34 billion.
- Operating performance swung from a ¥753 million profit in H1 2020 to an operating loss of ¥842 million in H1 2021.
- The company reported a net loss of ¥1.71 billion attributable to owners of the parent, resulting in a loss of ¥44.3 per share compared to a profit of ¥0.42 per share in the prior year.
- A ¥1.54 billion impairment loss on goodwill and other extraordinary losses contributed to a comprehensive loss of ¥1.74 billion for the period.
- Total assets declined to ¥21.01 billion from ¥23.49 billion, though the company maintained a solid equity ratio of 70.1%.
+1
KLab

Report50 pages
3Q FY2021 Presentation Material: Japan
3Q FY2021 Presentation Material The future information, such as earnings forecast, written in this document is based on our expectations and assumptions as of the date the forecast was made. Our actual results could differ materially from those described in this forecast because of various 1. Quarterly Results (April - June 2021) 3. Internet Advertisement Business FY2021 The growth of games and ads exceeded our expectation. The forecast is revised upward again.
- The company's Q3 FY2021 sales reached 192.2 billion yen (up 70.3% YoY) and operating profit hit 44.5 billion yen (up 5.4x YoY), leading to an upward revision of the full-year forecast.
- The game division was the primary growth driver, with sales of 92.3 billion yen (up 151.7% YoY) and operating profit of 44.2 billion yen (up 483.5% YoY), largely attributed to the success of "Uma Musume Pretty Derby."
- The advertising division also performed strongly, achieving sales of 81.8 billion yen (up 27.3% YoY) and operating profit of 5.2 billion yen (up 9.7% YoY) by maximizing advertising effectiveness.
- ABEMA and related businesses saw sales increase by 48.7% YoY to 19.9 billion yen, though they recorded an operating loss of 3.8 billion yen.
- The company maintains a strong financial position, with current assets at 272.8 billion yen (up 50.6% YoY) and cash deposits at 146.6 billion yen (up 62.1% YoY) as of June 2021.
+2
CyberAgent