Skip to main content
Game Industry
Library
Library
Search
Ask AI
News
Connect your AI
Browse
The Catch Up
Topics
Collections
Writers
Help
Subscribe
Game Industry
Library
Library
Search
Ask AI
Saved
Library
110 reports matching your filters
All Types
Reports
Articles
Presentations
Whitepapers
Financial
Legal
Other
Search
Advertising
Global
Marketing
Mobile
Market Analysis
User Acquisition
Creative Ads
Monetization
AI
In-Game Advertising
Japan
PC
Game Publishing
Investment
Streaming
USA
Market Forecast
Casual
Clear
Filters
1
Advertising
Recently added
Newest first
Oldest first
Title A–Z
Title Z–A
Whitepaper
191 pages
Global White Paper on Mobile Advertising & Marketing Game H1 2022
The mobile advertising ecosystem contracted in H1 2022, with the total number of advertisers falling 5.79% to approximately 83,400 and creative volume dropping 27% to 40 million assets.
Mobile-game advertising costs remain high in key markets, with the U.S. and Japan recording average CPMs of $27.54 and $25.93, while iOS campaigns command a 15% price premium over Android.
While playable ads offer the lowest cost-per-install (CPI), banner formats currently generate the strongest return on ad spend (ROAS).
Marketing
Advertising
In-Game Advertising
+2
SocialPeta
Jan 2022
Report
31 pages
2022 App Marketer Survey
Privacy regulations are the primary industry obstacle, with 64% of marketers reporting negative impacts from Apple’s App Tracking Transparency (ATT) rollout.
Data loss resulting from privacy changes has left 73% of marketers feeling uninformed, while 72% report increased costs for user acquisition.
Despite a mixed industry outlook, 59% of marketers have increased their 2022 performance targets, though 48% are currently struggling to meet these goals.
Market Analysis
User Acquisition
Marketing
+3
Liftoff
Jan 2022
Report
1 pages
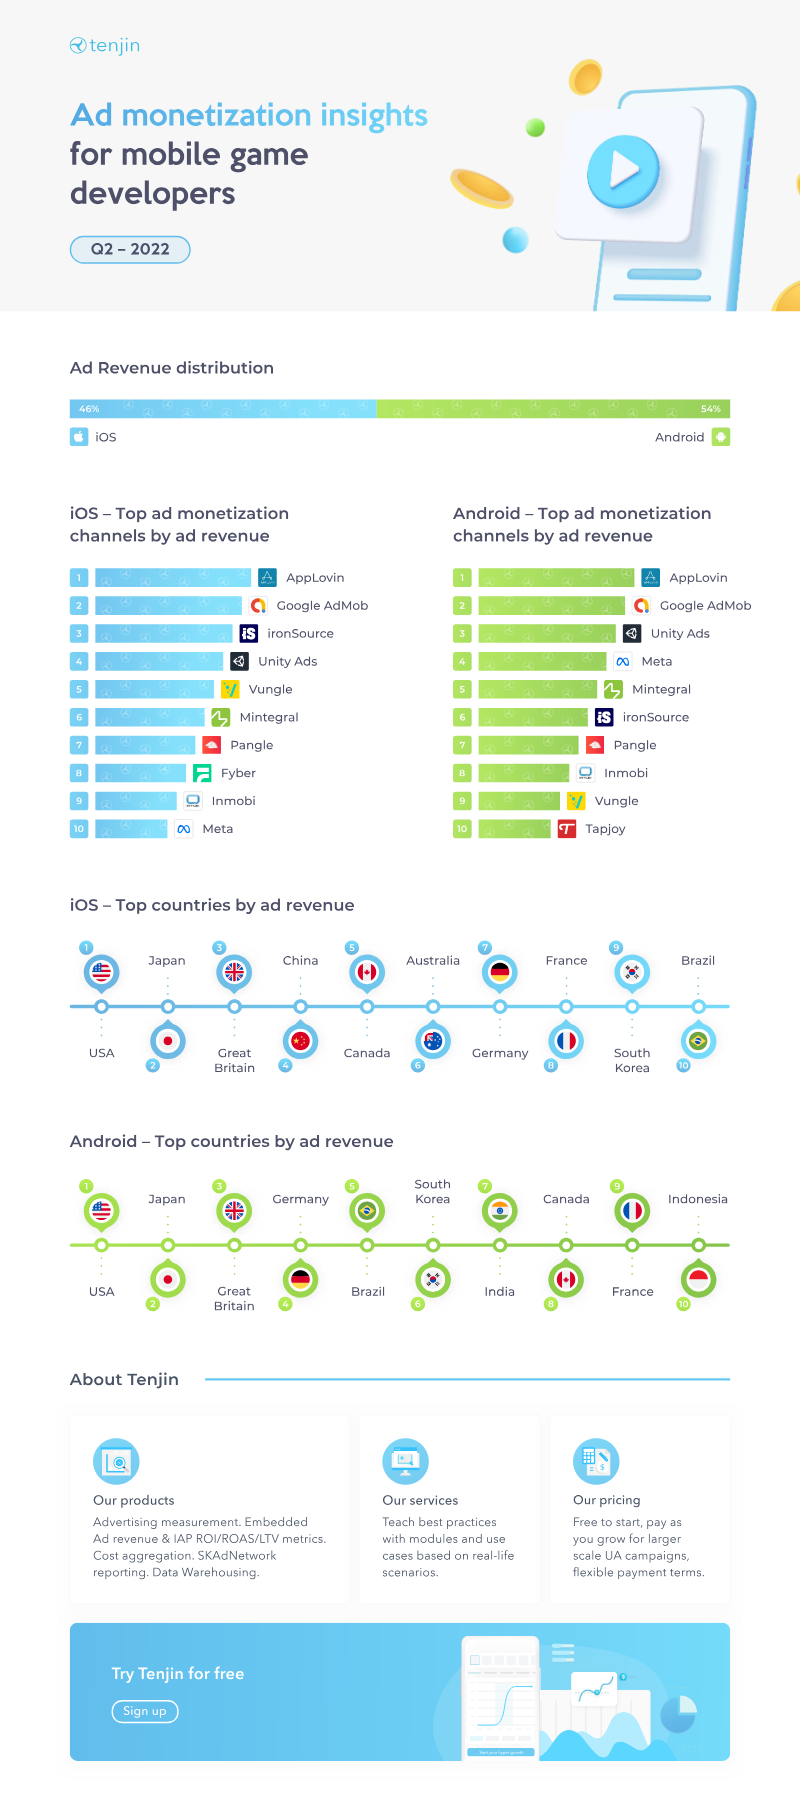
Ad Monetization Insights for Mobile Game Developers 2022
Advertising accounts for 54% of total revenue across the mobile game markets surveyed in 2022.
Effective monetization requires integrating ad revenue, in-app purchase data, and cost metrics to accurately calculate ROI, ROAS, and LTV.
Key regional markets for mobile game monetization include Germany, Japan, South Korea, Canada, and Indonesia.
Monetization
Advertising
Global
+1
Tenjin
Jan 2022
Report
15 pages
Ad Intelligence: An Overview 2022
The mobile advertising market has doubled since 2019, with over 120,000 active advertisers identified across 35 countries in 2022.
Android dominates the advertising landscape, accounting for 71% of advertisers and over 80% of the 14.6 million creatives tracked.
Gaming remains the primary advertising sector, capturing 69.02% of traffic on the App Store and 55.58% on Google Play, with Casual and Puzzle genres leading their respective platforms.
Advertising
Market Analysis
Global
+1
Apptica
Jan 2022
Report
31 pages
App Marketer Survey
Apple’s App Tracking Transparency (ATT) framework has negatively impacted 64% of user acquisition campaigns, leading to increased costs for 72% of marketers and complicating decision-making for 73%.
Nearly 60% of marketing professionals report facing more aggressive KPIs than in previous years, yet approximately half are currently struggling to meet these targets.
To combat data scarcity, 52% of marketers plan to increase their 2023 advertising budgets while diversifying into influencer marketing and organic social media.
Market Analysis
Marketing
Advertising
+1
Liftoff
Jan 2022
Report
230 pages
Türkiye Game Market 2022 Report
The Turkish gaming market generated $625 million in 2022, reflecting a structural pivot from hyper-casual volume toward sustainable, high-quality PC, console, and hybrid-casual intellectual property.
Investment activity reached a record $424 million across 23 deals, establishing Istanbul as a premier global hub for gaming capital.
While the number of new gaming startups fell by 48% year-over-year, the remaining 6,000 publishers are increasingly prioritizing long-term viability through AI integration and professionalized operations.
Market Analysis
Marketing
Advertising
+2
Riot Games
Jan 2022
Report
30 pages
Mobile Ad Creative Index: 2022
Playable ads in the gaming sector achieve the lowest cost-per-install (CPI) at $1.98, while banner ads generate the highest 30-day return on ad spend (ROAS) at nearly 22%.
iOS advertising costs are frequently double those of Android, making Android the more cost-effective platform for mobile user acquisition.
There is a significant disconnect between player psychology and creative execution, with only 4% of casual game video ads and less than 1% of midcore ads successfully targeting specific player motivations.
Advertising
In-Game Advertising
User Acquisition
+2
Liftoff
Jan 2022
Whitepaper
191 pages
2022 Global White Paper on Mobile Advertising & Marketing Game
The global mobile advertising market saw a 27% decline in creative volume during the first half of 2022, accompanied by rising costs that pushed the average CPM to $19.31.
Video content now dominates the advertising landscape, accounting for over 86% of all creatives as developers shift toward high-quality, drama-based storytelling to lower entry barriers.
While the total number of advertisers decreased, emerging markets in the Middle East, South America, and Southeast Asia showed robust growth, contrasting with the high-cost user acquisition environments of the United States and South Korea.
Advertising
Marketing
Market Analysis
+2
SocialPeta
Jan 2022
Report
42 pages
The State of Mobile Game and App Markets: H1 2022
Marketers reduced mobile game creative volume by nearly 30% year-over-year in H1 2022, shifting focus from raw install volume to performance metrics like Cost Per Purchase and In-App Purchase Return on Ad Spend.
Advertising costs rose significantly, with CPMs increasing 18% for mobile games and 64% for non-gaming applications.
Advertisers are increasingly prioritizing the Android ecosystem, which now accounts for approximately 70% of all mobile game creatives.
Market Analysis
Mobile
Marketing
+3
AdQuantum
Jan 2022
Report
40 pages
2022 The Israeli Mobile Game Market Report
The Israeli mobile gaming industry has grown by 760% since 2016, reaching $9 billion in annual revenue across a ecosystem of 200 companies and 14,000 employees.
Android now accounts for 70% of all mobile game advertising, a shift driven by Apple’s IDFA privacy changes.
Despite a 4.2% increase in the number of active advertisers, total ad creative volume declined by 17.8% in 2022, with the sharpest contraction occurring in the RPG segment.
Market Analysis
Mobile
Marketing
+2
SocialPeta
Jan 2022
Report
42 pages
For the Game
The global gaming industry is projected to reach 3.5 billion players and $225 billion in revenue by 2025.
Gamers are high-value 'super-consumers' who engage with television and internet platforms for nearly 60 hours per week.
Over one-third of the global player base uses gaming primarily as a social platform, necessitating a shift toward community-focused engagement strategies.
Market Analysis
Player Demographics
Marketing
+2
dentsu
Jan 2022
Whitepaper
106 pages
2022 Global White Paper on Mobile Advertising & Marketing
The mobile gaming market is shifting toward quality over volume, evidenced by a 2% decline in total advertisers and a 27.83% reduction in ad creatives during the first half of 2022.
RPG and strategy titles remain the primary revenue drivers, commanding the highest advertising costs with average CPMs reaching $21.58.
Video is the dominant advertising format, accounting for over 86% of all ad creatives as marketers prioritize dramatic storytelling and influencer-led content.
Market Analysis
Mobile
Marketing
+3
SocialPeta
Jan 2022
Report
17 pages
The Hyper-Casual Benchmark Report: Q3 2022
Retention is the primary differentiator for success, with top-tier hyper-casual games significantly outperforming the median cohort as acquisition costs rise.
Median cost-per-install (CPI) reached record highs in Q4 2022, hitting $0.20 on Android and $0.42 on iOS.
iOS consistently outperforms Android in retention, with top-tier titles achieving 45% Day 1 retention on iOS compared to 38% on Android.
Market Analysis
Monetization
User Acquisition
+5
Tenjin
Jan 2022
Report
106 pages
Global White Paper on Mobile Advertising & Marketing Game
Mobile game advertising volume contracted by nearly 30% in 2022 to 15.8 million creatives, driven by a shift toward quality-focused marketing and the impact of Apple’s IDFA changes.
Video ads dominate the market, accounting for over 86% of all creatives, while casual and puzzle titles have displaced RPGs as the primary drivers of advertising spend.
Cost-per-mille (CPM) is highest for strategy games at $21.58, and iOS advertising remains 15% more expensive than Android equivalents.
Marketing
Advertising
Global
+2
Tencent
Jan 2022
Presentation
55 pages
FY2021 Presentation Material
CyberAgent achieved record-breaking FY2021 performance with 666.4 billion yen in consolidated sales and a 104.3 billion yen operating profit, representing a more than threefold increase.
The Game business was the primary profit driver, recording 68.6% year-over-year growth fueled by the commercial success of Uma Musume Pretty Derby.
WINTICKET captured 25% of the Keirin online betting market and tripled its transaction volume, significantly contributing to reduced operating losses in the Media segment.
Market Forecast
Monetization
Advertising
+1
CyberAgent
Oct 2021
Presentation
50 pages
3Q FY2021 Presentation Material: April to June 2021
CyberAgent’s consolidated sales grew 70.3% year-over-year to 192.2 billion yen in 3Q FY2021, with operating profit increasing more than fivefold to 44.5 billion yen.
The 'Uma Musume Pretty Derby' game drove a 151.7% increase in gaming segment sales and a 480% surge in operating profit, reaching nine million downloads within five months of launch.
Driven by the success of 'Uma Musume', CyberAgent revised its full-year forecasts upward to 650 billion yen in sales and 100 billion yen in operating profit.
Market Analysis
Advertising
Game Publishing
+1
CyberAgent
Jul 2021
Presentation
52 pages
2Q FY2021 Presentation Material: January to March 2021
CyberAgent’s consolidated sales grew 26.6% year-over-year to 163.4 billion yen in 2Q FY2021, with operating profit doubling to 25.8 billion yen.
The Game business reached record quarterly sales of 63.9 billion yen, driven primarily by the launch of 'Uma Musume Pretty Derby,' which surpassed five million downloads in 45 days.
Due to strong gaming performance, CyberAgent raised its full-year sales forecast to 600 billion yen and nearly doubled its projected operating profit range.
Market Analysis
Advertising
Japan
CyberAgent
Apr 2021
Presentation
44 pages
1Q FY2021 Presentation Material: October to December 2020
CyberAgent achieved record-high consolidated sales of 131 billion yen in 1Q FY2021, a 13.3% year-over-year increase driven by strong performance in the Media and Advertising segments.
The Media segment grew revenue by 67% to 20.4 billion yen, bolstered by ABEMA’s premium subscriber base exceeding 921,000 users and an elevenfold increase in WINTICKET transaction volume.
The Game business experienced a 15% revenue decline to 29.9 billion yen and a 77.8% drop in operating profit, attributed to seasonal factors and increased marketing spend.
Advertising
Marketing
Market Analysis
+1
CyberAgent
Jan 2021
Report
8 pages
Post-IDFA Mobile Game Advertising Costs: Casual vs Core
Core games experienced a 78% surge in iOS CPI following the iOS 14.6 release, driven by intensified competition for a shrinking pool of high-value, trackable users.
Casual games saw a 38% decline in iOS CPI post-iOS 14.6, while Android CPI for the same segment rose by 16%.
Android CPI for core games increased by 36% during the same period, reflecting broader market volatility across platforms.
Advertising
User Acquisition
Market Analysis
+2
Moloco
Jan 2021
Report
30 pages
The State of Mobile Game Advertising: An Analysis of U.S. Mobile Game Advertising Trends in 2021
Mobile game advertising in the U.S. remained resilient through H1 2021, showing no immediate negative impact from the deprecation of IDFA.
Playable ads have become a dominant creative format, accounting for over 40 percent of the gaming share of voice on AppLovin.
Specialized ad networks like AppLovin, Chartboost, and Vungle maintain a gaming-focused inventory exceeding 90 percent share of voice, while platforms like Facebook, TikTok, and YouTube provide broader audience reach.
Marketing
Advertising
Mobile
+1
Sensor Tower
Jan 2021
Previous
1
2
3
4
5
6
Next