FinancialTakamatsu Construction Group Co.
Summary of Consolidated Financial Results: Second Quarter of Fiscal Year Ending March 31, 2019
1 Nov 201810 pages~14 min full read
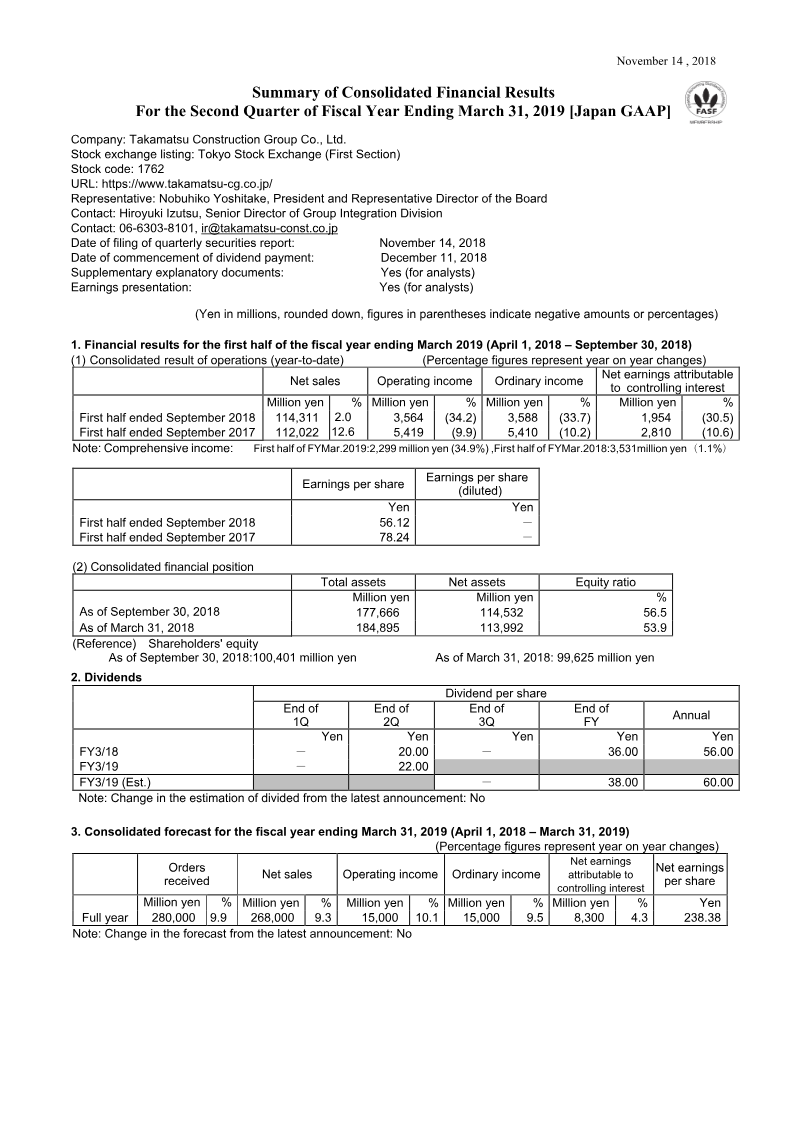
Takamatsu Construction Group reported net sales of 114,311 million yen for the first half of fiscal year 2019, a 2.0% increase representing seven consecutive years of first-half growth.
See it on page 1Operating income fell 34.2% to 3,564 million yen and net earnings dropped 30.5% to 1,954 million yen, driven by a decline in high-margin projects and rising administrative expenses from hiring and subsidiary integration.
See it on page 4The real estate segment was a primary growth driver, achieving a 79.8% increase in sales and a 141.6% surge in operating profit.
See it on page 4Architecture segment orders rose 31.1%, though segment-wide net sales and operating profit declined during the period.
See it on page 4Civil engineering orders decreased by 18.2%, despite a 5.7% increase in net sales for the segment.
See it on page 4The company expanded its corporate structure through the acquisition of Mibu Corporation and the establishment of Takamatsu Construction Group USA, Inc. as part of its 'TRY! NEXT CENTURY 2020' mid-term plan.
See it on page 4Management maintained its full-year forecast of 268,000 million yen in net sales and 15,000 million yen in operating income, supported by an equity ratio of 56.5% as of September 30, 2018.
See it on page 1Takamatsu Construction Group’s consolidated financial results for the first half of the fiscal year ending March 31, 2019, reflect a period of strategic expansion despite a challenging domestic construction market. The company reported net sales of 114,311 million yen, a 2.0% increase compared to the same period in the previous year, marking the seventh consecutive year of growth for the first-half period. However, operating income declined by 34.2% to 3,564 million yen, and net earnings attributable to controlling interests fell by 30.5% to 1,954 million yen. These profit contractions were attributed to a year-over-year decline in high-margin completed projects and increased selling, general, and administrative expenses resulting from aggressive hiring and the integration of new subsidiaries.
The company’s performance across segments was mixed. The architecture segment saw a significant 31.1% surge in orders received, though net sales and operating profit for the segment decreased. Conversely, the real estate segment experienced substantial growth, with sales increasing by 79.8% and operating profit rising by 141.6%. Civil engineering orders declined by 18.2%, while net sales in that segment grew by 5.7%.
Geographically focused on the Japanese market, the group is currently executing its "TRY! NEXT CENTURY 2020" mid-term plan. To bolster future growth, the company expanded its corporate structure through the acquisition of Mibu Corporation and the establishment of Takamatsu Construction Group USA, Inc. As of September 30, 2018, the group maintained a solid financial position with an equity ratio of 56.5%. Management has maintained its full-year consolidated forecast, aiming for 268,000 million yen in net sales and 15,000 million yen in operating income.