Updated Mar 17, 2026 by Korea Creative Content Agency
Report · January 1, 2024
Published by Korea Creative Content Agency
The analysis evaluates Netflix’s strategic expansion and capital allocation within South Korea’s online video market, emphasizing how subscription‑driven revenue and localized content investment shape the company’s growth trajectory. By charting financial performance from 2019 through 2024, the study demonstrates that Netflix’s streaming revenue in the country surged from roughly 175.6 billion won to 898.3 billion won, a more than five‑fold increase that underscores a robust market penetration. Over 99 % of this income derives from direct user subscriptions, indicating an extremely concentrated revenue structure with minimal reliance on ancillary business lines. Revenue growth exhibits a distinct phase pattern: the most pronounced acceleration occurred between 2020 and 2022, followed by a period of steadier, moderate expansion through 2023 and 2024. This temporal dynamic aligns with a parallel escalation in content spending, where annual investment in Korean productions rose from 15 billion won in 2016 to a peak of 550 billion won in 2021. Notably, 2020 alone saw an outlay of approximately 333 billion won, reflecting Netflix’s intensified focus on locally produced dramas and films to attract and retain subscribers. The scope of the assessment is confined to the South Korean streaming sector, covering the years 2016‑2024 and drawing on secondary data from Statista, DART filings, and Korea Eximbank. The methodology relies on quantitative trend analysis of disclosed revenue figures and investment amounts, enabling a clear view of how subscription reliance and targeted content funding have jointly propelled Netflix’s market foothold in Korea.
2024 Netflix’s Growth Strategy and Investment Trends in the Korean Market 01 Revenue Concentration Structure This report provides a comprehensive analysis of Netflix’s growth strategy and investment trends in the Korean market revenue was generated from subscription fees, indicating a highly based on the Online video market in South Korea concentrated revenue structure focused on a single source. conducted by Statista. (Source: Statista) 02 Continuous Revenue Growth Revenue Structure and Growth Trends of Netflix Korea Distribution of revenue of streaming platform Netflix Services Korea (2024) ‣ in South Korea increased by more than five times between 2019 and 2024 According to the chart, Netflix Services Korea generated most of its 2024 revenue from subscription membership. ‣ The chart shows subscription revenue of approximately 898.3 billion South Korean won, while other group revenue appears very small. ‣ This indicates that more than 99% of total revenue was driven by direct user subscriptions rather than other business segments. ‣ between 2020 and 2022, followed by a period of more moderate growth, Netflix also shows strong interest in the Korean market, which aligns with its increasing focus on Korean content production. ‣ The data was provided by DART; Netflix. 04 Long-Term Investment Expansion [Graph 1: Revenue distribution of streaming platform Netflix Services Korea, 2024] [Revenue in billion South Korean won] . Increase in investment from 2016 to 2021: Investment in Korean content 898.28 899.67 steadily expanded from 15 billion won in 2016 to 550 billion won in 2021, with continuous year-on-year growth confirmed in the data.
g platform Netflix Services Korea, 2024] [Revenue in billion South Korean won] . Increase in investment from 2016 to 2021: Investment in Korean content 898.28 899.67 steadily expanded from 15 billion won in 2016 to 550 billion won in 2021, with continuous year-on-year growth confirmed in the data. 1.39 Subscription Netflix Group Total Membership Original Source
Conclusion and Key Takeaways Streaming revenues of Netflix in Korea (2019-2024) ‣ According to the chart, Netflix’s streaming revenues in South Korea show a clear upward trend from 2019 to 2024. ‣ . Reliance on subscription-based revenue: In 2024, most of Netflix Korea's The chart shows revenues rising from about 175.6 billion won in 2019 to approximately revenue was generated from subscription fees, indicating a highly 898.3 billion South Korean won in 2024. ‣ This indicates a steady expansion of Netflix’s streaming business over the six years. ‣ The strongest growth appears to occur between 2020 and 2022, followed by continued but more gradual increases afterward. ‣ These results suggest that online video streaming has become an established form of . Upward revenue trend from 2019 to 2024: Netflix's streaming revenue entertainment in South Korea. in South Korea increased by more than five times between 2019 and 2024 ‣ The data was provided by DART; Netflix. [Graph 2: Netflix streaming revenues in Korea, 2019 -2024] [Revenues in billion South Korean won] 03 Phased Changes in Growth Speed Identifiable growth rate pattern: The largest increases in revenue occurred 898.28 773.28 823.34 as reflected in the numerical data. 629.55 04 398.8 Long-Term Investment Expansion 175.6 steadily expanded from 15 billion won in 2016 to 550 billion won in 2021, with continuous year-on-year growth confirmed in the data. 2019 2020 2021 2022 2023 2024 Original Source
Conclusion and Key Takeaways Investment Strategy in Korean Content Value of Netflix' investments in Korean content in Korea (2016-2021) ‣ According to the chart, Netflix’s investment in Korean content increased steadily from 2016 . Reliance on subscription-based revenue: In 2024, most of Netflix Korea's to 2021. revenue was generated from subscription fees, indicating a highly ‣ The chart shows that investment rose from about 15 billion won in 2016 to 333.1 billion won in 2020. ‣ In 2020, Netflix invested a large amount in Korean video content such as dramas and movies. Continuous Revenue Growth ‣ A sharp increase can be seen from 2019 onward, followed by another significant rise in . Upward revenue trend from 2019 to 2024: Netflix's streaming revenue 2021. in South Korea increased by more than five times between 2019 and 2024 ‣ The highest value shown in the chart is approximately 550 billion South Korean won in 2021. ‣ The data was provided by Korea Eximbank; Netflix. 03 Phased Changes in Growth Speed [Graph 3: Netflix investment value in Korean content, 2016-2021] [Investment value in billion South Korean won] Identifiable growth rate pattern: The largest increases in revenue occurred between 2020 and 2022, followed by a period of more moderate growth, as reflected in the numerical data. 550 04 Long-Term Investment Expansion 333.1 steadily expanded from 15 billion won in 2016 to 550 billion won in 2021, with continuous year-on-year growth confirmed in the data. 81.9 92 2016 2017 2018 2019 2020 2021
ollowed by a period of more moderate growth, as reflected in the numerical data. 550 04 Long-Term Investment Expansion 333.1 steadily expanded from 15 billion won in 2016 to 550 billion won in 2021, with continuous year-on-year growth confirmed in the data. 81.9 92 2016 2017 2018 2019 2020 2021 Original Source
Conclusion and Key Takeaways Conclusion and Key Takeaways 01 Revenue Concentration Structure 01 Revenue Concentration Structure . Reliance on subscription-based revenue: In 2024, most of Netflix Korea's ‧ Reliance on subscription-based revenue: In 2024, most of Netflix Korea’s revenue was generated from subscription fees, indicating a highly concentrated revenue structure focused on a single source. 02 Continuous Revenue Growth 02 Continuous Revenue Growth . Upward revenue trend from 2019 to 2024: Netflix's streaming revenue ‧ Upward revenue trend from 2019 to 2024: 
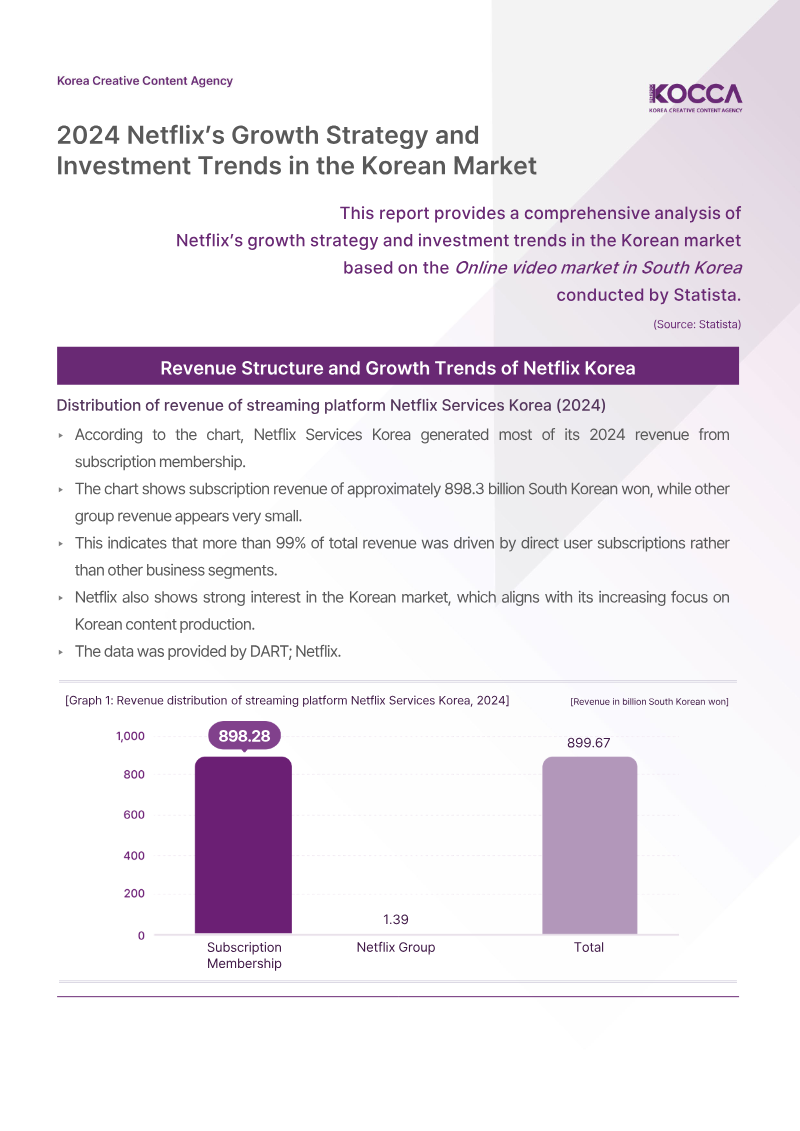
Netflix’s streaming revenue in South Korea increased by more than five times between 2019 and 2024, showing a consistent upward growth trend. 03 Phased Changes in Growth Speed ‧ Identifiable growth rate pattern: The largest increases in revenue occurred between 2020 and 2022, followed by a period of more moderate growth, as reflected in the numerical data. 04 Long-Term Investment Expansion ‧ Increase in investment from 2016 to 2021: Investment in Korean content steadily expanded from 15 billion won in 2016 to 550 billion won in 2021, with continuous year-on-year growth confirmed in the data. with continuous year-on-year growth confirmed in the data. Original Source Statista. (Jan 17, 2025). Online video market in South Korea. https://www.statista.com/topics/8184/online-video-market-in-south-
The interview underscores that the worldwide surge of Korean content is rooted in a “cocreator” fandom model, where streaming services offering seamless subtitle and dubbing options enable audiences to engage directly with material and co‑produce cultural moments. This participatory dynamic is amplified by nostalgia‑driven “comfort viewing” and the rapid diffusion of fan‑made short‑form clips on TikTok, which together reshape attention spans and create a feedback loop that fuels further consumption. A key finding is that Korean productions are breaking out of traditional genre boundaries, as illustrated by titles such as *The Glory*, *D.P.*, *Sweet Home* and *Gyeongseong Creature*. These series now contend not only with other OTT platforms but also with short‑form ecosystems like TikTok and YouTube, as well as user‑generated content. To secure global reach, Korean studios must prioritize distribution channels that combine extensive international footprints with aggressive off‑platform promotion, while exploiting AI‑driven recommendation engines to surface relevant titles amid an oversupply of options. Looking ahead to 2026, success will depend on a balanced strategy that merges technological adaptability, clear conceptual storytelling, and format experimentation. Integrating nostalgia‑centric comfort viewing with cross‑platform interactive campaigns will allow Korean creators to navigate a fragmented global content landscape and maintain competitive relevance across both long‑form and short‑form media environments.
The analysis evaluates South Korean over‑the‑top (OTT) video consumption, aiming to map content preferences, usage intensity, gender‑based viewing patterns, and drivers of subscription cancellation. It situates Korean OTT behavior within the broader online video market, drawing on multiple surveys conducted between June 2023 and November 2024 and covering a combined sample of roughly 3,200 respondents ranging from teenagers to adults in the 20‑59 age bracket. Domestic dramas emerged as the leading content category, capturing 48 % of viewing share, closely followed by OTT‑produced originals at 45 %. Gender differentials were pronounced: 67.1 % of female respondents reported watching dramas compared with 41.5 % of males, while males favored entertainment programs (58 %), news (33.1 %) and sports (35.2 %). Overall engagement was high, with 81.7 % of users streaming at least once per day and an additional 16.3 % accessing services weekly, indicating entrenched daily consumption habits. Cancellation motives clustered around cost and content scarcity. Sixty‑one percent of respondents cited the burden of usage fees as the primary reason to terminate a subscription, and 51 % pointed to a perceived lack of worthwhile content. Secondary factors included fee increases (31 %), limited viewing time (19 %), and the conclusion of favored series (18 %). These insights derive from data supplied by MezzoMedia, Gallup Korea, the Ministry of Science and ICT, the National Information Society Agency, and the Korea Creative Content Agency, employing structured questionnaires administered over defined survey windows. The findings underscore the importance of affordable pricing and fresh, locally resonant programming for sustaining OTT growth in Korea.
The analysis aims to map current e‑sports viewership and engagement patterns among South Korean audiences, highlighting how consumption devices, platforms, and motivations shape the market and indicating the potential for offline event conversion. Findings reveal a sharply concentrated viewing environment: personal computers account for 38.2 % of primary devices and mobile phones 35.9 %, together representing 74.1 % of usage, while laptops, tablets and televisions capture smaller shares. Platform preference is even more centralized, with YouTube commanding 78.5 % of respondents, far ahead of SOOP (14.1 %) and CHZZK (7.2 %). Regularity of consumption is high; 38.5 % of participants watch e‑sports 1–2 times per week and 20.4 % watch 3–4 times weekly, meaning at least 58.9 % engage at least once a week. Weekday sessions cluster around one hour for the majority, whereas weekend viewing extends, with 22 % spending two hours on weekdays and 28.6 % doing so on weekends; longer sessions of five hours or more occur for 4.7 % of weekday viewers and 8.1 % of weekend viewers. Motivational drivers are dominated by entertainment and self‑improvement: 62.1 % watch because the game is fun, 41.9 % seek to enhance their own gameplay, and 37.5 % cite stress relief. Additional reasons include boredom or free access (27.3 %), support for specific players (22.1 %), and social bonding with friends or coworkers (8.6 %). The survey, conducted between June and August 2024, sampled 1,858 South Korean e‑sports viewers aged ten and older, with data supplied by C&I Research and the Korea Creative Content Agency. A clear majority—62.7 %—expressed willingness to attend live e‑sports events, while 26.9 % remain undecided and 10.4 %
The analysis examines how South Korean users consume ultra‑short video content, focusing on platform preferences and viewing behaviors between 2021 and 2023. It demonstrates a rapid shift toward videos of 15 seconds or less, with the proportion of viewers favoring this format rising from 19.7 % in 2021 to 53.2 % in 2023, indicating a strong market demand for bite‑sized entertainment. Survey data collected from 1,883 internet users aged 15‑59 who had watched online video in the preceding week reveals distinct consumption patterns across TikTok, YouTube Shorts and Instagram Reels. In 2023, TikTok users watched an average of 15.4 short videos per session, outpacing YouTube Shorts (11) and Instagram Reels (10.6). Content preferences also diverge: humor and gag videos dominate on both YouTube Shorts (48.2 %) and TikTok (40.5 %), while TikTok shows a higher appetite for restaurant‑related (35 %) and challenge‑type (24.5 %) clips, and YouTube Shorts leans toward entertainment (39.1 %) and everyday‑life themes. The study’s scope is national, covering South Korea’s digital‑savvy population within the 15‑59 age bracket over a three‑year period. Methodologically, the findings derive from two primary surveys: a Statista‑sourced panel of 1,883 respondents (2021‑2023) and a separate 5,000‑person sample collected in February 2023 by a Korean business newspaper, both administered online via Opensurvey platforms. The combined data set provides a comprehensive view of short‑form video consumption trends, highlighting TikTok’s leading role in session volume and the growing prominence of ultra‑short formats across the Korean market.