Related Documents

Financial
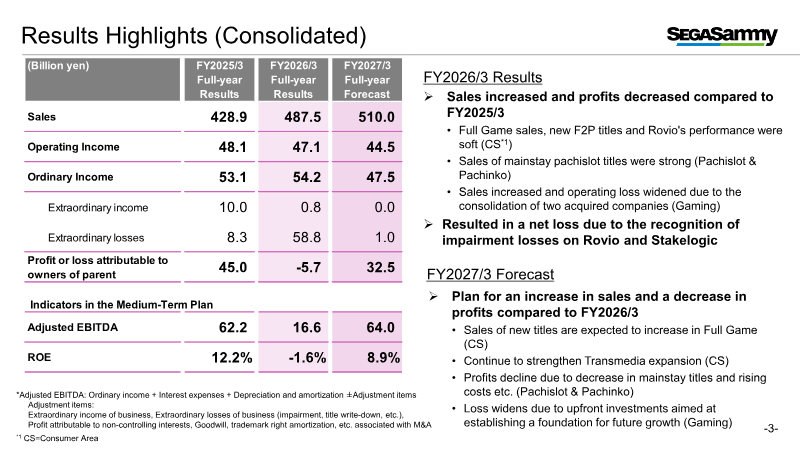
Fiscal Year Ended March 2026: Results Presentation
Fiscal year 2026 ended with a 13 % rise in sales to ¥487.5 bn, yet operating income swung from a ¥48.1 bn profit in FY2025 to a ¥5.7 bn loss, driven by significant goodwill impairments on Rovio and Stakelogic and a widening deficit in the Gaming segment. Adjusted EBITDA fell to ¥16.6 bn, reflecting heavy upfront development costs and impairment charges, while net equity contracted by ¥48.7 bn as cash balances were depleted following the acquisitions of GAN and Stakelogic. Within Entertainment Contents, sales edged up to ¥326.6 bn from ¥321.5 bn, but operating income declined from ¥40.8 bn to ¥32.4 bn because new Full‑Game and F2P titles underperformed, despite steady growth in licensing revenue. Forecasts for FY2027 project sales of ¥357 bn and operating income of ¥42.5 bn, contingent on successful new IP launches, repeat sales, and a planned lift in licensing income. Margin erosion from title underperformance remains a key risk. Capital allocation for FY2026/3 was restructured to focus on ¥190 bn of cumulative investment over FY2025–FY2027, allocating ¥80 bn to development, ¥120 bn to strategic acquisitions, and planning ¥70 bn in share buybacks while pausing large‑scale M&A. Shareholder returns are expected to rise sharply, with FY2026/3 projected at ¥31.5 bn (≈¥11.7 bn in dividends) and FY2027/3 potentially reaching ¥16.2 bn under a 50 % total‑return ratio applied to projected net income. Pachislot sales showed modest growth, buoyed by new titles and strong first‑week performance of flagship IPs such as “Hokuto No Ken” and “Kabaneri of the Iron Fortress.” Pachinko sales declined as the temporary lift from Lucky Trigger 3.0 Plus faded and hall utilization softened. The group plans to introduce reel‑exchangeable cabinets, expected to account for roughly 20 % of pachislot revenue, and is positioning the gaming business for a J‑curve bottom in FY2027 through intensive lease sales and B2B platform upgrades. The release schedule for FY2026/3 emphasizes a concentrated push of multi‑platform titles, including the Nintendo Switch 2 launch in March 2026 and a slate of global releases across consoles, PC, and mobile from late 2025 to mid‑2026. Key animation properties such as *Detective Conan* and *Lupin the Third* are slated for April–June 2025, with several new IPs and Netflix exclusives planned for early 2026. Pachislot and pachinko product launches are detailed with projected unit sales ranging from 8,000 to 49,000 units across varying gambling‑specification tiers.
SegaSammyMay 2026

Financial
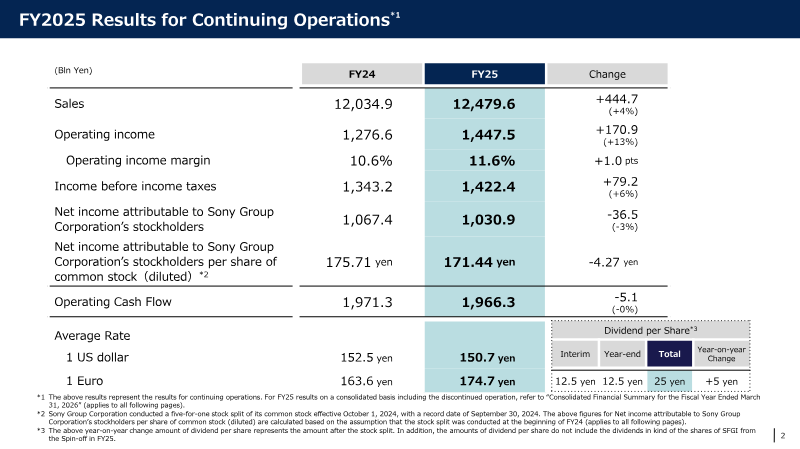
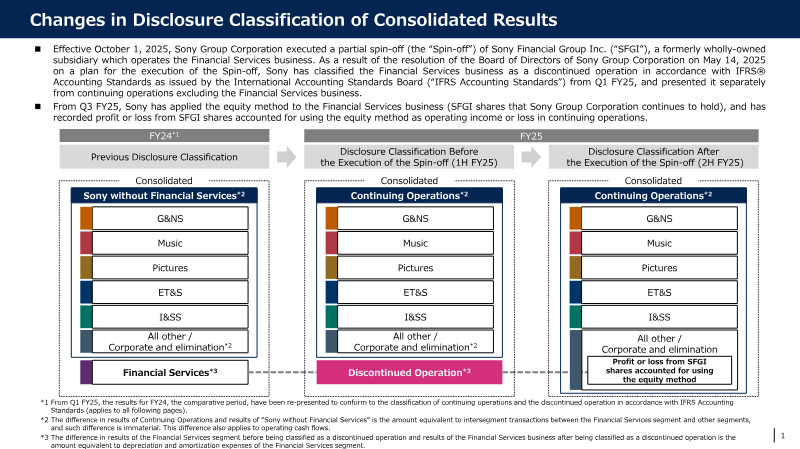
FY2025 Consolidated Financial Results
Sony Group’s FY2025 consolidated results demonstrate modest revenue growth and a mixed profitability profile across its core business units. Total sales increased 4 % to ¥12.48 trn, largely driven by higher operating income in the Imaging & Sensing Solutions (I&SS) and Music segments. Operating income rose 13 % to ¥1.45 trn, while net income attributable to shareholders fell 3 % to ¥1.03 trn because of a larger equity‑method loss in the Financial Services arm and higher impairment charges. Operating cash flow remained flat at ¥1.97 trn, and the spin‑off of Sony Financial Group was treated as a discontinued operation from Q1 FY25 onward. Within the Music division, sales climbed 15 % to ¥277.5 billion, propelled by growth in Recorded Music and Music Publishing streaming revenues (+9 % and +14 % respectively), live‑event income, and a strong contribution from the Demon Slayer franchise. Operating income in this segment surged 25 % to ¥89.7 billion, reaching a record high even after excluding one‑time items. Sony projects flat sales for FY2026, with operating income expected to decline 11 % to ¥47 billion as streaming gains are offset by the loss of Demon Slayer’s impact. The company consolidates its Pictures and Music results on a U.S. dollar basis, translating foreign‑currency sales and costs using weighted average exchange rates while accounting for hedging transactions. Foreign‑exchange fluctuations affect both sales and operating income, with I&SS hedging gains or losses incorporated into these calculations. These disclosures supplement, but do not replace, Sony’s IFRS‑compliant consolidated financial statements.
Sony Group CorporationMay 2026

Financial
Enthusiast Gaming Holdings Inc. Consolidated Financial Statements: 2025 and 2024
Enthusiast Gaming Holdings Inc. experienced a pronounced deterioration in financial health during 2025, with total assets halving to $64.9 million from $128.4 million in 2024 and a cumulative deficit of $484.9 million. Net loss narrowed to $44 million, yet revenue fell sharply to $32 M and operating losses from discontinued operations reached $34 M. Shareholders’ equity collapsed to $1.78 million, while liabilities rose to $64.9 M, creating a working‑capital deficit that raises serious going‑concern doubts. Key accounting policies emphasize foreign‑currency translation, principal‑vs‑agent revenue recognition across media, subscription, events, esports and merchandise streams, and goodwill impairment testing. IFRS‑based policies apply CGU impairment reviews, fair‑value measurement for financial instruments, and simplified expected credit loss provisioning. Recent IAS 21 amendments had no material effect, but forthcoming IFRS 18 and IFRS 9 changes are under review. Debt restructuring dominated 2025, with multiple forbearance agreements and new term loans (A and B) carrying high fixed rates (14–16%) and PIK/convertible features. Losses on debt modification totaled over $400 million, and covenant breaches triggered potential acceleration of repayments. Current long‑term debt portions rose to $45.58 million, while earn‑out liabilities were largely settled. Liquidity remains fragile; trade receivables fell to $4.81 million, and interest expense—including default interest—reached $1.81 million. Capital management remains heavily reliant on external financing, with significant deferred tax assets tied to Canadian loss carryforwards expiring by 2045. Overall, the company’s financial position has weakened sharply, and continued viability depends on additional capital or restructuring.
Enthusiast Gaming HoldingsApr 2026

Report
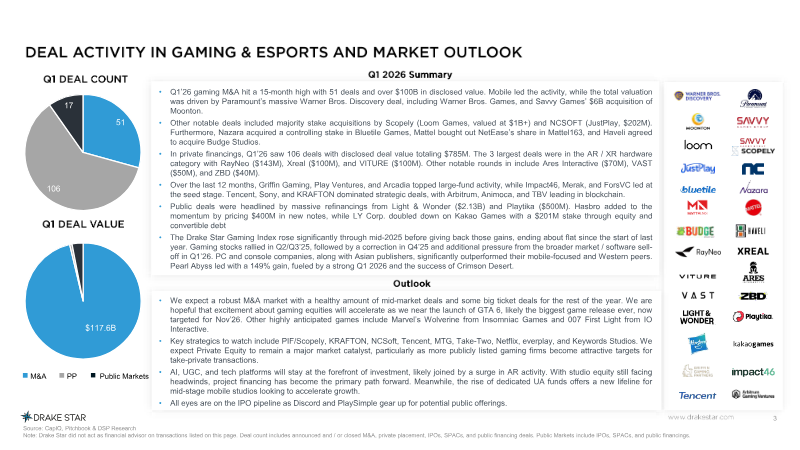
Global Gaming Report Q1 2026
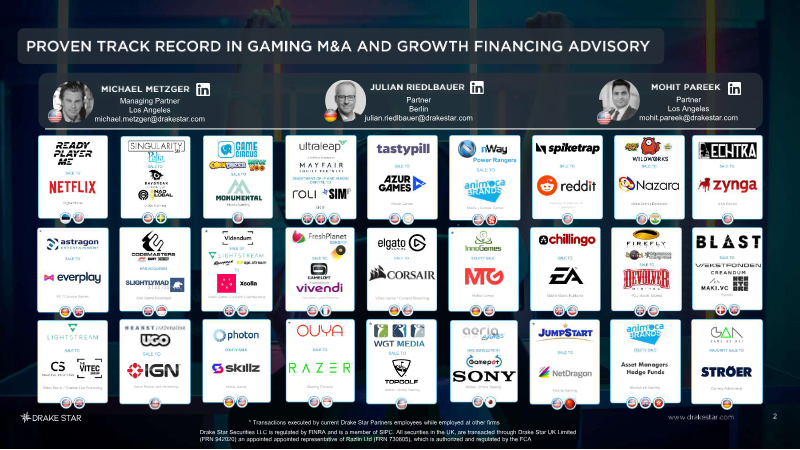
LOS ANGELES | SAN FRANCISCO | NEW YORK | LONDON | PARIS | MUNICH | BERLIN | DUBAI PROVEN TRACK RECORD IN GAMING M&A AND GROWTH FINANCING ADVISORY PROVEN TRACK RECORD IN GAMING M&A AND GROWTH FINANCING ADVISORY MICHAEL METZGER JULIAN RIEDLBAUER Linkedin - Free social media icons MOHIT PAREEK Linkedin - Free social media icons MICHAEL METZGER JULIAN RIEDLBAUER ...
Drake Star PartnersApr 2026