FinancialKoei Tecmo Holdings Co.
Financial Results: Fiscal Year Ending March 2026
29 pages~25 min full read
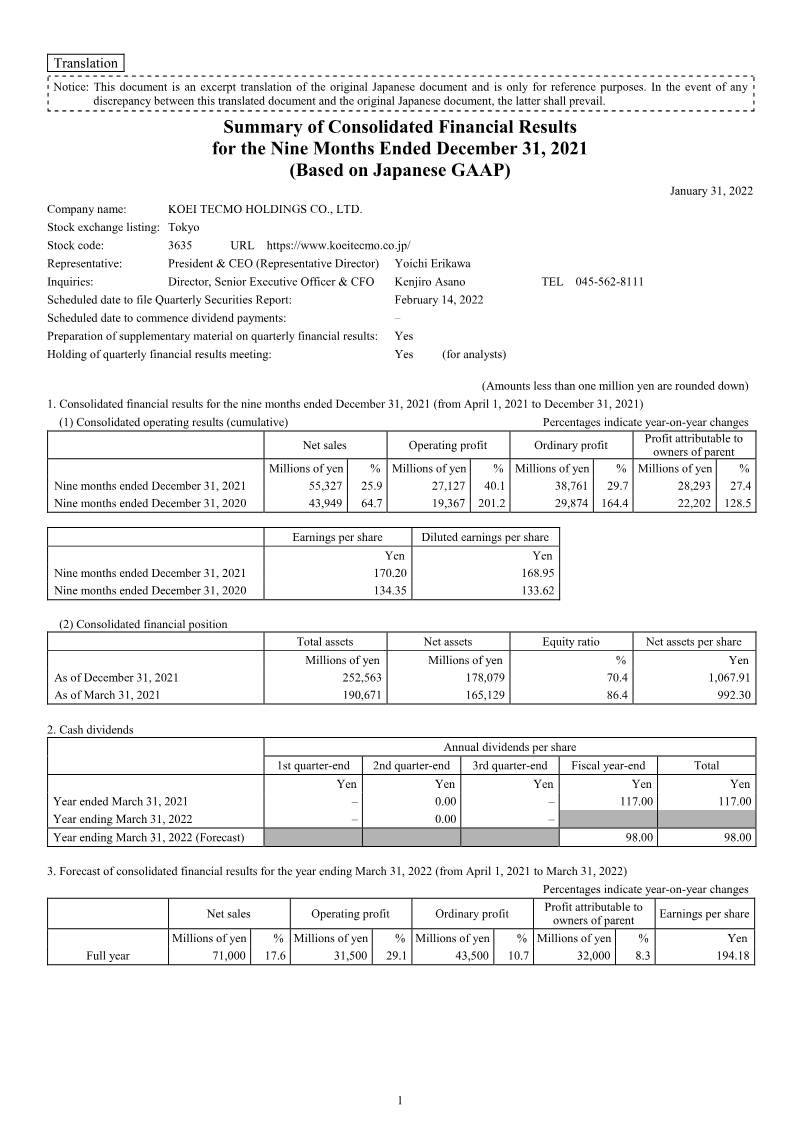
KoEI Tecmo Holdings achieved record‑high financial performance in fiscal year 2025, reporting sales of ¥88.4 billion, operating profit of ¥37.2 billion and net profit of ¥42.8 billion. Growth was driven by 16 new in‑house and collaborative titles across console, PC and mobile platforms, alongside robust royalty income. The Entertainment unit was the primary growth engine, while Amusement and Real Estate contributed modest gains; the Other segment incurred a loss due to venture‑capital expenditures. Management projects FY2026 sales of ¥90 billion and operating profit of ¥32 billion, a slight decline from FY2025, yet maintains a target of cumulative operating profit exceeding ¥100 billion over the fourth medium‑term management period and a dividend of ¥48 per share.
Projected FY2026 earnings anticipate a 29 % drop in Japan sales and a 27 % decline overseas, with unit volumes falling from 14.1 million to 10 million and a three‑point increase in the digital‑download ratio. Cost pressures are expected to rise, with labor costs up 10 % annually and outsourcing/advertising aligned with sales growth. The company will preserve a 50 % payout ratio, aiming for ¥50 per share dividends and a cumulative operating profit above ¥100 billion across the medium‑term period. Strategic priorities include expanding the development pipeline, enhancing global marketing and IP utilization to achieve a FY2026 operating profit of ¥40 billion.
FY2026 also marks significant organizational restructuring, with the global marketing and IP divisions rebranded as Global Marketing Division and Global IP Division to reinforce worldwide business development. Human‑capital investment accelerated, adding 151 employees in FY2025 and 193 new hires in FY2026, complemented by a new Yokohama office. Labor costs reached ¥72.5 billion, while over ¥110 billion is earmarked for future growth initiatives. AI‑driven process innovations have cut multilingual translation and support tasks by more than 50 %, boosting operational efficiency and expanding development capacity.

Sony Group Corporation · 2026

Bandai Namco · 2026

InvestGame · 2025
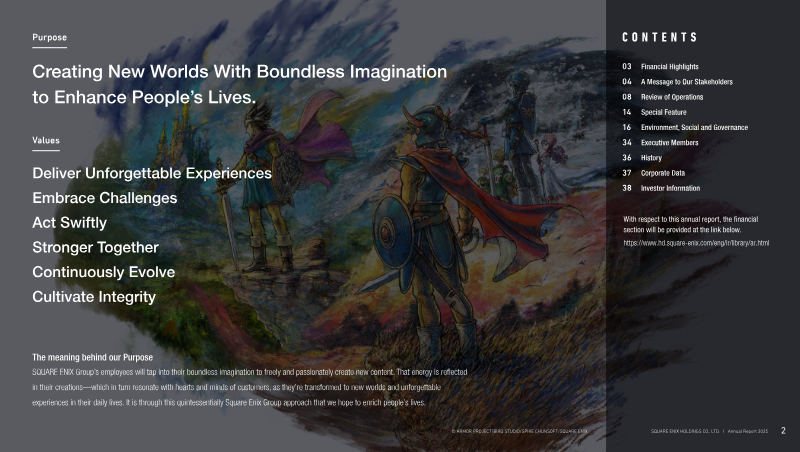
Square Enix · 2025
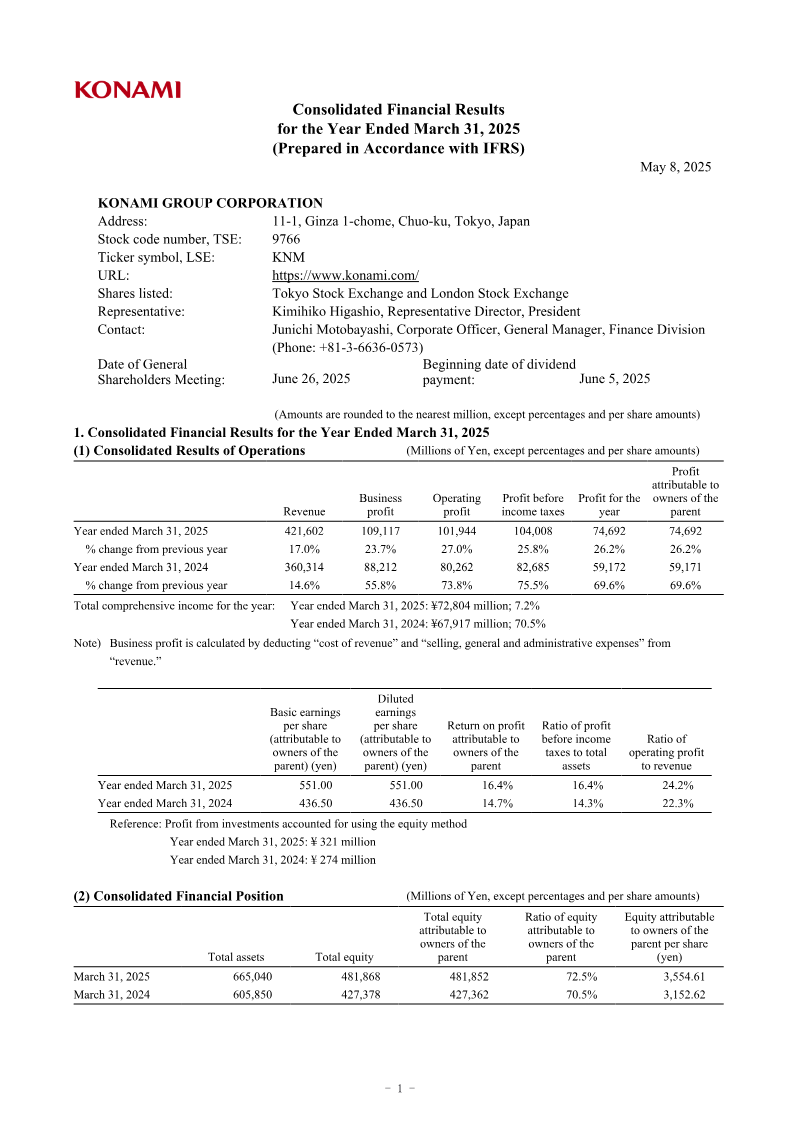
Konami · 2025
Nintendo · 2024
Bandai Namco · 2022

Bandai Namco · 2021
GREE · 2017

Bandai Namco · 2017
GREE Inc. · 2016
Bandai Namco · 2014