FinancialKoei Tecmo
Financial Results for the First Half: Fiscal Year Ending March 2026
20 pages~20 min full read
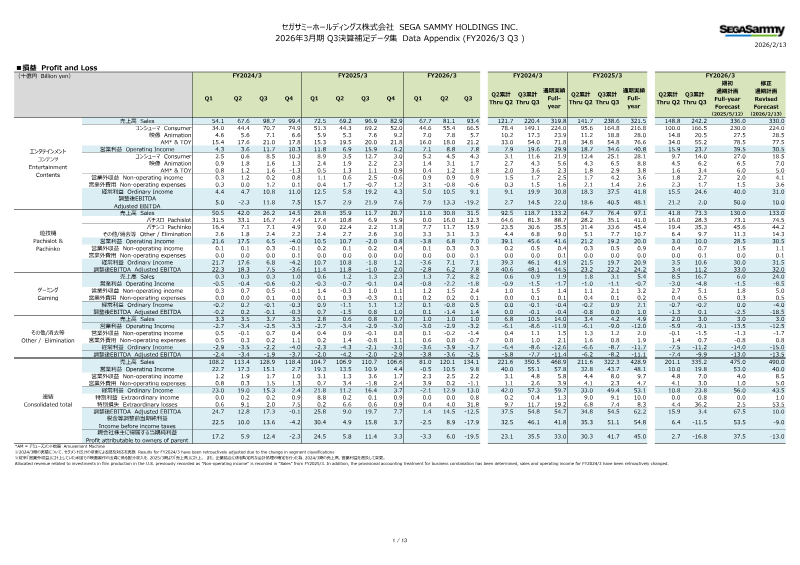
Koei Tecmo reported H1 FY2026 sales of ¥35.2 billion and operating profit of ¥10.7 billion, exceeding initial forecasts but representing year-over-year declines of 11.2% and 25.2% respectively.
See it on page 4Net profit fell 15.7% to ¥13.5 billion, primarily due to a contraction in the online and mobile entertainment segment, though repeat sales of existing titles partially mitigated the impact of weaker new releases.
See it on page 3The company maintains a conservative full-year outlook for FY2025, projecting ¥92 billion in sales, ¥31 billion in operating profit, and ¥27 billion in net profit, with expectations for growth driven by Q3 and Q4 title launches.
See it on page 4Under the 'Creating a Foundation for Growth' medium-term plan, Koei Tecmo is targeting ¥100 billion in cumulative operating income over three years and a single-year profit goal of ¥40 billion.
See it on page 15Entertainment segment sales dropped 12% to ¥28.5 billion, while the amusement and real-estate units saw modest growth, and the 'Other' segment reported a ¥320 million loss due to venture-capital costs.
See it on page 5Corporate governance efforts reached a milestone in September 2025 with a treasury-share disposal that increased tradable shares to 37.3%, satisfying Tokyo Stock Exchange Prime Market criteria.
See it on page 12Strategic growth initiatives focus on multi-platform releases, global marketing expansion, and leveraging the Atelier series IP for increased licensing and merchandise revenue.
See it on page 20Koei Tecmo Holdings reported first‑half fiscal 2026 results, showing sales of ¥35.2 billion and operating profit of ¥10.7 billion, both surpassing the company’s initial forecasts but falling 11.2 % and 25.2 % respectively compared with the same period in FY24. Net profit declined 15.7 % to ¥13.5 billion, driven mainly by a contraction in the online and mobile entertainment segment; repeat sales of existing titles offset declines in new releases. Labor costs rose, yet variable and outsourcing expenses fell, improving operating efficiency.
Segment analysis revealed a 12 % drop in entertainment sales to ¥28.5 billion, while amusement and real‑estate units grew modestly (¥2.3 billion and ¥635 million respectively). The “Other” segment recorded a loss of ¥320 million, reflecting venture‑capital management costs. Forecasts for FY25 maintain a conservative outlook: projected sales of ¥92 billion, operating profit of ¥31 billion, and net profit of ¥27 billion, with a dividend per share of ¥43. The company expects the second half to benefit from new title launches scheduled for Q3 onward.
The presentation also covered corporate governance and compliance, noting a successful treasury‑share disposal in September 2025 that raised tradable shares to 37.3 %, meeting Tokyo Stock Exchange Prime Market criteria. Strategic highlights include the fourth medium‑term plan, “Creating a Foundation for Growth,” targeting cumulative operating income of ¥100 billion over three years and a single‑year profit goal of ¥40 billion. Emphasis is placed on balanced pipeline development, multi‑platform releases, and global expansion through strengthened overseas marketing and publishing partnerships. The IP division’s focus on licensing and merchandise, particularly for the Atelier series, aims to diversify revenue streams and enhance brand value worldwide.