Related Documents
Financial
Financial Results: Fiscal Year Ended December 31, 2025 (Japan)
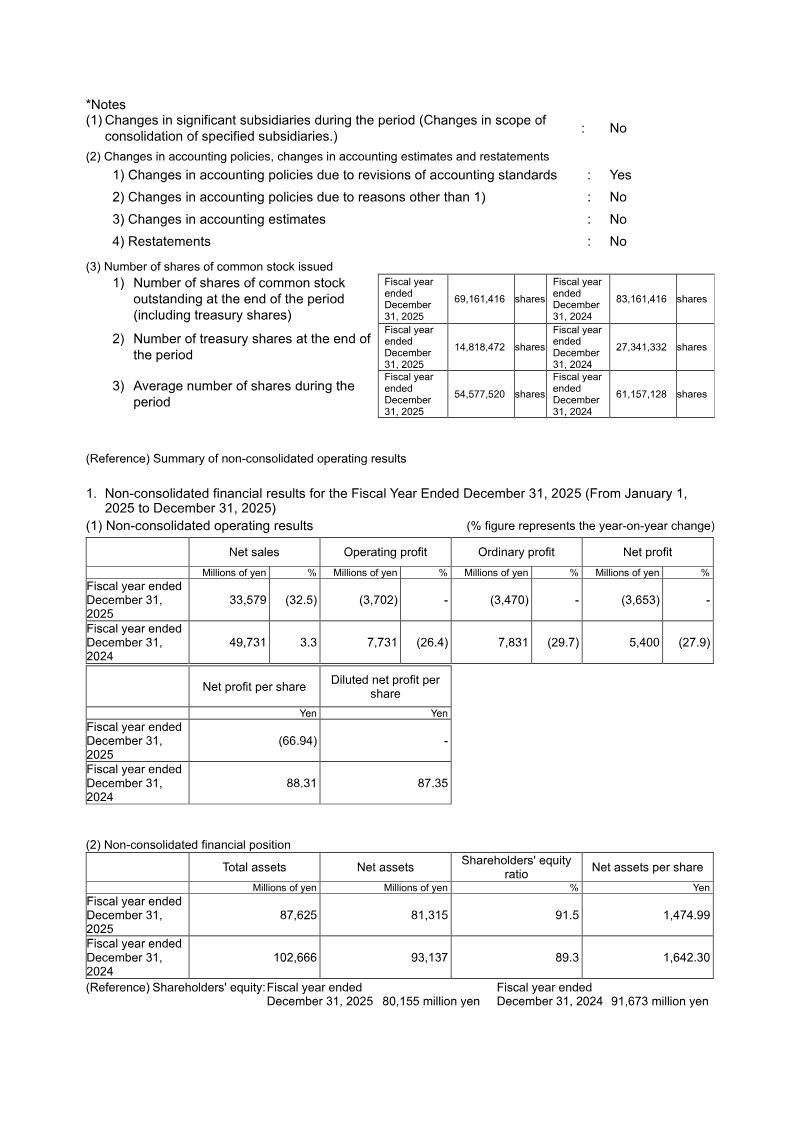
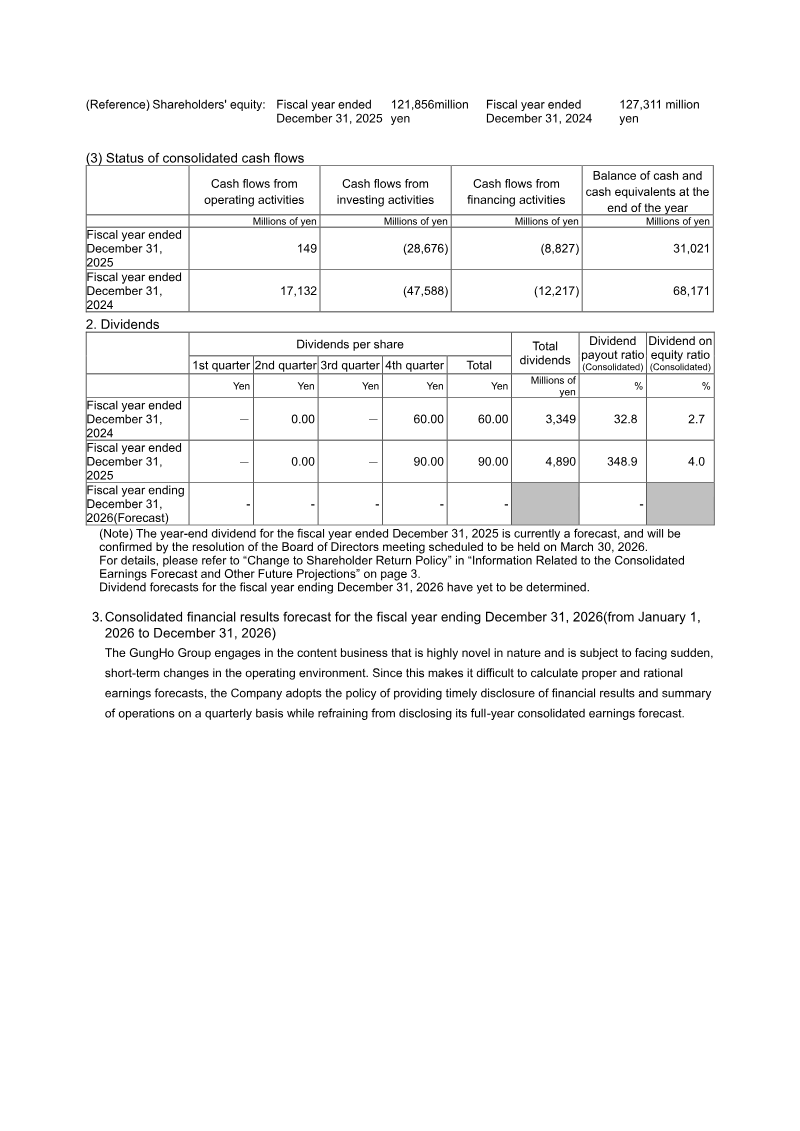
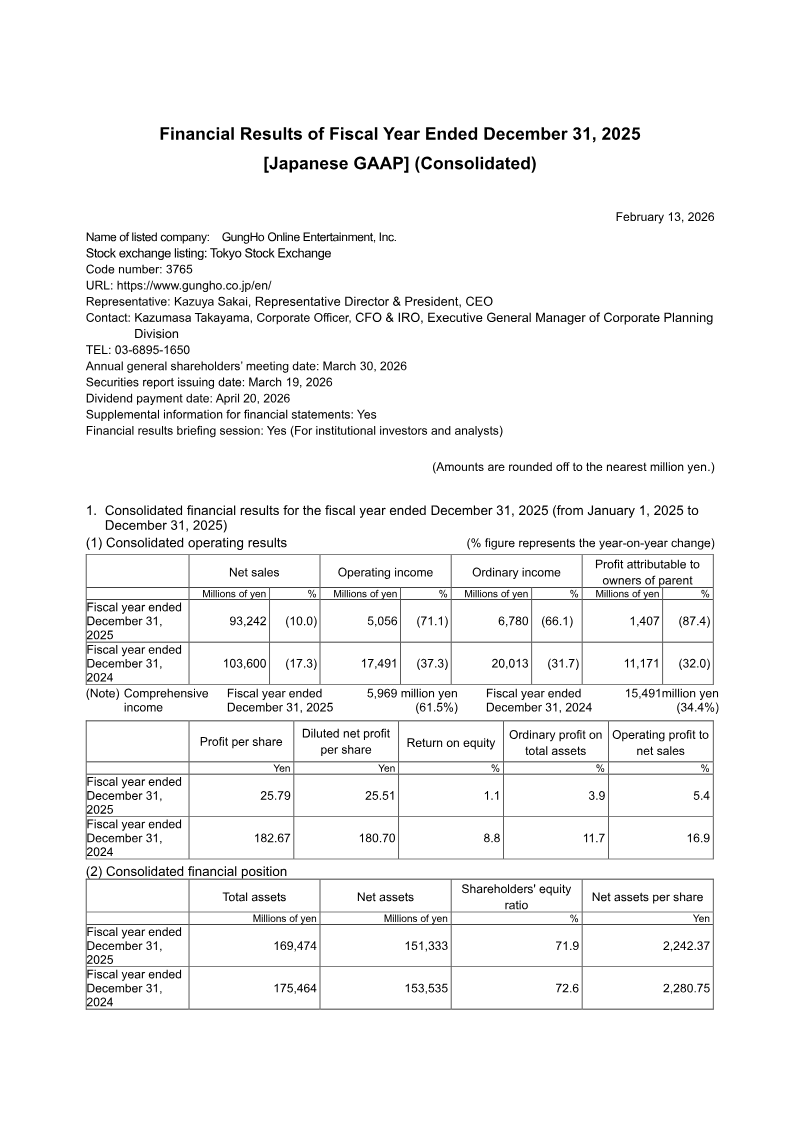
GungHo Online Entertainment reported a 10 % decline in consolidated net sales to ¥93,242 million for fiscal year 2025, with operating profit falling 71.1 % to ¥5,056 million and attributable profit dropping 87.4 % to ¥1,407 million. The downturn is attributed to higher development costs and a flat mobile‑gaming market, while total assets increased to ¥169,474 million. Cash balances fell sharply to ¥31,021 million due to significant investing and financing outflows, notably treasury‑share repurchases. In response, the company announced a revised shareholder‑return policy that targets a 30 %+ dividend payout ratio and sets an ordinary dividend of ¥90.00 per share for FY 2025, signalling a shift toward more proactive profit distribution. The new policy adopts a dual approach of stable dividends and flexible share buybacks. It aims for a 4 % dividend‑on‑equity (DOE) and a consolidated payout ratio of at least 50 %, while buybacks will be executed as capital‑efficiency measures based on board decisions and market conditions. This change takes effect from the fiscal year ending December 31, 2025. Profitability metrics deteriorated sharply: net profit per share fell from ¥182.67 to ¥25.79, and fully‑diluted net profit per share declined similarly; net assets per share decreased modestly from ¥2,280.75 to ¥2,242.37. Net sales remained concentrated in Japan (¥31.8 bn) and Asia, with Indonesia now reported separately at ¥3.6 bn after reclassification from the broader “Asia” category. The company also approved a 2026 treasury‑share repurchase program of up to ¥5 bn for 2.1 million shares, followed by a cancellation of 16 million shares to improve capital efficiency.
GungHo Online EntertainmentFeb 2026
Financial
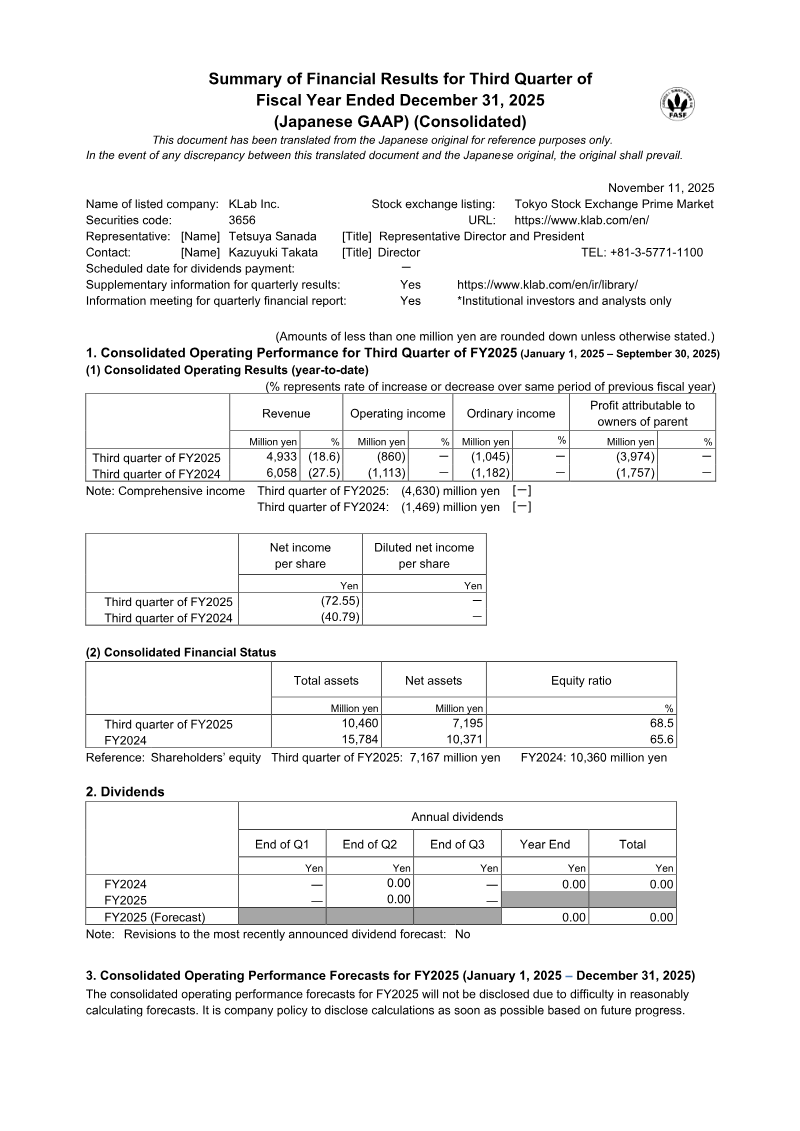
Summary of Financial Results for Third Quarter of Fiscal Year Ended December 31, 2025
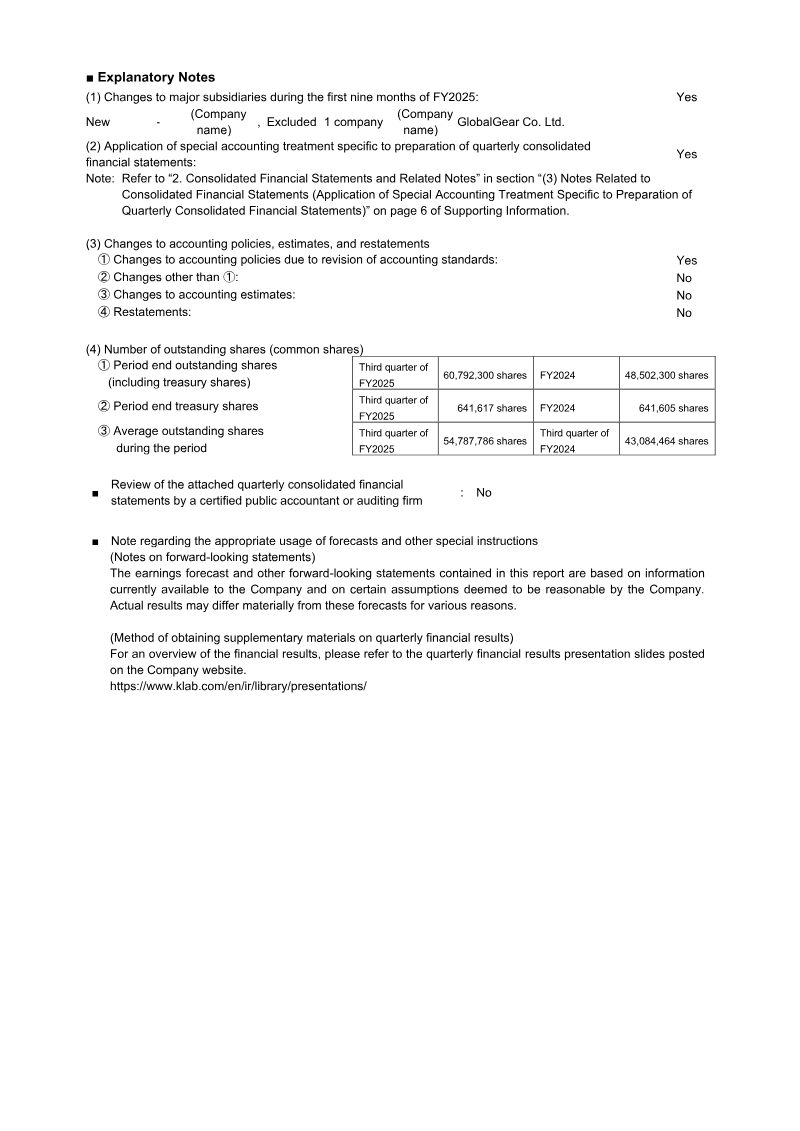
KLab Inc. experienced a significant downturn during the third quarter of fiscal year 2025, characterized by an 18.6% year-over-year revenue decline to ¥4.93 billion. This contraction was primarily driven by weakening performance in established titles such as Captain Tsubasa: Dream Team and a general decrease in income from paid users within the game business. Despite aggressive cost-cutting measures and a ¥1.57 billion gain from the sale of investment securities, the company recorded a substantial net loss of ¥3.97 billion. This loss was largely precipitated by a massive ¥4.42 billion impairment charge on software assets related to EA SPORTS FC™ TACTICAL and a reduction in goodwill following the divestment of GlobalGear Co. Ltd. The financial strain resulted in a decrease of over ¥3.1 billion in total net assets, though the company mitigated some impact by raising approximately ¥719 million through the exercise of stock acquisition rights. While four consecutive years of operating deficits have prompted scrutiny regarding the company’s status as a going concern, management asserts that no material uncertainty exists. This confidence is based on steady progress with major intellectual properties, including Dragon Quest and My Hero Academia, alongside a strategic pivot toward generative AI and blockchain ventures to diversify future revenue streams. Operating within the Japanese market during a period of rapid industry volatility, the company has withheld future performance forecasts. The current strategy focuses on maintaining liquidity through strict cost controls and asset sales while transitioning the business model to leverage emerging technologies. Despite the current net losses and the impairment of software in progress, the segment profit of ¥592 million suggests that core operations remain functional as the group attempts to stabilize its capital position and return to long-term profitability.
KLabNov 2025
Financial
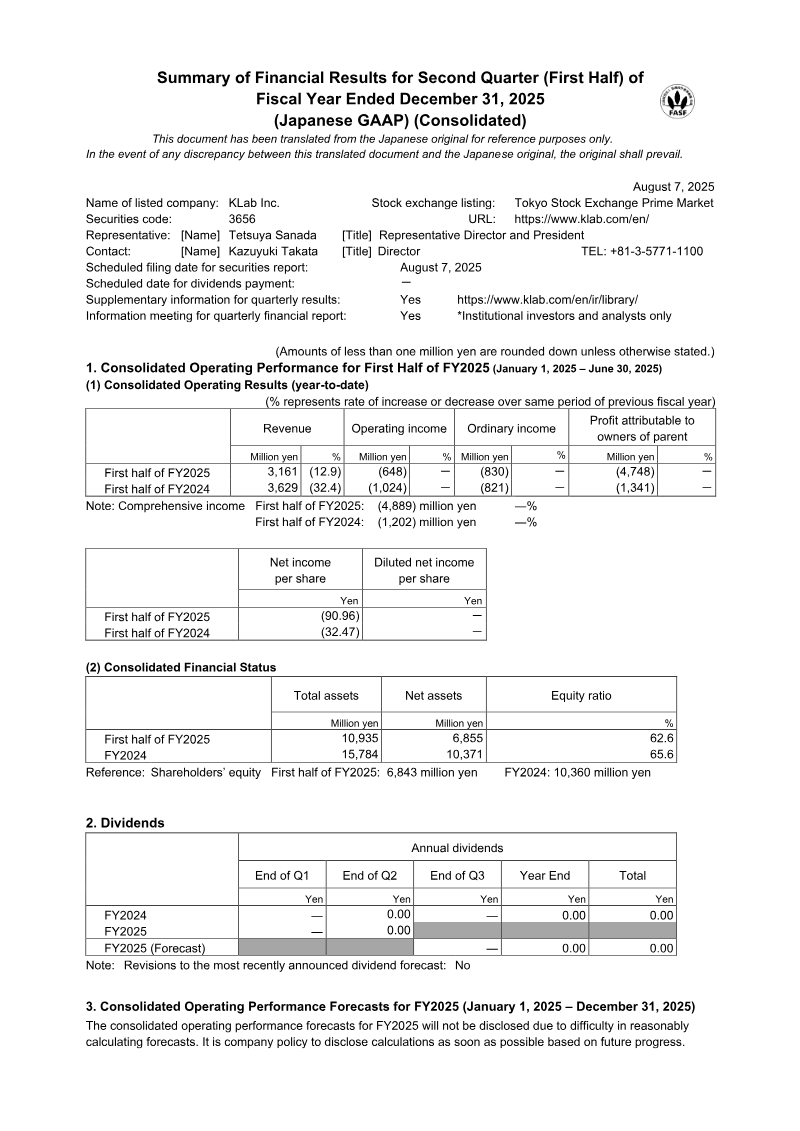
Summary of Financial Results for Second Quarter (First Half) of Fiscal Year Ended December 31, 2025
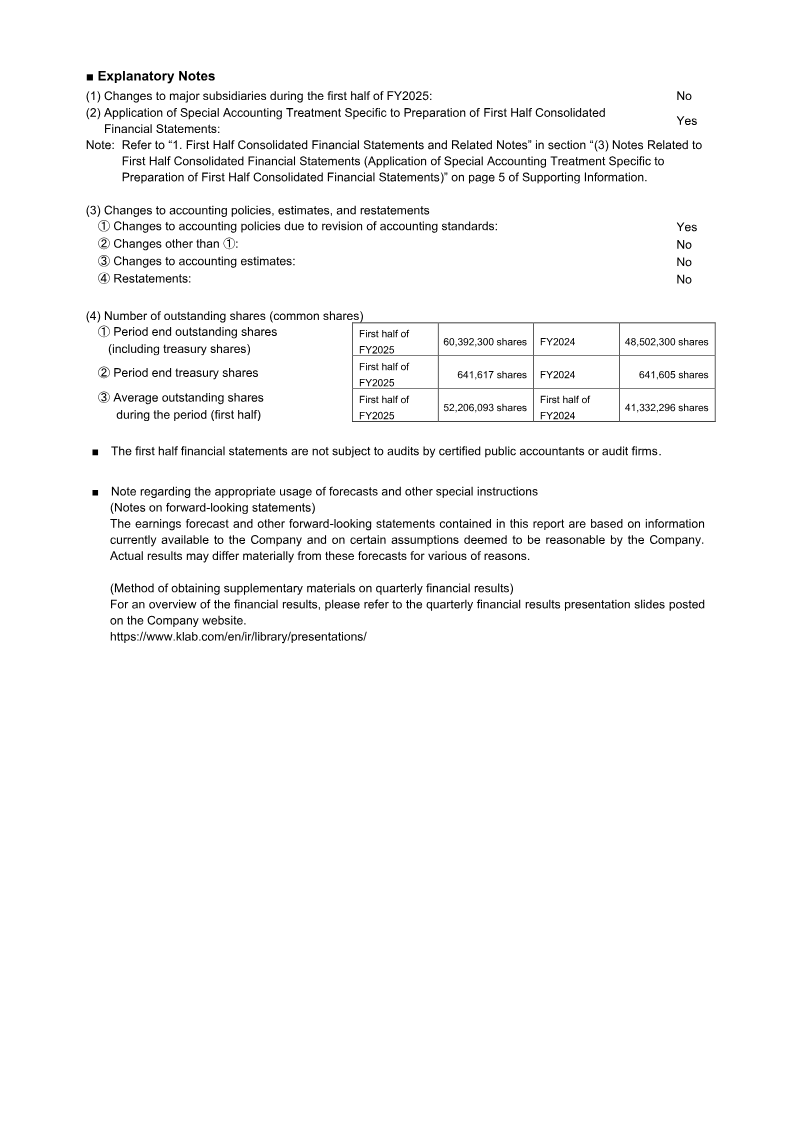
KLab Inc. experienced a challenging first half of the fiscal year ending December 31, 2025, characterized by a 12.9% year-over-year revenue decline to 3,161 million yen and a substantial net loss of 4,748 million yen. This loss was primarily driven by a 4.43 billion yen impairment on software in progress, which contributed to a sharp reduction in total assets from 15.7 billion yen to 10.9 billion yen. Despite these pressures, the game business segment achieved a profit of 313 million yen, and operating losses showed slight improvement compared to the previous year. Due to ongoing volatility and the difficulty of projecting future performance, no full-year forecast has been provided, and interim dividends have been suspended. To stabilize its financial position and pivot its corporate strategy, the firm executed several capital-raising and restructuring initiatives. These included the sale of the subsidiary GlobalGear for 1.1 billion yen and the issuance of new stock acquisition rights. These rights are tied to rigorous performance hurdles, requiring the company to achieve over 1,000 million yen in non-game revenue and a market capitalization exceeding 10 billion yen before they can be exercised. These measures are designed to incentivize a recovery in market value and diversify revenue streams beyond traditional mobile gaming. Management remains focused on achieving profitability through aggressive cost-cutting, workforce optimization, and a refined development pipeline. While the company has faced four consecutive years of operating deficits and delays in the release of EA SPORTS FC™ TACTICAL, it maintains that there is no material uncertainty regarding its status as a going concern. Future growth is predicated on the successful launch of new projects, including a My Hero Academia title and an expansion into the hybrid casual gaming market. This strategic shift aims to balance the high-risk nature of major game development with more sustainable, diversified business operations.
KLabAug 2025
Financial
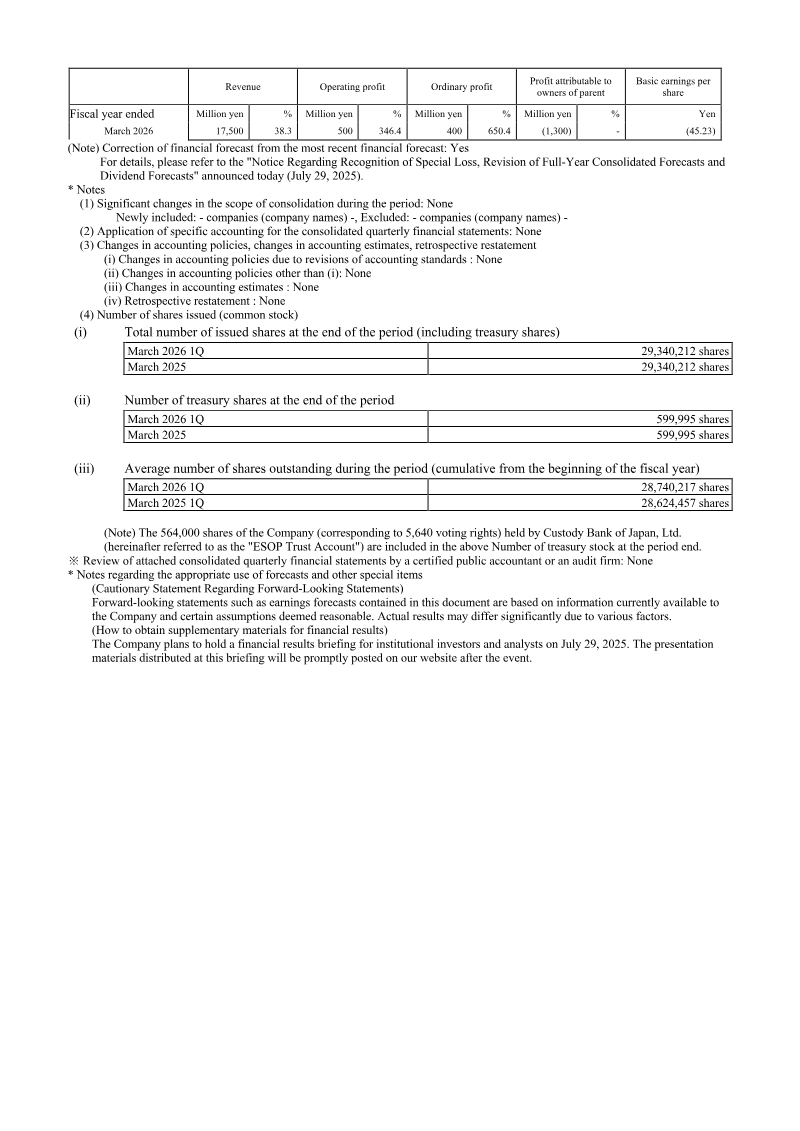
FY03/2026 1Q Consolidated Financial Results: Japan
Drecom Co., Ltd. reported its consolidated financial results for the first quarter of the fiscal year ending March 2026, covering the period from April 1, 2025, to June 30, 2025. The company’s primary mission centers on global entertainment expansion through the integration of intellectual property and technology. The financial results reflect a period of significant revenue growth offset by substantial impairment losses, leading to a net loss for the quarter. Total revenue for the first quarter reached 4,466 million yen, representing a 110.4% increase compared to the same period in the previous year. This growth was largely driven by the performance of the mobile game title Wizardry Variants Daphne. Despite this revenue surge, the company recorded an operating loss of 81 million yen and an ordinary loss of 107 million yen. A major factor in the quarterly performance was an extraordinary impairment loss of 1,563 million yen, attributed to the reassessment of future earnings for a mobile game title released in the previous fiscal year that performed below expectations. Consequently, the quarterly net loss attributable to owners of the parent company totaled 1,799 million yen. The company operates across two primary segments: the Game Business and the Content Business. The Game Business generated 4,327 million yen in sales, though segment profit declined by 51.6% due to increased variable and fixed costs associated with new title releases. The Content Business, which focuses on publishing and merchandise, saw revenue rise to 155 million yen, with a reduced segment loss of 204 million yen as the company continues to invest in new business areas. Following these results, the company has revised its full-year consolidated earnings forecasts for the fiscal year ending March 2026.
Drecom Co.Jul 2025