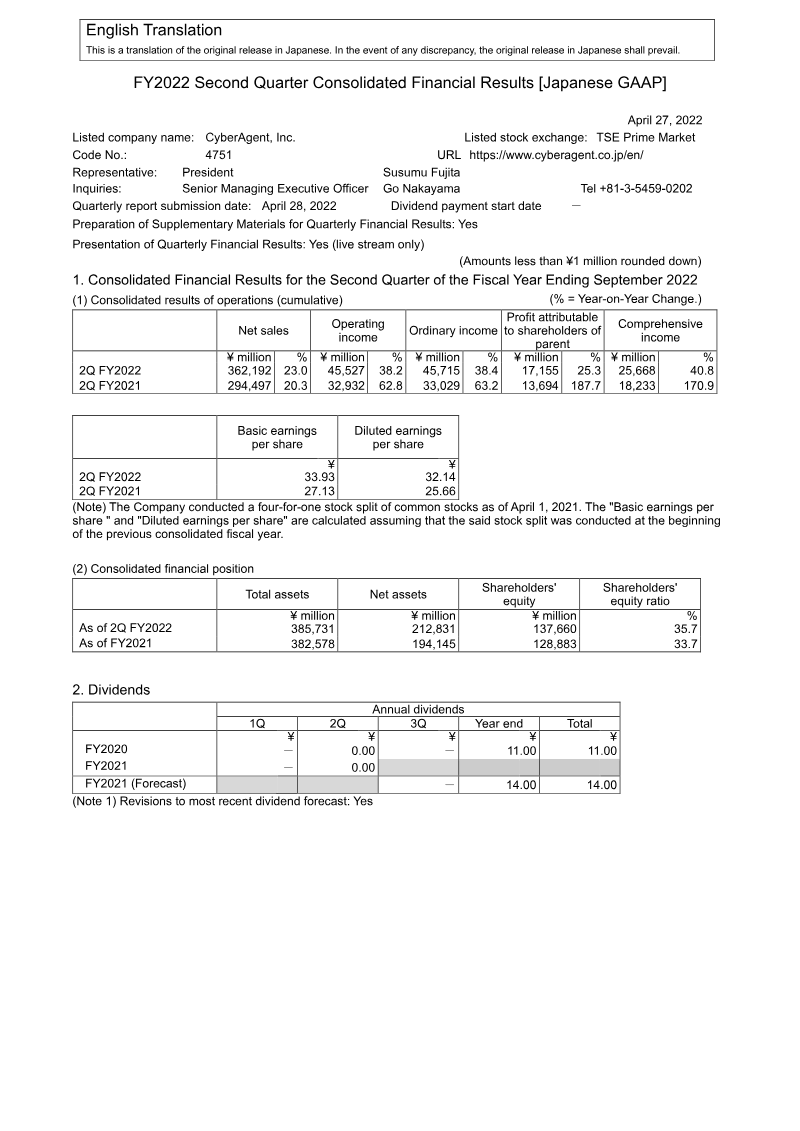
Updated Mar 17, 2026 by CyberAgent
Financial · October 1, 2022
Published by CyberAgent
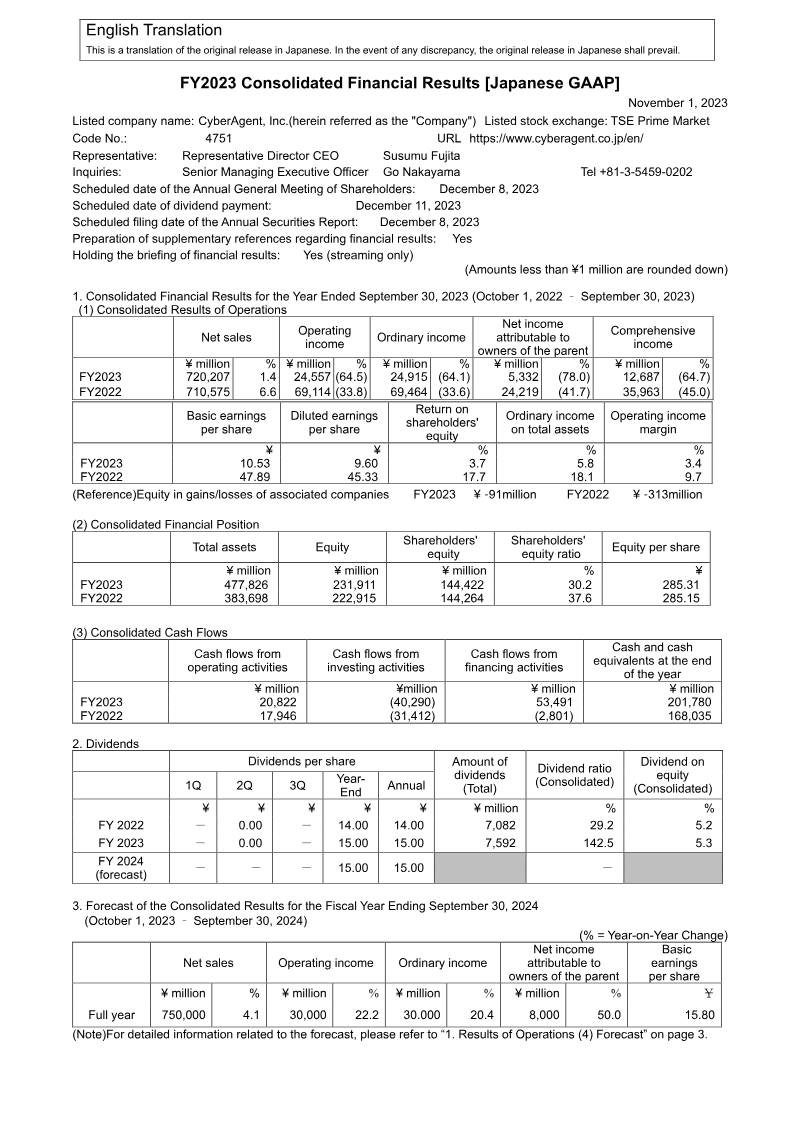
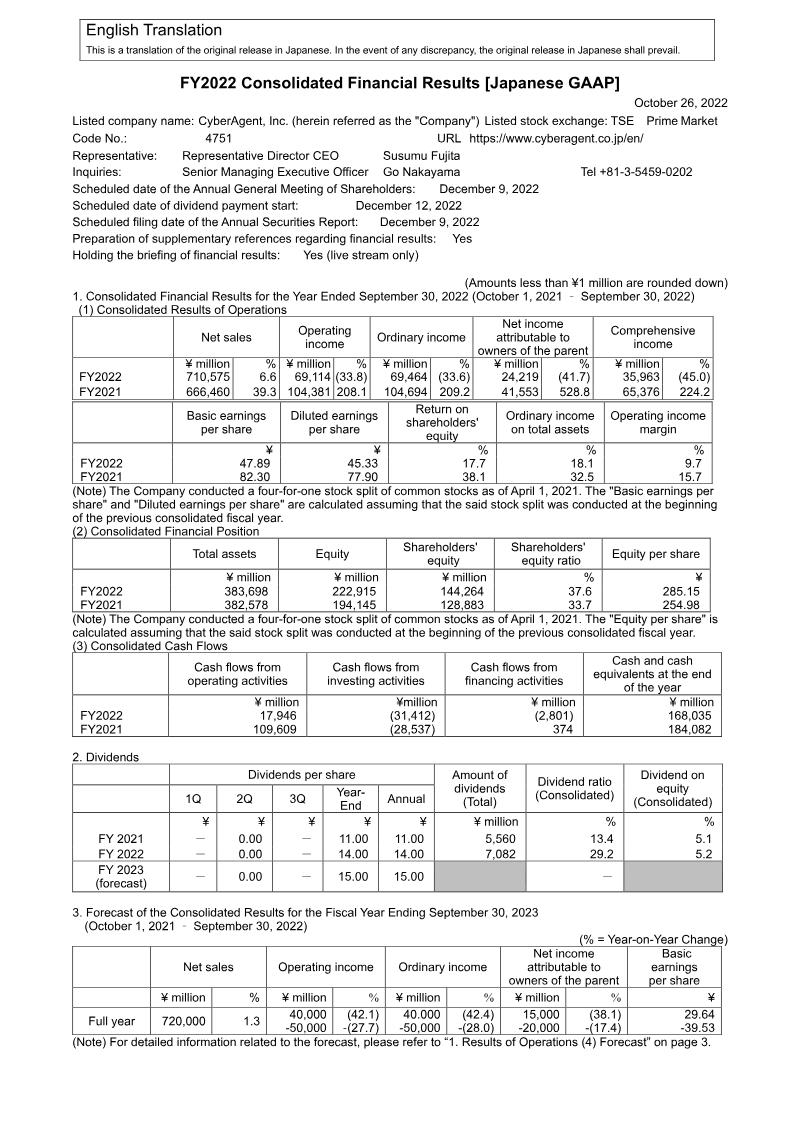
CyberAgent achieved record net sales of ¥710.6 billion for the 2022 fiscal year, representing a 6.6% year-on-year increase. This growth was primarily driven by the Internet Advertisement Business, which expanded by 17.3%, and a 35.3% revenue surge in the Media Business fueled by the ABEMA platform. Despite these gains, consolidated operating income fell 33.8% to ¥69.1 billion, while net income attributable to the parent dropped to ¥24.2 billion. This profitability decline stems largely from a normalization of the Game Business, which saw sales and operating income decrease by 13.1% and 37.2% respectively as major titles from the previous year experienced natural slowdowns. The financial landscape was further impacted by a shift in revenue recognition for the Game Business, moving from the point of purchase to the estimated customer usage period. While shareholders' equity grew to ¥222.9 billion, cash and cash equivalents decreased to ¥168 billion due to elevated tax payments and strategic investing activities. The company also recorded a ¥4.2 billion impairment loss on long-lived assets within the gaming segment. These shifts reflect a transition period as the organization rebalances its portfolio away from the exceptional highs of previous gaming hits toward long-term media infrastructure. Looking toward the 2023 fiscal year, the strategic focus shifts toward content investment and market share expansion. Management forecasts modest sales growth to ¥720 billion but anticipates a further contraction in operating income to between ¥40 billion and ¥50 billion. This outlook accounts for heavy investments in high-profile content, specifically the FIFA World Cup on ABEMA, which is intended to narrow media losses and solidify the platform's user base. While the Game Business remains a significant profit center, the overall corporate trajectory emphasizes scaling the advertisement and media segments to ensure diversified, sustainable growth within the Japanese digital economy.
FY2022 Consolidated Financial Results [Japanese GAAP] October 26, 2022 Listed company name: CyberAgent, Inc. (herein referred as the "Company") Listed stock exchange: TSE Prime Market Code No.: 4751 URL https://www.cyberagent.co.jp/en/ Representative: Representative Director CEO Susumu Fujita Inquiries: Senior Managing Executive Officer Go Nakayama Tel +81-3-5459-0202 Scheduled date of the Annual General Meeting of Shareholders: December 9, 2022 Scheduled date of dividend payment start: December 12, 2022 Scheduled filing date of the Annual Securities Report: December 9, 2022 Preparation of supplementary references regarding financial results: Yes Holding the briefing of financial results: Yes (live stream only) (Amounts less than ¥1 million are rounded down) 1. Consolidated Financial Results for the Year Ended September 30, 2022 (October 1, 2021 – September 30, 2022) (1) Consolidated Results of Operations
riefing of financial results: Yes (live stream only) (Amounts less than ¥1 million are rounded down) 1. Consolidated Financial Results for the Year Ended September 30, 2022 (October 1, 2021 – September 30, 2022) (1) Consolidated Results of Operations Net sales Operating Ordinary income Net income Comprehensive income attributable to income owners of the parent ¥ million % ¥ million % ¥ million % ¥ million % ¥ million % FY2022 710,575 6.6 69,114 (33.8) 69,464 (33.6) 24,219 (41.7) 35,963 (45.0) FY2021 666,460 39.3 104,381 208.1 104,694 209.2 41,553 528.8 65,376 224.2 Basic earnings Diluted earnings Return on Ordinary income Operating income per share per share shareholders' on total assets m
Basic earnings Diluted earnings Return on Ordinary income Operating income per share per share shareholders' on total assets margin equity ¥ ¥ % % % FY2022 47.89 45.33 17.7 18.1 9.7 FY2021 82.30 77.90 38.1 32.5 15.7 (Note) The Company conducted a four-for-one stock split of common stocks as of April 1, 2021. The "Basic earnings per share" and "Diluted earnings per share" are calculated assuming that the said stock split was conducted at the beginning of the previous consolidated fiscal year. (2) Consolidated Financial Position Total assets Equity Shareholders' Shareholders' Equity per share equity equity ratio
ion Total assets Equity Shareholders' Shareholders' Equity per share equity equity ratio ¥ million ¥ million ¥ million % ¥ FY2022 383,698 222,915 144,264 37.6 285.15 FY2021 382,578 194,145 128,883 33.7 254.98 (Note) The Company conducted a four-for-one stock split of common stocks as of April 1, 2021. The "Equity per share" is calculated assuming that the said stock split was conducted at the beginning of the previous consolidated fiscal year. (3) Consolidated Cash Flows Cash flows from Cash flows from Cash flows from Cash and cash operating activities investing activities financing activities equivalents at the end
ash operating activities investing activities financing activities equivalents at the end of the year ¥ million ¥million ¥ million ¥ million FY2022 17,946 (31,412) (2,801) 168,035 FY2021 109,609 (28,537) 374 184,082 2. Dividends Dividends per share Amount of Dividend ratio Dividend on 1Q 2Q 3Q Year- Annual dividends (Consolidated) equity End (Total) (Consolidated) ¥ ¥ ¥ ¥ ¥ ¥ million % % FY 202
End (Total) (Consolidated) ¥ ¥ ¥ ¥ ¥ ¥ million % % FY 2021 - 0.00 - 11.00 11.00 5,560 13.4 5.1 FY 2022 - 0.00 - 14.00 14.00 7,082 29.2 5.2 FY 2023 - 0.00 - 15.00 15.00 - (forecast) 3. Forecast of the Consolidated Results for the Fiscal Year Ending September 30, 2023 (October 1, 2021 – September 30, 2022) (% = Year-on-Year Change) Net income Basic Net sales Operating income Ordinary income attributable to earnings owne
CyberAgent, Inc. experienced a period of significant transition during the 2023 fiscal year, characterized by modest revenue growth alongside a sharp contraction in profitability. Consolidated net sales reached ¥720,207 million, representing a 1.4% year-over-year increase, yet operating income plummeted by 64.5% to ¥24,557 million. This decline was primarily driven by the Game Business, where profits fell 62.5% due to the natural lifecycle decline of high-margin titles. Simultaneously, the Internet Advertisement segment, while remaining the largest revenue contributor at ¥381,206 million, faced margin pressure from upfront investments in artificial intelligence. The Media Business emerged as a growth engine, with the ABEMA platform driving a 25.9% increase in segment sales and successfully narrowing its operational deficits. Despite the drop in net income attributable to owners—which fell from ¥24,219 million to ¥5,332 million—the company significantly strengthened its liquidity position. Cash and cash equivalents rose to ¥201,780 million, bolstered by over ¥53 billion in financing activities, including the issuance of convertible bonds and the acquisition of long-term bank loans. These strategic financial moves ensure a stable capital base for future expansion within the predominantly Japanese market, where over 90% of sales and assets are concentrated. Projections for the 2024 fiscal year indicate a strategic pivot toward recovery and renewed growth. Management forecasts net sales to reach ¥750 billion, supported by a pipeline of new game releases and the continued scaling of the Media segment. Operating income is expected to rebound by 22.2%, while net income is projected to increase by 50%. This outlook suggests that the heavy investment phase and the volatility in the gaming portfolio observed in 2023 are expected to stabilize, allowing for improved earnings per share and a more balanced contribution across the advertising, gaming, and media divisions.
CyberAgent, Inc. achieved exceptional financial growth during the 2021 fiscal year, characterized by record-breaking performance across its primary business segments. Consolidated net sales rose 39.3% to ¥666,460 million, while operating income experienced a dramatic surge of 208.1%, reaching ¥104,381 million. This momentum was largely fueled by the Game Business, which saw net sales increase by 68.6% and operating income jump 217.9% to ¥96,445 million, primarily due to the massive success of a major new title. The Internet Advertisement and Media businesses also contributed to these record highs, resulting in a nearly fivefold increase in net income to ¥66,671 million. The company’s financial position strengthened considerably over this period, with total assets expanding to ¥382,578 million and cash and cash equivalents rising to ¥184,082 million. Robust operating cash flows of ¥109,609 million provided the liquidity necessary to fund investment securities and subsidiary acquisitions while supporting a four-for-one stock split and an increased dividend of ¥11.00 per share. Profit attributable to shareholders rose from ¥6,608 million to ¥41,553 million, reflecting a significant leap in basic earnings per share from ¥13.10 to ¥82.30. Despite this historic profitability, management has opted to withhold financial forecasts for the 2022 fiscal year. This decision stems from the inherent volatility of the gaming industry, where the timing and performance of new launches remain difficult to predict. While the Game Business currently serves as the primary engine for growth and capital accumulation, the company remains focused on balancing these high-risk, high-reward cycles with the steady expansion of its advertising and media infrastructure to ensure long-term stability.
CyberAgent achieved significant financial growth during the second quarter of fiscal year 2022, characterized by a 23.0% year-on-year increase in net sales to ¥362,192 million and a 38.2% rise in operating income to ¥45,527 million. This performance was primarily anchored by the Game Business, which experienced a 58.2% surge in operating income driven by high-profile anniversary events for major titles. Simultaneously, the Internet Advertisement Business reached record-high performance levels, further stabilizing the company’s revenue base. While the Media segment, centered on the ABEMA platform, reported a loss of ¥5,804 million, this reflects a deliberate strategy of medium-to-long-term investment to scale the service. The geographic focus remains centered on the Japanese market, with results reflecting the implementation of new revenue recognition standards. These accounting changes shifted the timing of game item charge recognition to align with estimated usage periods, though the overall impact on consolidated sales and segment income remained minor. Despite the robust quarterly figures, management maintains a conservative outlook for the remainder of the fiscal year, anticipating a potential pullback in gaming profits as the immediate impact of major events stabilizes. The financial data reveals a stark contrast between the high-earning Game segment, which contributed ¥38,529 million in income, and the strategic losses incurred in the Media division. This disparity underscores a corporate strategy that utilizes the high margins of the gaming and advertising sectors to fund the expansion of digital media infrastructure. Overall, the results demonstrate a strong competitive position in the Japanese digital entertainment and advertising landscapes, supported by diversified revenue streams and a commitment to long-term platform growth.
CyberAgent achieved significant financial growth during the 2020 fiscal year, reporting net sales of ¥478.6 billion, a 5.5% increase over the previous year. The most notable performance metric was the surge in profit attributable to shareholders, which rose by 289.9% to reach ¥6.6 billion. This growth was underpinned by a robust financial position, with total assets expanding to ¥260.8 billion and a year-end cash balance of ¥102.4 billion, supported by ¥37 billion in cash flow from operating activities. The Game Business served as the primary engine for profitability, generating ¥30.3 billion in operating income through a mix of established smartphone titles and successful new releases. While the Media Business saw a 22.6% increase in sales, it continued to record an operating loss of ¥18.3 billion due to sustained strategic investments in the ABEMA streaming platform. The Internet Advertisement and Investment Development segments rounded out the core operations, contributing to a diversified revenue stream that capitalized on the expanding smartphone market. Looking toward the 2021 fiscal year, the company forecasts continued revenue expansion to ¥500 billion. Management intends to maintain its focus on the smartphone sector while treating ABEMA as a long-term strategic pillar for future growth. Although sales are expected to rise, operating income forecasts remain flexible, ranging from a slight decrease to a modest increase as the company balances immediate profitability from its gaming and advertising divisions against the high capital requirements of its media investments. Overall, the transition from FY2019 to FY2020 marked a substantial strengthening of per-share metrics, with basic earnings per share climbing from ¥13.45 to ¥52.41.