FinancialCyberAgent
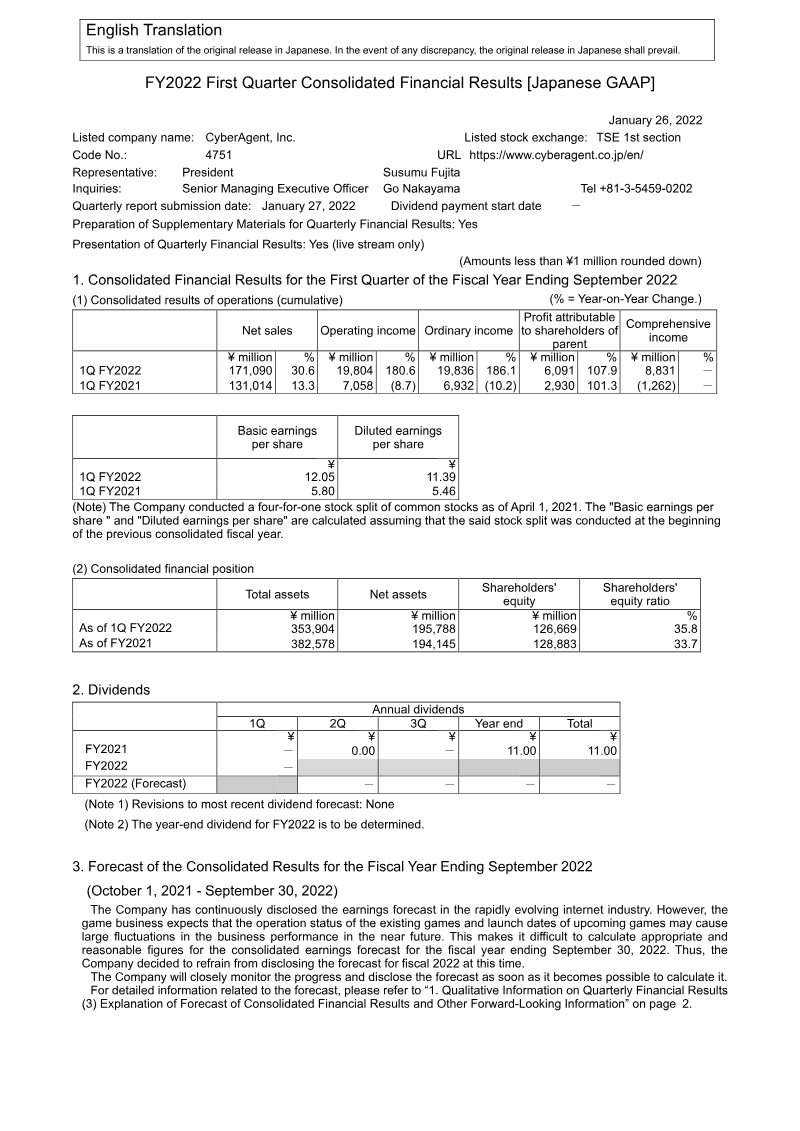
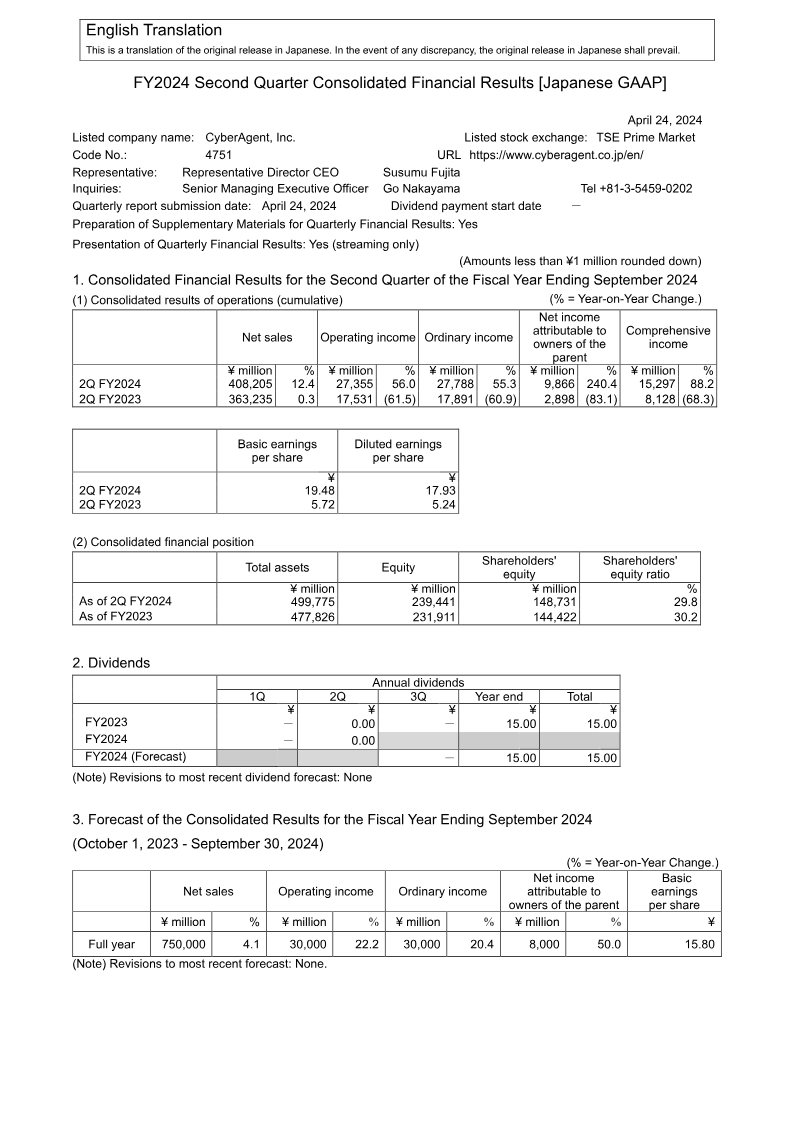
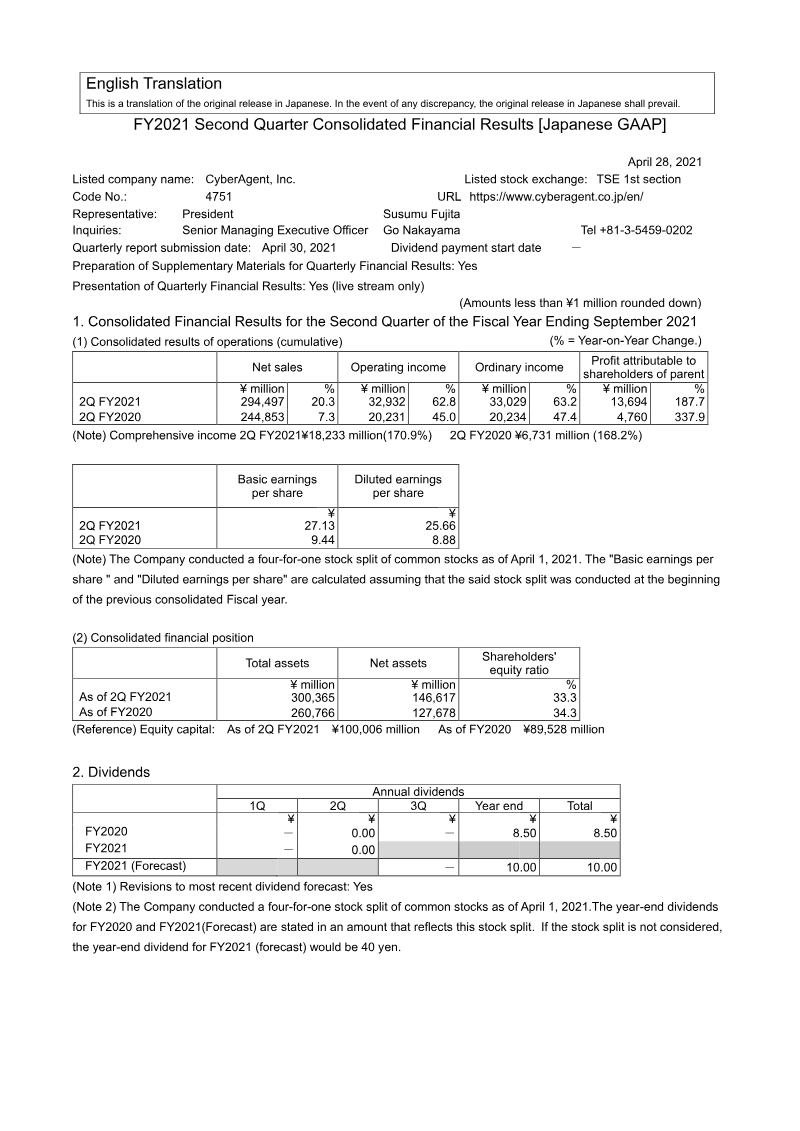
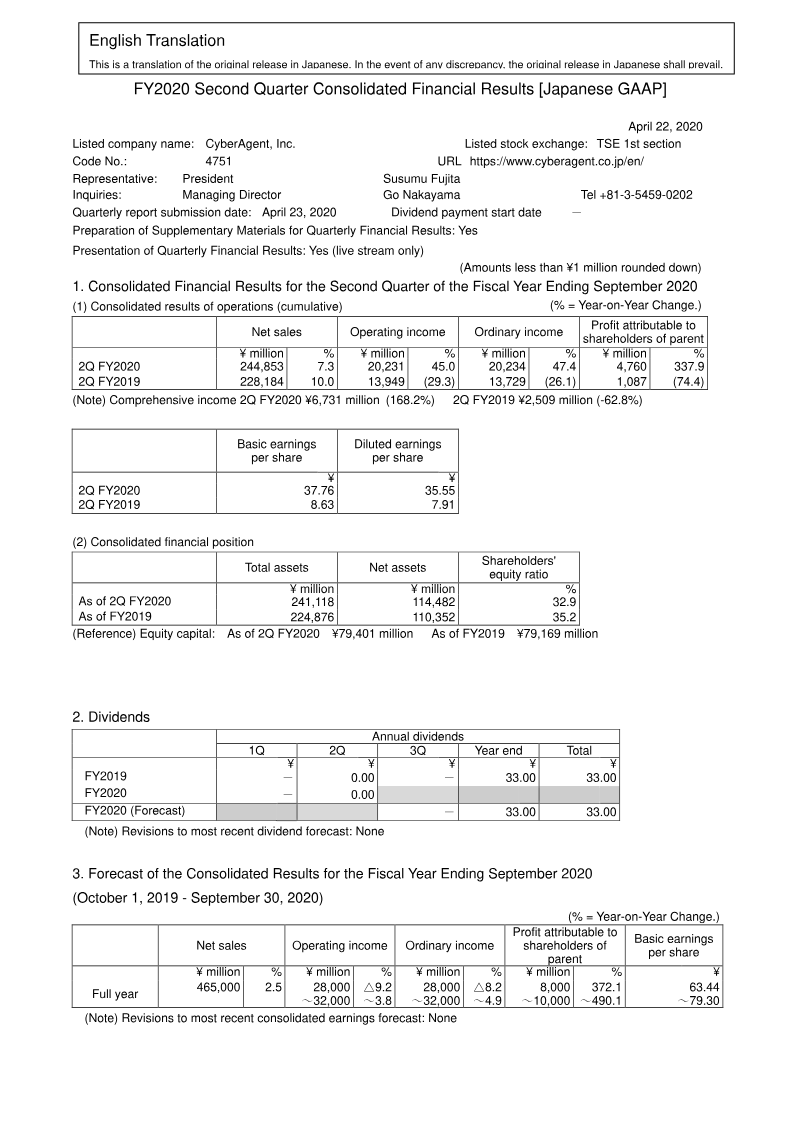
FY2022 Second Quarter Consolidated Financial Results (Japanese GAAP)
1 Apr 202210 pages~21 min full read
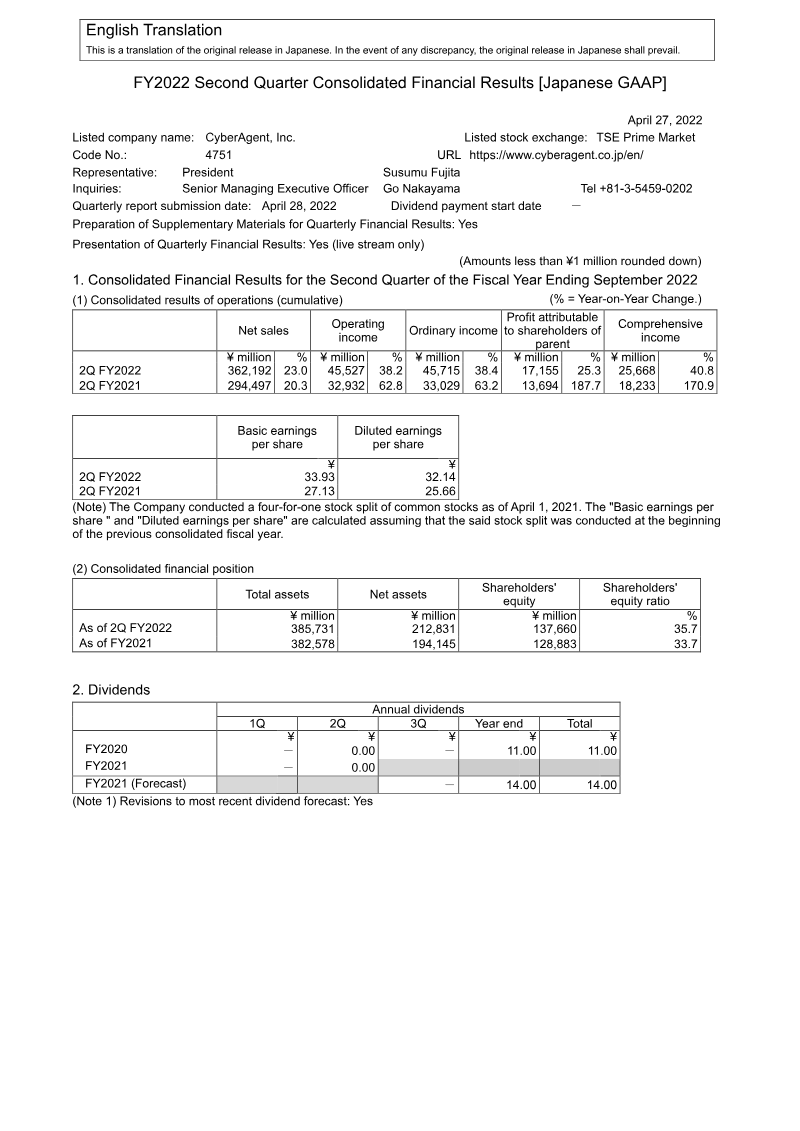
CyberAgent reported strong Q2 FY2022 growth with net sales reaching ¥362,192 million, a 23.0% year-on-year increase, and operating income rising 38.2% to ¥45,527 million.
See it on page 2The Game Business served as the primary profit driver, generating ¥38,529 million in operating income, a 58.2% surge fueled by high-profile anniversary events.
See it on page 4The Internet Advertisement Business achieved record-high performance levels, serving as a stable revenue pillar alongside the high-margin gaming segment.
See it on page 4The Media segment, anchored by the ABEMA platform, reported a strategic operating loss of ¥5,804 million as part of a long-term investment plan to scale the service.
See it on page 4Management maintains a conservative outlook for the remainder of the fiscal year, expecting gaming profits to normalize following the conclusion of major title events.
See it on page 5New revenue recognition standards were implemented to align game item charges with estimated usage periods, though the overall impact on consolidated financial results remained minor.
See it on page 9CyberAgent achieved significant financial growth during the second quarter of fiscal year 2022, characterized by a 23.0% year-on-year increase in net sales to ¥362,192 million and a 38.2% rise in operating income to ¥45,527 million. This performance was primarily anchored by the Game Business, which experienced a 58.2% surge in operating income driven by high-profile anniversary events for major titles. Simultaneously, the Internet Advertisement Business reached record-high performance levels, further stabilizing the company’s revenue base. While the Media segment, centered on the ABEMA platform, reported a loss of ¥5,804 million, this reflects a deliberate strategy of medium-to-long-term investment to scale the service.
The geographic focus remains centered on the Japanese market, with results reflecting the implementation of new revenue recognition standards. These accounting changes shifted the timing of game item charge recognition to align with estimated usage periods, though the overall impact on consolidated sales and segment income remained minor. Despite the robust quarterly figures, management maintains a conservative outlook for the remainder of the fiscal year, anticipating a potential pullback in gaming profits as the immediate impact of major events stabilizes.
The financial data reveals a stark contrast between the high-earning Game segment, which contributed ¥38,529 million in income, and the strategic losses incurred in the Media division. This disparity underscores a corporate strategy that utilizes the high margins of the gaming and advertising sectors to fund the expansion of digital media infrastructure. Overall, the results demonstrate a strong competitive position in the Japanese digital entertainment and advertising landscapes, supported by diversified revenue streams and a commitment to long-term platform growth.