Related Documents
Financial
Financial Results: Fiscal Year Ended December 31, 2025 (Japan)
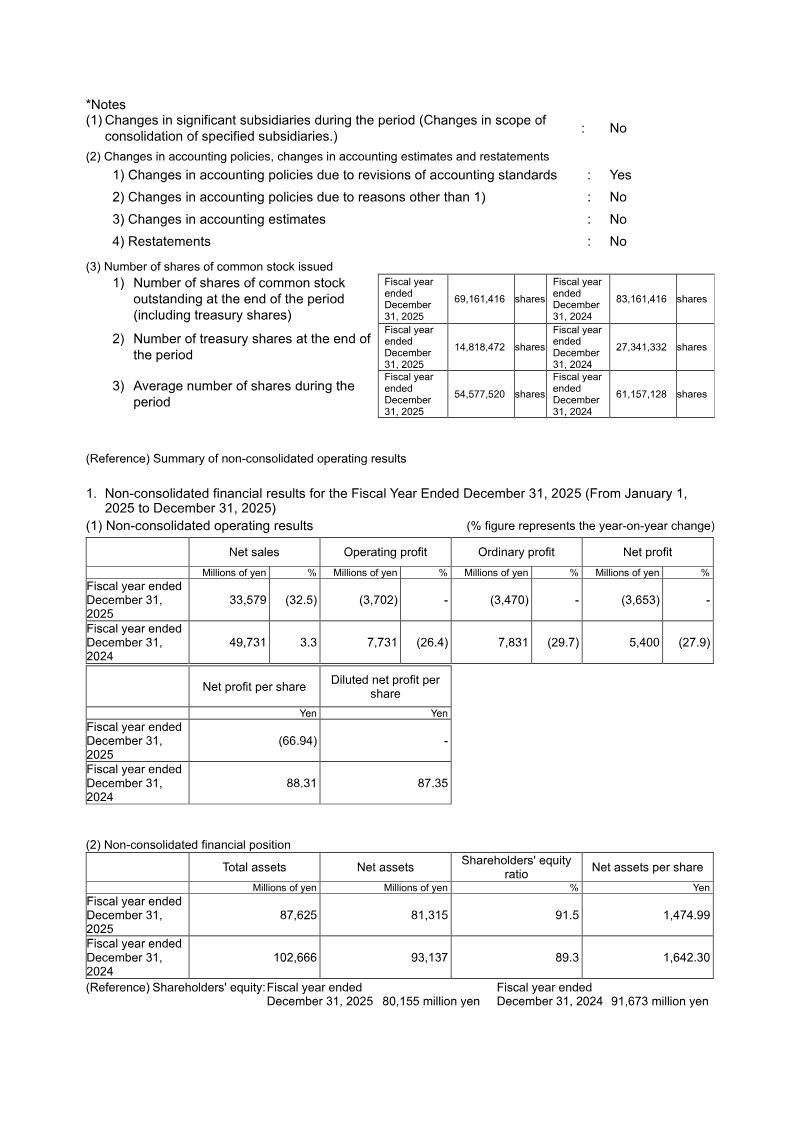
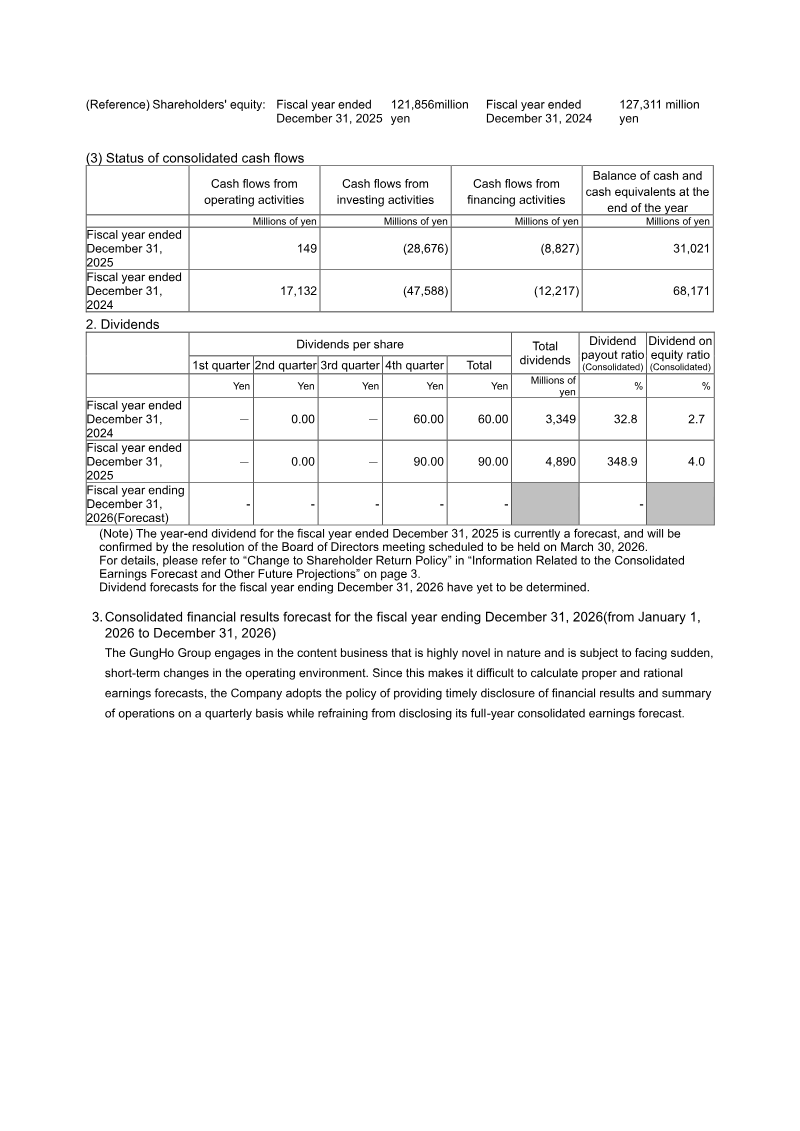
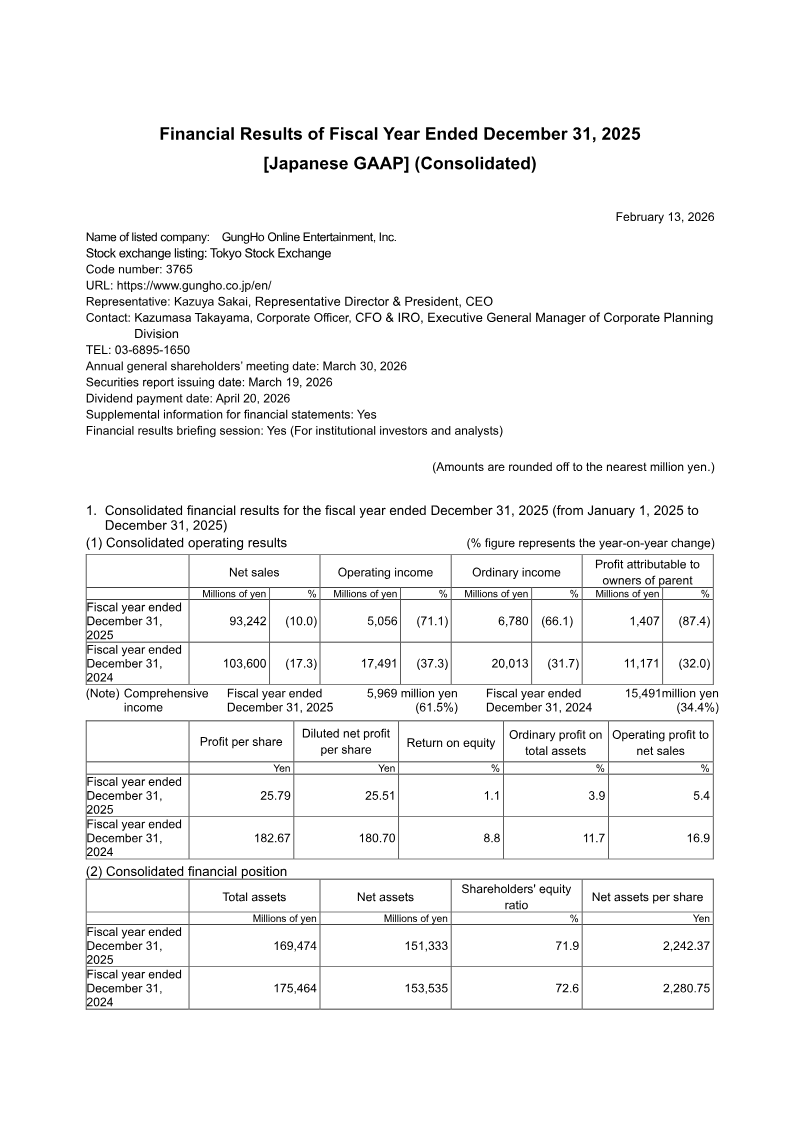
GungHo Online Entertainment reported a 10 % decline in consolidated net sales to ¥93,242 million for fiscal year 2025, with operating profit falling 71.1 % to ¥5,056 million and attributable profit dropping 87.4 % to ¥1,407 million. The downturn is attributed to higher development costs and a flat mobile‑gaming market, while total assets increased to ¥169,474 million. Cash balances fell sharply to ¥31,021 million due to significant investing and financing outflows, notably treasury‑share repurchases. In response, the company announced a revised shareholder‑return policy that targets a 30 %+ dividend payout ratio and sets an ordinary dividend of ¥90.00 per share for FY 2025, signalling a shift toward more proactive profit distribution. The new policy adopts a dual approach of stable dividends and flexible share buybacks. It aims for a 4 % dividend‑on‑equity (DOE) and a consolidated payout ratio of at least 50 %, while buybacks will be executed as capital‑efficiency measures based on board decisions and market conditions. This change takes effect from the fiscal year ending December 31, 2025. Profitability metrics deteriorated sharply: net profit per share fell from ¥182.67 to ¥25.79, and fully‑diluted net profit per share declined similarly; net assets per share decreased modestly from ¥2,280.75 to ¥2,242.37. Net sales remained concentrated in Japan (¥31.8 bn) and Asia, with Indonesia now reported separately at ¥3.6 bn after reclassification from the broader “Asia” category. The company also approved a 2026 treasury‑share repurchase program of up to ¥5 bn for 2.1 million shares, followed by a cancellation of 16 million shares to improve capital efficiency.
GungHo Online EntertainmentFeb 2026
Financial
Summary of Supplementary Explanations Q&A at the FY2026 Second Quarter GREE Holdings Results Briefing
GREE Holdings, Inc. outlines its strategic direction and financial outlook following the second quarter of fiscal year 2026, focusing on a structural shift away from the volatile Game Business toward more stable, continuous growth segments. Despite a downward revision to the full-year earnings outlook for FY2026 due to the softening performance of existing game titles, the long-term medium-term targets for FY2028 remain unchanged. This stability is supported by the steady expansion of the IP, VTuber, and DX Business segments, which are intended to reduce the company's reliance on hit-driven gaming revenue. The IP Business is diversifying through the Anime Business, specifically by adapting invested anime titles into games. To strengthen this pipeline, there is a strategic goal to acquire in-house anime production capabilities or pursue M&A within the next two to three years. This move aims to provide greater control over production quality and timing, which are viewed as essential for creating popular intellectual property. Simultaneously, the VTuber Business is expanding its monetization beyond traditional gifting. Pilot projects on the REALITY platform are testing merchandise sales and event-based revenue for both in-house talent and independent streamers, alongside new marketing solutions for corporate clients. In the DX Business segment, the focus remains on high-value consulting for end-user-facing services and entertainment. While generative AI and automated agents are expected to impact routine maintenance and labor costs in the broader industry, the specialized nature of creating fan-driven content is seen as resilient to automation. Consequently, technological advances in AI are not expected to negatively impact the DX segment in the near term. Overall, the strategy emphasizes leveraging human creativity and platform diversification to ensure stable, long-term earnings growth across the global entertainment and digital transformation markets.
GREEFeb 2026
Financial
Q&A for 1Q FY2026 Operating Results Briefing
The first-quarter financial results for the fiscal year ending in 2026 reflect a strategic transition period for COLOPL, characterized by a lack of new releases and a focus on stabilizing existing mobile operations. Despite an anticipated decline in sales, the performance of established titles like Dragon Quest Walk and Alice Gear Aegis, alongside contributions from group companies, resulted in what leadership describes as solid progress. The company is currently navigating a challenging mobile market where the barrier to entry for new hits is rising, prompting a shift toward two primary development pillars: AI-powered titles and location-based games paired with globally recognized intellectual properties. Financial performance in the first quarter was impacted by extraordinary losses related to special severance payments from a Career Transition Support Program. While headcount has decreased, the resulting reduction in personnel expenses is not expected to materialize until the second quarter of 2026. Regarding long-term operations for legacy titles such as Shironeko Project, the strategy emphasizes user satisfaction and game-balance adjustments over aggressive cost-cutting to ensure longevity. The company is also diversifying its platform strategy beyond its core mobile business to include PC and console gaming. This is exemplified by the release of Kazuma Kaneko’s Tsukuyomi on Nintendo Switch, a title that originated as an exploration of generative AI in gaming. By establishing a new genre termed "Generative Games," the company aims to leverage AI-generated assets and systems across multiple hardware formats. Moving forward, the overarching goal remains achieving a "Global Top 20" position by integrating advanced technology with high-profile IPs and expanding the reach of its proprietary location-based gaming expertise.
COLOPLFeb 2026
Financial
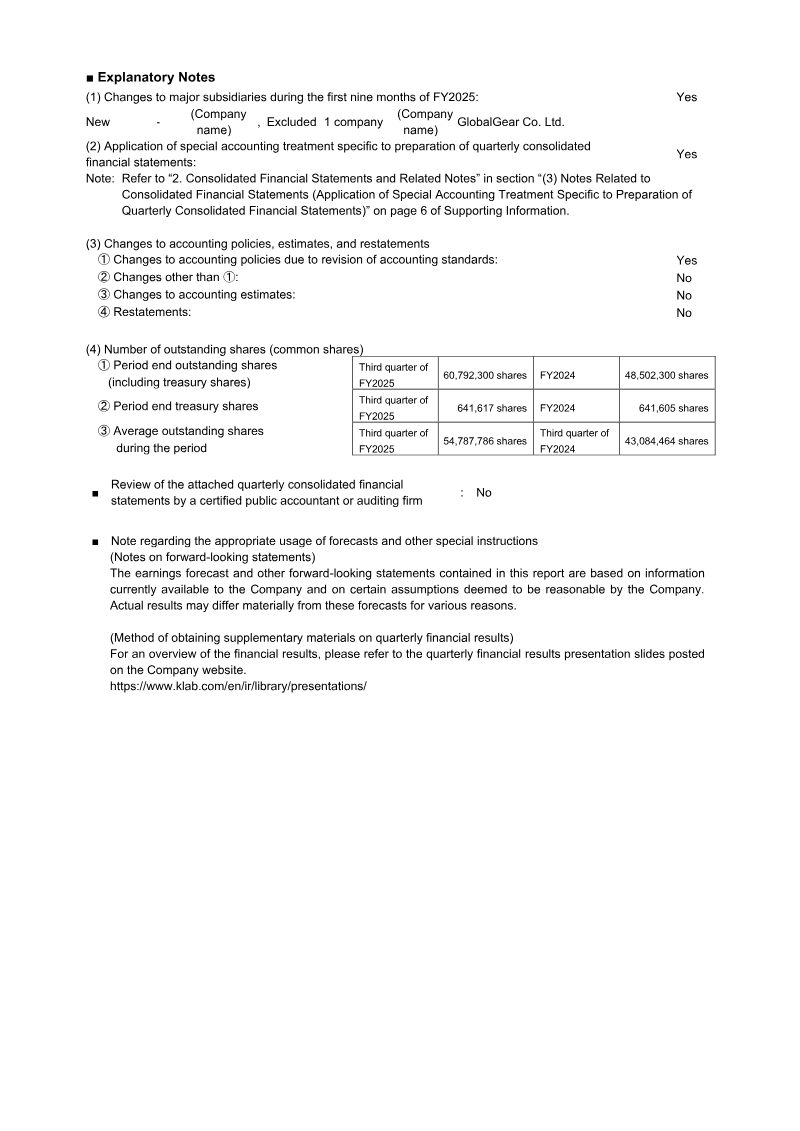
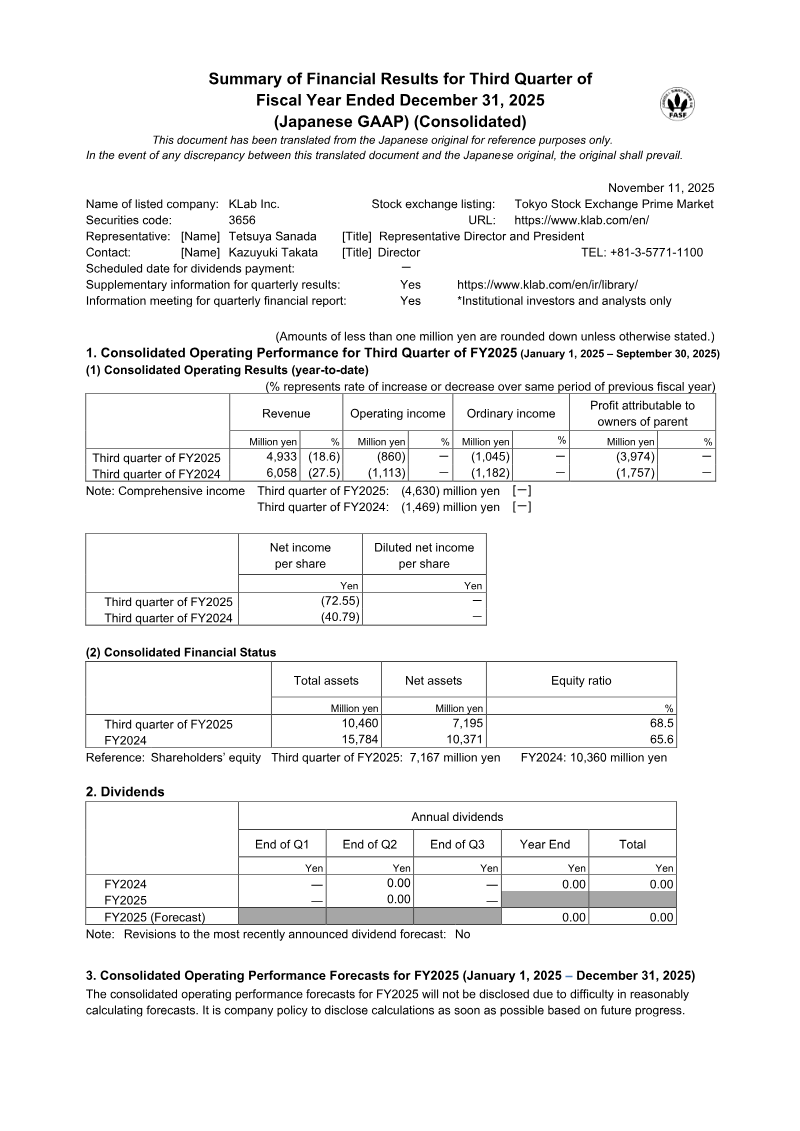
Summary of Financial Results for Third Quarter of Fiscal Year Ended December 31, 2025
KLab Inc. experienced a significant downturn during the third quarter of fiscal year 2025, characterized by an 18.6% year-over-year revenue decline to ¥4.93 billion. This contraction was primarily driven by weakening performance in established titles such as Captain Tsubasa: Dream Team and a general decrease in income from paid users within the game business. Despite aggressive cost-cutting measures and a ¥1.57 billion gain from the sale of investment securities, the company recorded a substantial net loss of ¥3.97 billion. This loss was largely precipitated by a massive ¥4.42 billion impairment charge on software assets related to EA SPORTS FC™ TACTICAL and a reduction in goodwill following the divestment of GlobalGear Co. Ltd. The financial strain resulted in a decrease of over ¥3.1 billion in total net assets, though the company mitigated some impact by raising approximately ¥719 million through the exercise of stock acquisition rights. While four consecutive years of operating deficits have prompted scrutiny regarding the company’s status as a going concern, management asserts that no material uncertainty exists. This confidence is based on steady progress with major intellectual properties, including Dragon Quest and My Hero Academia, alongside a strategic pivot toward generative AI and blockchain ventures to diversify future revenue streams. Operating within the Japanese market during a period of rapid industry volatility, the company has withheld future performance forecasts. The current strategy focuses on maintaining liquidity through strict cost controls and asset sales while transitioning the business model to leverage emerging technologies. Despite the current net losses and the impairment of software in progress, the segment profit of ¥592 million suggests that core operations remain functional as the group attempts to stabilize its capital position and return to long-term profitability.
KLabNov 2025