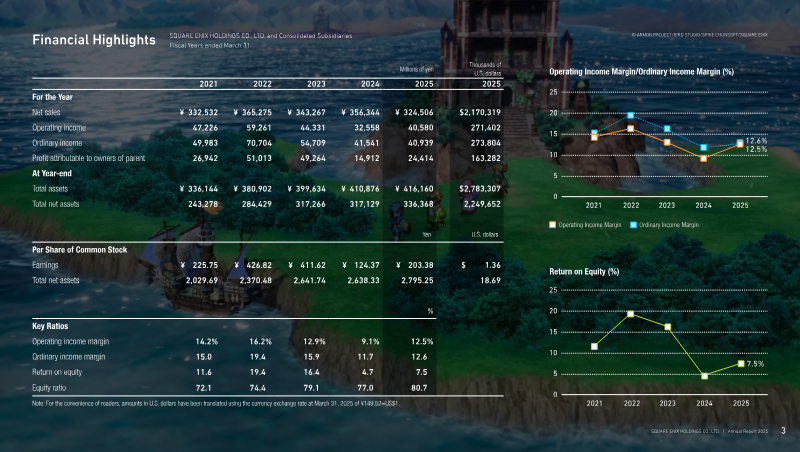
Square Enix experienced significant earnings volatility between 2021 and 2025, with net sales peaking at ¥365.3 billion in 2022 before falling to ¥324.5 billion in 2025.
Operating income declined sharply from a 2022 peak of ¥59.3 billion to ¥32.6 billion in 2024, with a projected recovery to ¥40.6 billion in 2025.
Profit attributable to owners of the parent dropped significantly from its 2022 high of ¥51.0 billion to a projected ¥24.4 billion for the 2025 fiscal year.
Return on equity (ROE) has seen a consistent downward trend, falling from a peak of 19.4% in 2022 to a projected 7.5% in 2025.
Operating income margins contracted from 16.2% in 2022 to 9.1% in 2024, reflecting the company's struggle to maintain profitability during this period.
Despite earnings volatility, the company's capital structure strengthened, with the equity ratio improving from 72.1% in 2021 to a projected 80.7% in 2025.
Total assets demonstrated steady growth over the period, increasing from ¥336.1 billion in 2021 to ¥410.9 billion by 2024.
Financial highlights for Square Enix Holdings and its consolidated subsidiaries cover fiscal years ending March 31 from 2021 through 2025, with data presented in Japanese yen and converted to U.S. dollars using the March 31, 2025 exchange rate of ¥149.52 per dollar. Net sales rose from ¥332.5 billion in 2021 to a peak of ¥365.3 billion in 2022, then declined to ¥343.3 billion in 2023 and rebounded slightly to ¥356.3 billion in 2024 before falling again to ¥324.5 billion in 2025. Operating income followed a similar pattern, peaking at ¥59.3 billion in 2022 and dropping to ¥32.6 billion in 2024, with a projected recovery to ¥40.6 billion in 2025. Ordinary income mirrored operating results, with a high of ¥70.7 billion in 2022 and a projected ¥40.9 billion in 2025.
Profit attributable to owners of parent fluctuated, reaching ¥51.0 billion in 2022 and projected to be ¥24.4 billion in 2025. Total assets increased steadily from ¥336.1 billion in 2021 to ¥410.9 billion in 2024, while total net assets grew from ¥243.3 billion to ¥336.4 billion over the same period. Return on equity (ROE) peaked at 19.4 % in 2022, declined to 15.9 % in 2023, and is projected to fall further to 7.5 % in 2025.
Operating income margins ranged from a high of 16.2 % in 2022 to a low of 9.1 % in 2024, with ordinary income margins fluctuating between 10.0 % and 12.6 %. Equity ratios improved from 72.1 % in 2021 to a projected 80.7 % in 2025, indicating strengthening capital structure. These figures illustrate a period of revenue growth followed by volatility in profitability and a gradual tightening of equity ratios as the company navigates market conditions.