FinancialAkatsuki
Consolidated Financial Results for the Fiscal Year Ended March 31, 2025: Japan
19 pages~31 min full read
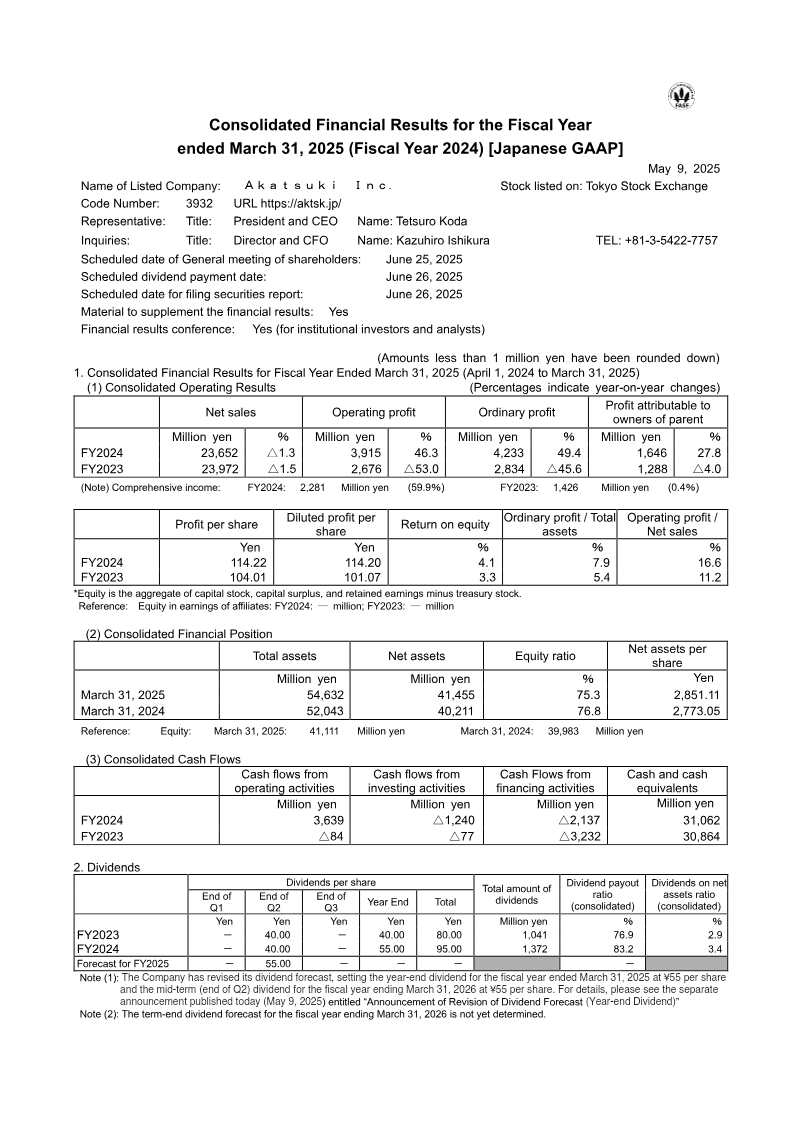
Akatsuki Inc. reported its consolidated financial results for the fiscal year ended March 31, 2025, prepared in accordance with Japanese GAAP.
See it on page 1The company is publicly traded on the Tokyo Stock Exchange under the ticker symbol 3932.
See it on page 1Tetsuro Koda serves as the President and CEO of the organization.
See it on page 1Consolidated Financial Results for the Fiscal Year ended March 31, 2025 (Fiscal Year 2024 ) [Japanese GAAP] Name of Listed Company: Akatsuki Inc. Stock listed on: Tokyo Stock Exchange Code Number: 3932 URL https://aktsk.jp/ Representative: Title: President and CEO Name: Tetsuro Koda In...