FinancialNagase Brothers
Consolidated Financial Results: Japan, Year Ended March 31, 2025
1 May 20254 pages~6 min full read
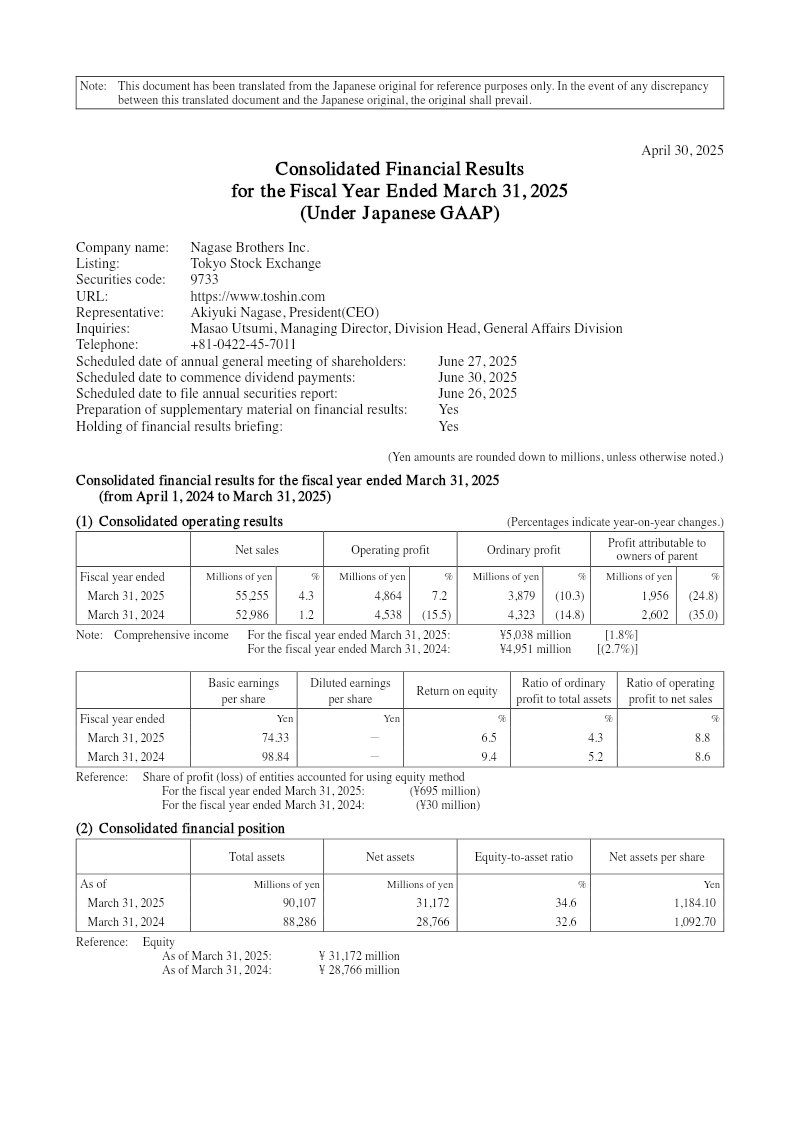
Nagase Brothers Inc. reported a 4.3% increase in net sales to 55,255 million yen for the fiscal year ended March 31, 2025, alongside a 7.2% rise in operating profit to 4,864 million yen.
See it on page 1Profit attributable to owners of the parent fell by 24.8% to 1,956 million yen, while ordinary profit declined by 10.3% to 3,879 million yen.
See it on page 4The company projects a strong recovery for the fiscal year ending March 31, 2026, forecasting a 17.2% increase in net sales to 64,764 million yen and a 95.0% surge in profit attributable to owners of the parent to 3,815 million yen.
See it on page 4Financial stability improved as the equity-to-asset ratio rose to 34.6% from 32.6% in the previous year, with total assets reaching 90,107 million yen.
See it on page 3Despite the decline in net income, the company maintained a consistent annual dividend of 100 yen per share.
See it on page 2Operating activities generated 8,183 million yen in cash flow, while investing and financing activities resulted in outflows of 7,763 million yen and 8,314 million yen, respectively.
See it on page 2Nagase Brothers Inc. reported its consolidated financial results for the fiscal year ended March 31, 2025, reflecting a period of growth in top-line revenue alongside a contraction in bottom-line profitability. The company achieved net sales of 55,255 million yen, representing a 4.3% increase over the previous fiscal year. Operating profit also saw positive momentum, rising 7.2% to 4,864 million yen. However, profit attributable to owners of the parent declined by 24.8% to 1,956 million yen, and ordinary profit fell by 10.3% to 3,879 million yen, resulting in basic earnings per share of 74.33 yen.
The company’s financial position strengthened during the period, with total assets reaching 90,107 million yen and net assets rising to 31,172 million yen. The equity-to-asset ratio improved to 34.6%, up from 32.6% in the prior year. Cash flow dynamics shifted significantly, with operating activities generating 8,183 million yen, while investing and financing activities saw outflows of 7,763 million yen and 8,314 million yen, respectively. The company maintained a consistent annual dividend of 100 yen per share, despite the decline in net income.
Looking ahead to the fiscal year ending March 31, 2026, the company projects a robust recovery and expansion. Forecasts indicate a 17.2% increase in net sales to 64,764 million yen and a substantial 95.0% growth in profit attributable to owners of the parent, reaching 3,815 million yen. These projections are based on information available as of April 2025 and remain subject to change based on future market conditions. The reporting period covers the Japanese fiscal year, and the results were prepared in accordance with Japanese GAAP.