Related Documents

Report
Video Game Market Update: Q1 2026
This report is provided for general information and discussion purposes only and is intended solely for subscribers. It does not constitute a financial promotion, investment advice, or a recommendation to engage in any investment activity. The content reflects the views of the authors at the time of publication and may be subject to change without notice.
Aream & CoApr 2026
Report
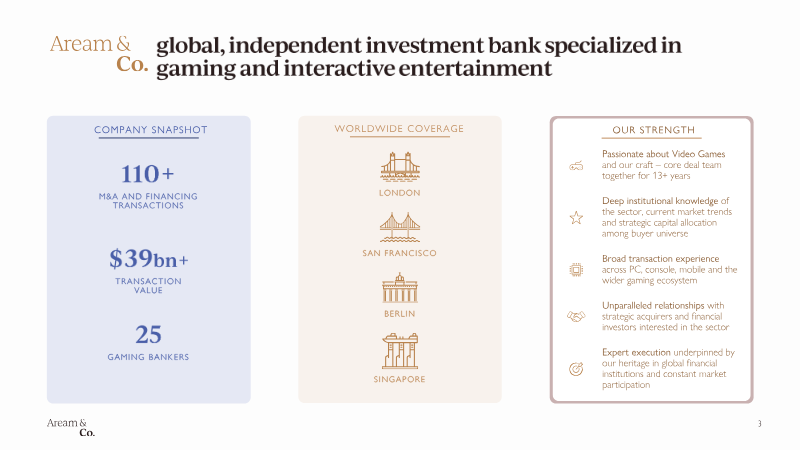
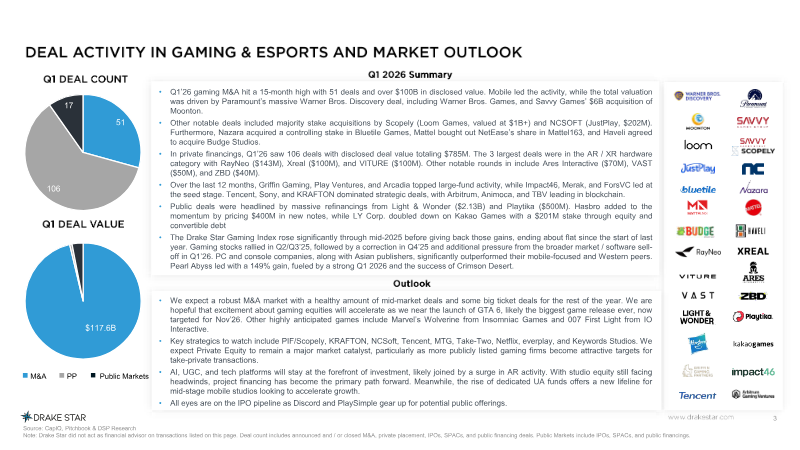
Global Gaming Report Q1 2026
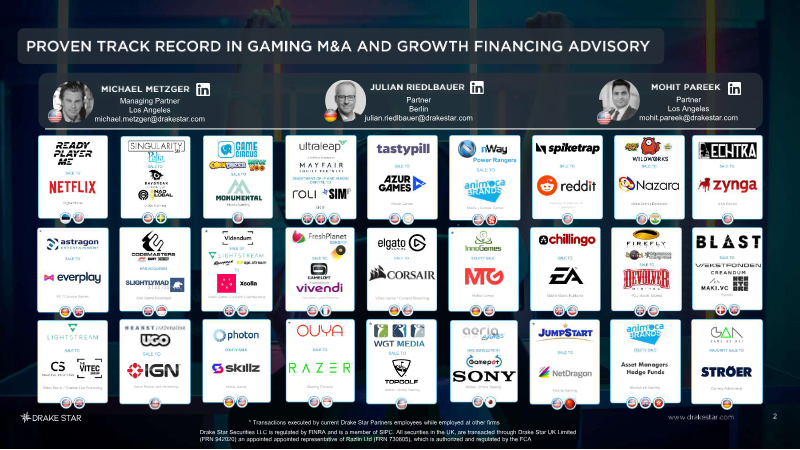
LOS ANGELES | SAN FRANCISCO | NEW YORK | LONDON | PARIS | MUNICH | BERLIN | DUBAI PROVEN TRACK RECORD IN GAMING M&A AND GROWTH FINANCING ADVISORY PROVEN TRACK RECORD IN GAMING M&A AND GROWTH FINANCING ADVISORY MICHAEL METZGER JULIAN RIEDLBAUER Linkedin - Free social media icons MOHIT PAREEK Linkedin - Free social media icons MICHAEL METZGER JULIAN RIEDLBAUER ...
Drake Star PartnersApr 2026

Financial
Q4 2025 Interim Report
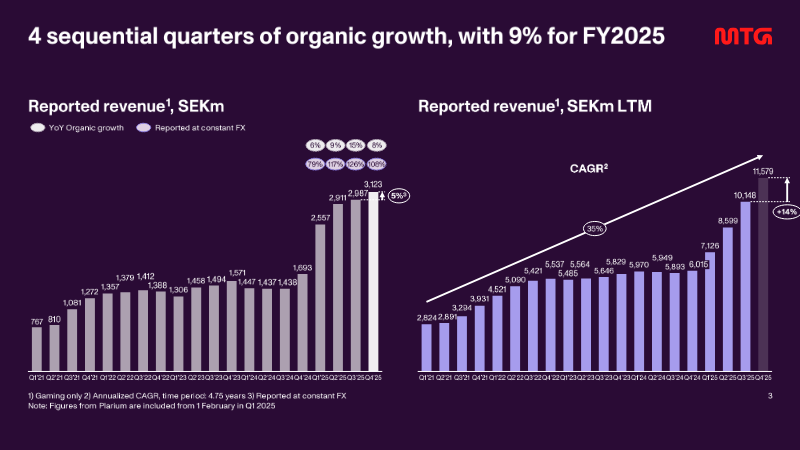
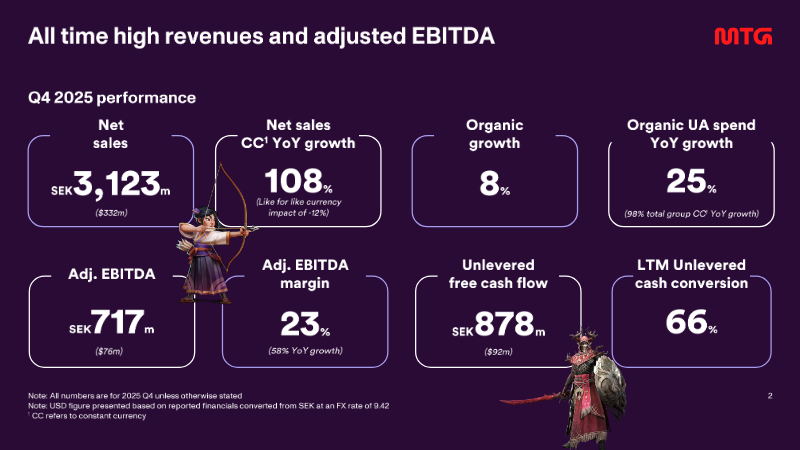
The interim filing presents the fourth‑quarter 2025 financial results for a midcore‑casual gaming group, emphasizing a record‑setting revenue run and the successful execution of a transformation agenda that includes the integration of the Plarium acquisition and the rollout of a new district structure in early 2026. Revenue reached SEK 3,123 million, reflecting 108 % organic growth year‑on‑year and a 25 % increase on a constant‑currency basis, while adjusted EBITDA rose to SEK 717 million, delivering a 23 % margin that matches the full‑year figure. Unlevered free cash flow amounted to SEK 878 million, with a cash‑conversion rate of 66 % and a leverage ratio of five times EBITDA, underscoring robust liquidity and disciplined capital management. User‑acquisition spending accelerated, representing 38 % of quarterly revenue—up from 37 % in the prior quarter—and grew 76 % on a reported basis, driven by heightened investment in original studios, new casual titles, and the racing franchise. The direct‑to‑consumer channel expanded by 600 basis points to 32 % of total revenue, reflecting a strategic shift toward higher‑margin in‑app purchases. Across the fiscal year, the company posted a 9 % organic revenue increase, with word‑games, racing, and RAID franchises delivering the strongest quarter‑end performance. Operating cash flow for the quarter stood at SEK 840 million, while adjusted net income was SEK 1,390 million, translating to an adjusted EPS of SEK 11.33. The financial outcomes exceed guidance and position the firm to meet its medium‑term outlook, with a pre‑IPO study for PlaySimple concluded and the midcore transformation progressing as planned.
Modern Times GroupFeb 2026
Report
Global Gaming Report Q3 2025
The third quarter of 2025 underscores the continued premium placed on hardware and platform players within the global gaming ecosystem, as investors assign a wide spectrum of valuation multiples that reflect divergent growth narratives and market positioning. Enterprise‑valued firms such as Dell and HP trade near a 1‑times EV/EBITDA ratio, indicating modest expectations for earnings expansion, while high‑growth entities like Nvidia and AppLovin command multiples exceeding 25‑times, with the latter reaching 42.8‑times, highlighting the market’s appetite for cutting‑edge processing power and mobile advertising integration. Across the board, most companies in the segment posted double‑digit year‑over‑year revenue increases, confirming robust demand for both traditional PC hardware and emerging cloud‑based gaming services. Equity performance further illustrates the split between established hardware manufacturers and platform‑centric developers. Roblox delivered the strongest year‑to‑date appreciation at 136.9%, driven by expanding user engagement and monetization initiatives, while Unity recorded a 77‑percent gain, reflecting its pivotal role in cross‑platform development tools and the growing adoption of real‑time 3D content. These returns contrast sharply with the more muted trajectories of hardware‑only firms, suggesting that investors are rewarding firms that blend hardware capabilities with scalable software ecosystems. Overall, the data portray a gaming market in which valuation is increasingly tied to the ability to integrate hardware performance with platform services, and where growth‑oriented companies enjoy markedly higher multiples and stock appreciation. The findings span a global landscape, covering major North American, European, and Asian players, and focus on the quarter ending September 2025, offering a snapshot of valuation dynamics and performance trends that are likely to shape strategic investment decisions throughout the remainder of the year.
Drake Star PartnersSept 2025