Skip to main content
Game Industry
Library
Ask AI
Cited answers
Search…
⌘
K
Library
Search
TL;DR
Connect your AI
PRO
Browse
Topics
Collections
Writers
Glossary highlights
Theme
Help & info
Subscribe
Game Industry
Library
Library
TL;DR
Search
Ask AI
Saved
Collections
Asia-Pacific
Asia-Pacific
Japan, China, Korea, Southeast Asia, India and Australia.
321 documents
Reports
Presentations
Whitepapers
Newest first
Oldest first
Title A–Z
Title Z–A
Bushiroad
Report
Financial Report for First Quarter of Fiscal 2026: Japan
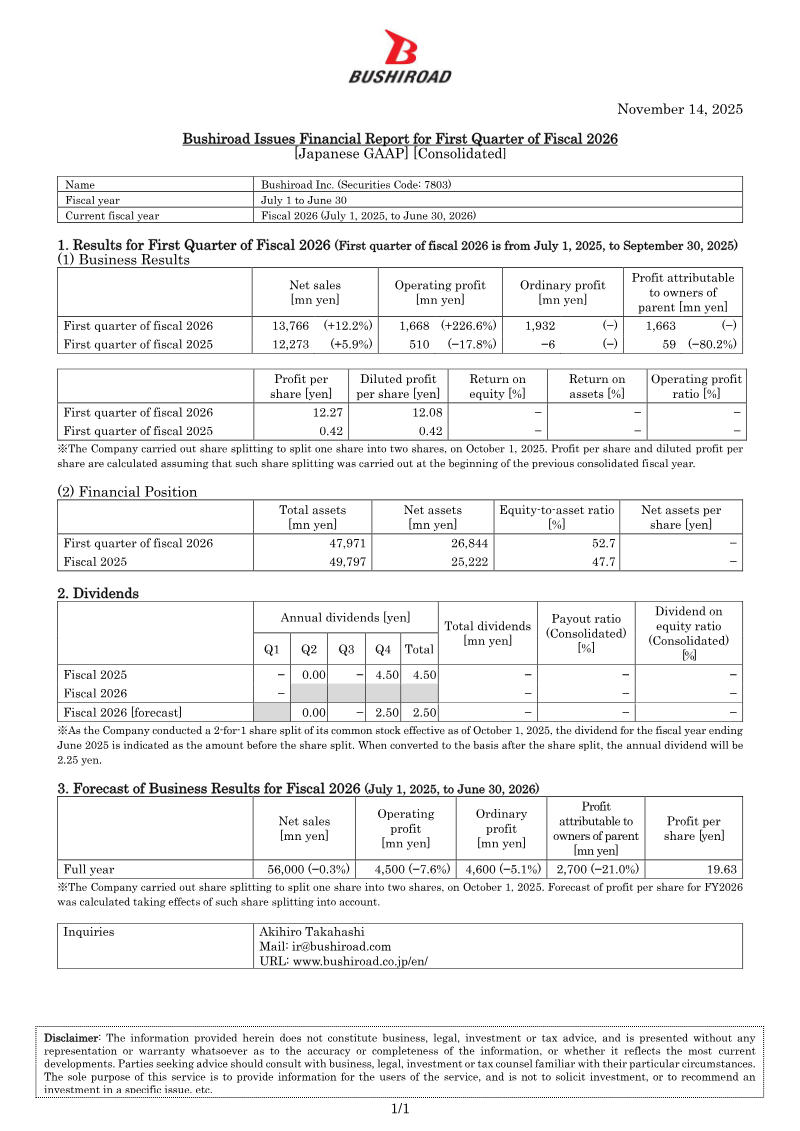
Bushiroad Inc., a Japanese entertainment company, reported first‑quarter fiscal 2026 results for the period July 1 to September 30, 2025. Net sales rose 12.2% year‑over‑year to ¥13,766 million, driven by stronger performance across its core card game and event‑ticket businesses. Operating profit surged 226.6% to ¥1,668 million, while ordinary profit reached ¥1,932 million, a reversal from the previous year’s operating loss of ¥510 million. Profit attributable to owners of parent companies stood at ¥1,663 million, up from a loss of ¥59 million in the same quarter of fiscal 2025. Earnings per share, adjusted for a 2‑for‑1 stock split effective October 1, 2025, climbed to ¥12.27. Total assets for the quarter were ¥47,971 million, with net assets of ¥26,844 million, reflecting an equity‑to‑asset ratio increase to 52.7% from 47.7% in fiscal 2025. Net assets per share were not disclosed due to the recent split. Dividend policy for fiscal 2025 showed a single payout of ¥4.50 per share in Q3, with no dividends announced for fiscal 2026 yet; a forecast indicates a potential ¥2.50 per share in Q4 after the split. The company projects full‑year 2026 net sales of ¥56,000 million (a slight decline of 0.3% from the prior year), operating profit of ¥4,500 million (down 7.6%), and ordinary profit of ¥4,600 million (down 5.1%). Forecasted earnings per share for FY2026 are ¥19.63, reflecting the impact of the share split. These figures illustrate a rebound in profitability after a challenging prior year, with modest sales growth and an improving capital structure. The company’s guidance signals continued pressure on operating margins, likely due to rising content development costs and competitive market dynamics within Japan’s entertainment sector.
mixi
Report
Consolidated Balance Sheets: FY2012-FY2013
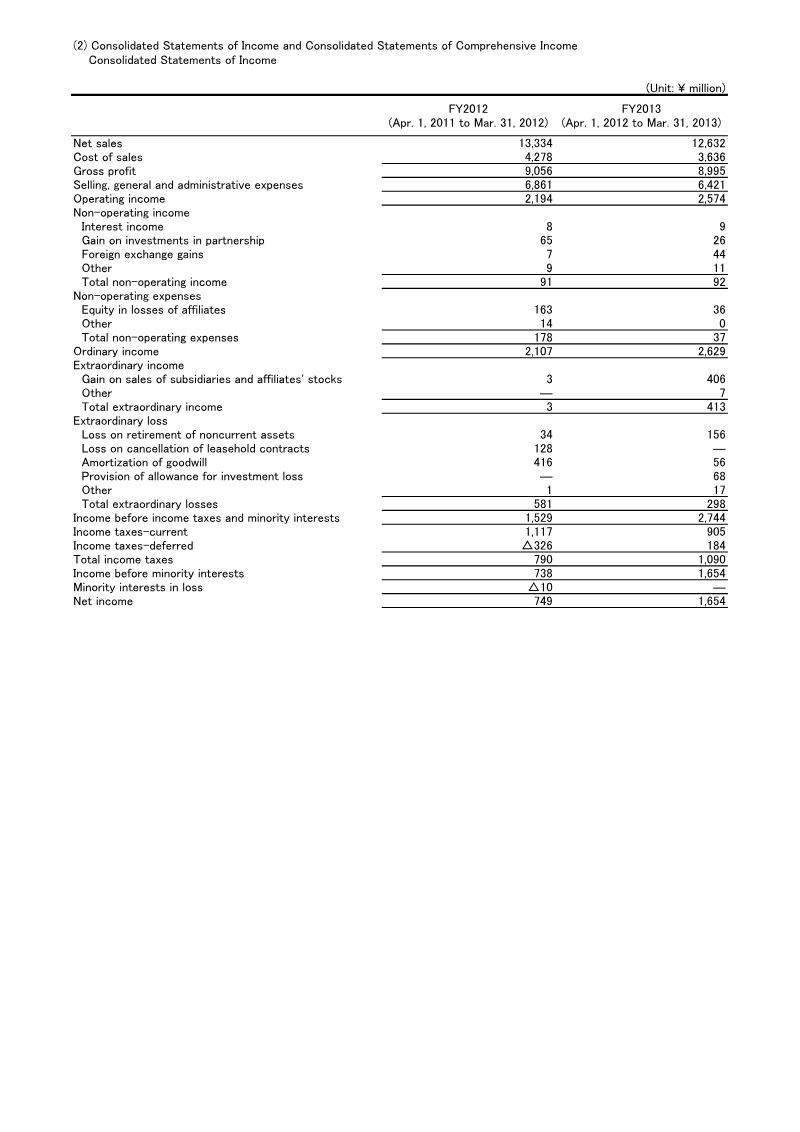
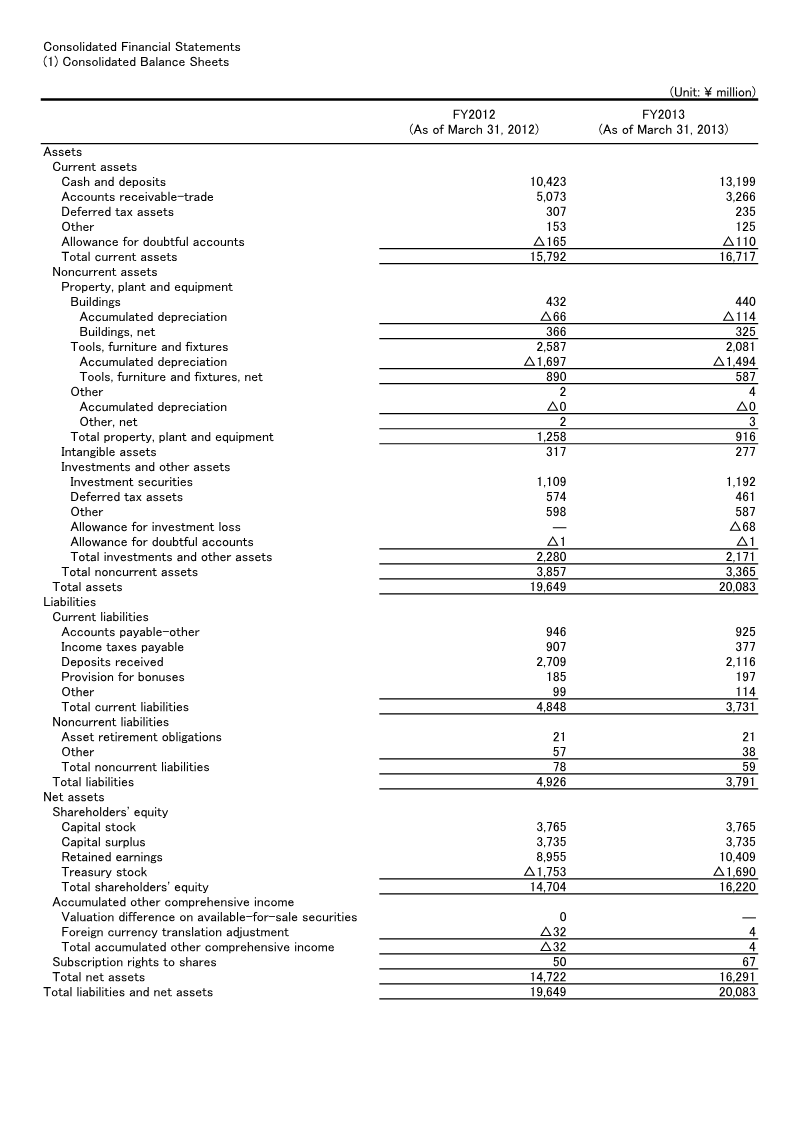
The consolidated financial statements cover the fiscal years ending March 31, 2012 and March 31, 2013. Net sales fell from ¥13,334 million to ¥12,632 million, yet operating income rose from ¥2,194 million to ¥2,574 million, reflecting lower cost of sales and improved operating efficiency. Net income more than doubled, increasing from ¥749 million to ¥1,654 million, largely driven by a substantial extraordinary gain of ¥406 million on the sale of subsidiary shares and reduced operating expenses. Comprehensive income grew from ¥732 million to ¥1,691 million; foreign‑currency translation adjustments swung from a negative ¥5 million to a positive ¥36 million, offsetting other comprehensive losses. Assets increased from ¥19,649 million to ¥20,083 million. Current assets grew modestly, with cash and deposits rising by ¥2,776 million. Non‑current assets declined due to a reduction in property, plant and equipment net balance from ¥1,258 million to ¥916 million, reflecting asset disposals and depreciation. Liabilities fell from ¥4,926 million to ¥3,791 million, driven by lower current liabilities and a reduction in non‑current obligations. Shareholders’ equity expanded from ¥14,722 million to ¥16,291 million; retained earnings grew by ¥1,453 million, while treasury stock decreased in net value from a negative ¥1,753 million to a negative ¥1,690 million. Cash flow analysis shows operating cash inflows rising from ¥1,043 million to ¥2,836 million. Investing activities remained negative, with a net outflow of ¥2,971 million in 2012 and ¥946 million in 2013, largely due to property, plant and equipment purchases. Financing cash flows were negative in both years, with treasury stock repurchases offset by modest dividend payments. The company’s liquidity improved, as cash and equivalents increased from ¥11,293 million to ¥9,199 million despite the net cash outflow in 2012. Overall, the firm strengthened profitability and equity while managing asset composition and cash flows over the two‑year period.
mixi
Report
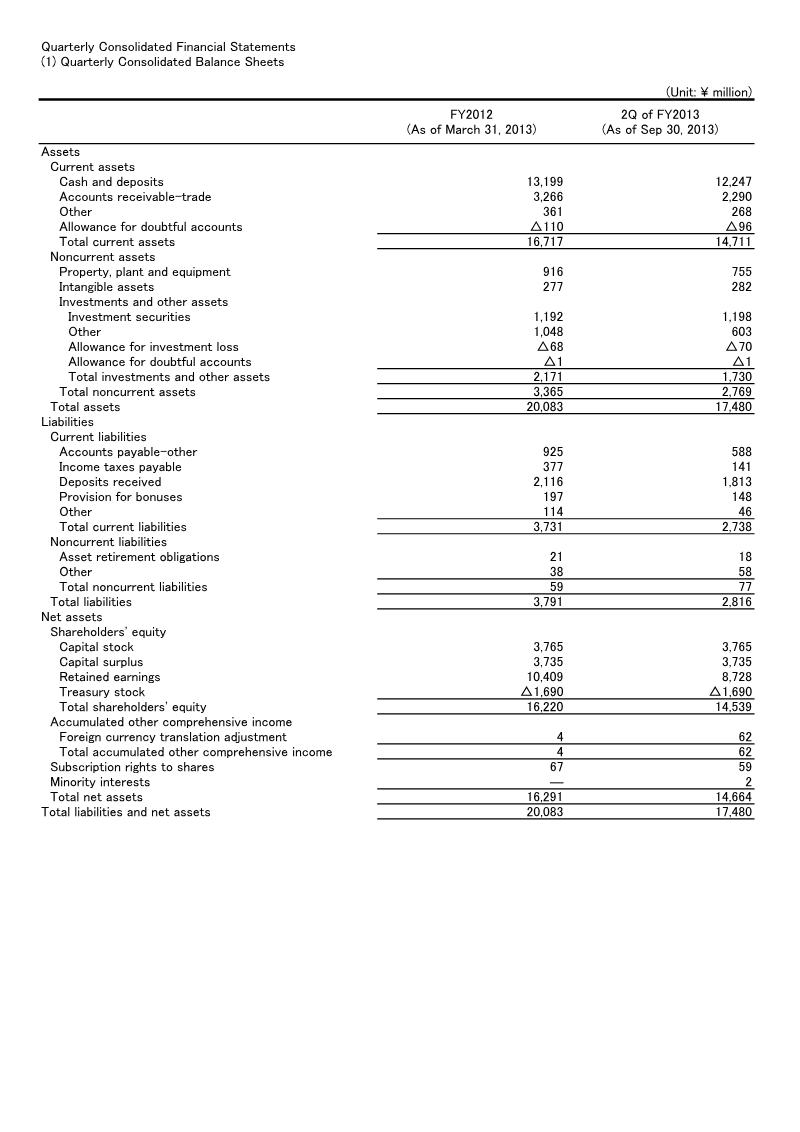
Quarterly Consolidated Balance Sheets: 2Q FY2013
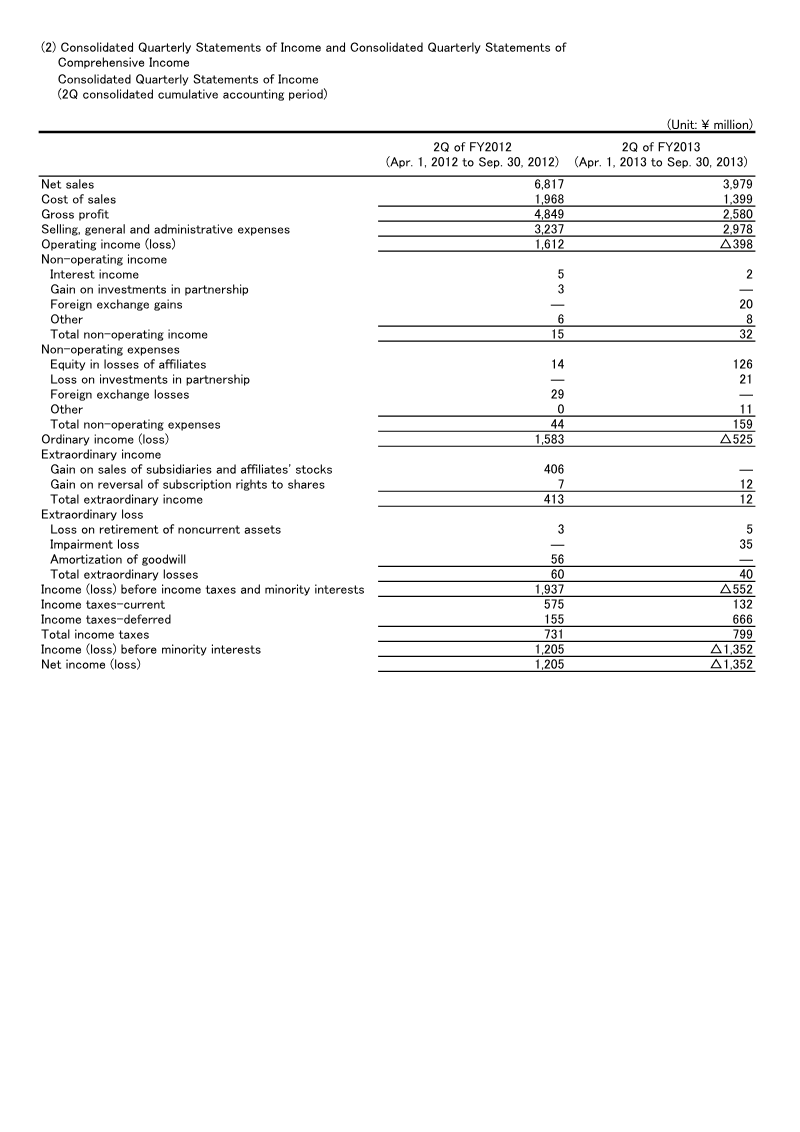
The quarterly consolidated balance sheet and income statements for the second quarter of fiscal year 2013 reveal a contraction in both operating performance and financial position compared with the same period of fiscal year 2012. Total assets fell from ¥20,083 million to ¥17,480 million, largely due to a reduction in current assets and non‑current investments. Current liabilities decreased from ¥3,731 million to ¥2,738 million, but shareholders’ equity declined from ¥16,291 million to ¥14,664 million, driven by a lower retained earnings balance and the continued impact of treasury stock. Operating income swung from ¥1,612 million in 2Q FY2012 to a loss of ¥398 million in 2Q FY2013, reflecting higher selling, general and administrative expenses relative to sales. Net sales dropped by 41% from ¥6,817 million to ¥3,979 million, while cost of sales fell proportionally. Non‑operating losses increased sharply due to a ¥126 million loss on equity in affiliates and a ¥21 million loss on investments, offset only partially by foreign exchange gains of ¥20 million. Ordinary income turned negative, with a loss of ¥525 million in 2Q FY2013 versus a profit of ¥1,583 million previously. Comprehensive income mirrored the net loss trend, reporting a ¥1,293 million loss attributable to owners of the parent in 2Q FY2013 versus a ¥1,184 million profit in 2Q FY2012. Cash flow analysis shows operating cash outflows of ¥448 million, a significant rise in investing cash inflows to ¥2,774 million—largely from sales of subsidiary shares—and financing outflows of ¥327 million due to dividend payments. Overall, the company experienced a notable decline in profitability and equity during the second quarter of FY2013.
mixi
Report
Mixi Report: FY2013 Business Results
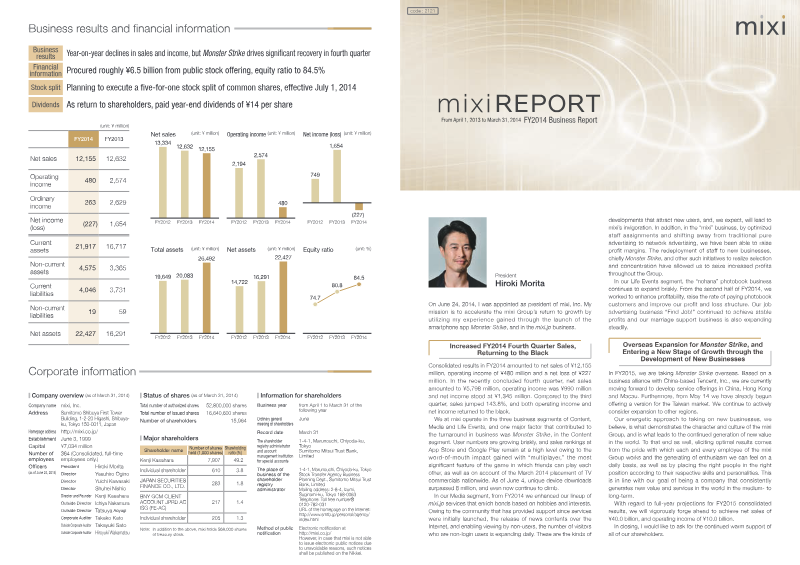
The FY2014 business results demonstrate a strategic pivot toward new growth areas after a period of declining sales and income. Net sales fell 3 % from ¥12,632 million in FY2013 to ¥12,155 million in FY2014, while operating income contracted sharply from ¥2,574 million to ¥480 million, resulting in a net loss of ¥227 million. The decline is largely attributed to reduced performance in the traditional “mixi” social networking segment, which has been restructured toward network advertising and staff redeployment to higher‑margin initiatives. In contrast, the Content Group’s flagship mobile game Monster Strike delivered a robust recovery: fourth‑quarter sales rose 143.8 % to ¥5,798 million, operating income reached ¥990 million, and net profit stood at ¥1,345 million. Monster Strike’s success is linked to aggressive marketing, including nationwide TV commercials and a focus on multiplayer features that encourage daily play among friends. The company plans to expand the game overseas, targeting China, Hong Kong, Macau, and Taiwan, with a partnership with Tencent to localize the service. Other segments—Media and Life Events—continue to grow. The “nohana” photobook business achieved a 16 % increase in paid purchase rates, while the “Find Job!” job‑advertising service maintained a stable user base of 700 k members. Mixi’s equity ratio improved to 84.5 % after a ¥6.5 billion public offering, and a five‑for‑one stock split is scheduled for July 1 2014. Overall, the report highlights a shift from legacy social networking to diversified content and advertising services, with Monster Strike as the primary catalyst for returning profitability.
mixi
Report
FY2015 Annual Business Report: MIXI
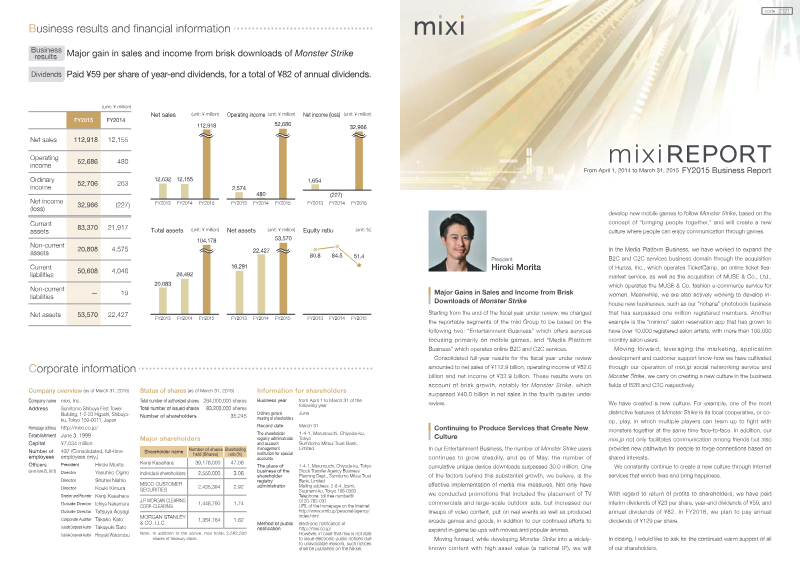
The FY2015 annual report demonstrates that mixi, Inc.’s core revenue engine remains the mobile game Monster Strike, which generated ¥112.9 billion in net sales and ¥52.7 billion of operating income, a 30‑plus percent increase over FY2014. Net profit rose to ¥32.9 billion, reversing the prior year’s loss, and dividends were raised to ¥59 per share (¥82 total). The company attributes the surge to Monster Strike’s rapid download growth—over 30 million cumulative unique device downloads—and its expansion into new markets, including China, South Korea, North America, and Hong Kong/Macau. Strategic media‑mix initiatives such as TV commercials, outdoor advertising, and in‑game tie‑ups with movies and anime have reinforced user acquisition and retention. Beyond Monster Strike, mixi diversified its portfolio through acquisitions of Hunza, Inc. (TicketCamp) and MUSE & Co., Ltd. (fashion e‑commerce), strengthening its B2C and C2C services segment. The company also launched several new mobile titles in FY2015, including “nohana” photo‑sharing and “Kimidake LIVE,” a live‑streaming platform for artists, targeting family and children audiences. A planned annual release of one new game each year signals a sustained focus on in‑house development. Financially, total assets stood at ¥104.2 billion with an equity ratio of 51.4 %. The report outlines a forward‑looking strategy that leverages mixi’s social networking foundation, media‑mix expertise, and newly acquired IPs to broaden its entertainment and platform businesses while continuing to deliver shareholder value through dividends.
DeNA Co.
Report
2024 Integrated Report: Value Creation Story
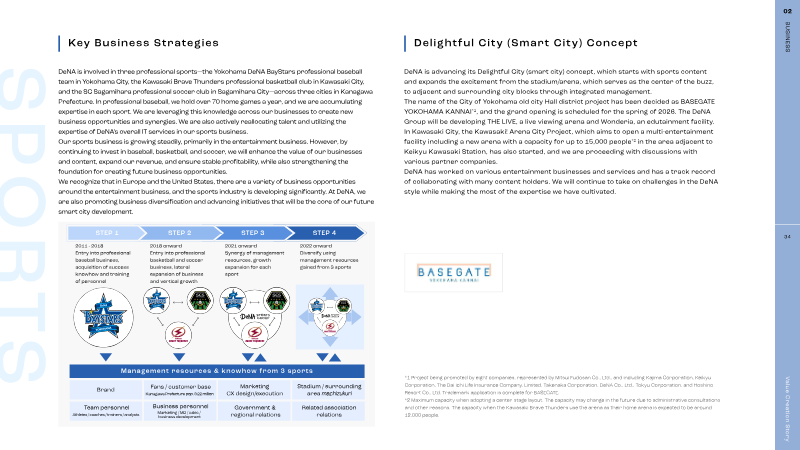
BRA NOERSA KAWASAKI PoReMoN 7U= KOTAN BRAVE THUNDERS EMEI2M63ORMER 2023/04/08 4,000##3 FBX=1-0RN a Head of the Live Co 3 PBREBRiTBUERE RES 8 ©AS90RN Head of the New Bus 37 Development Division Join Representative Director, y to delight people everywhere. We seek to entertain and enrich lives, and to serve and make the world a better place.
DeNA Co.
Report
2023 Integrated Report: Value Creation Story
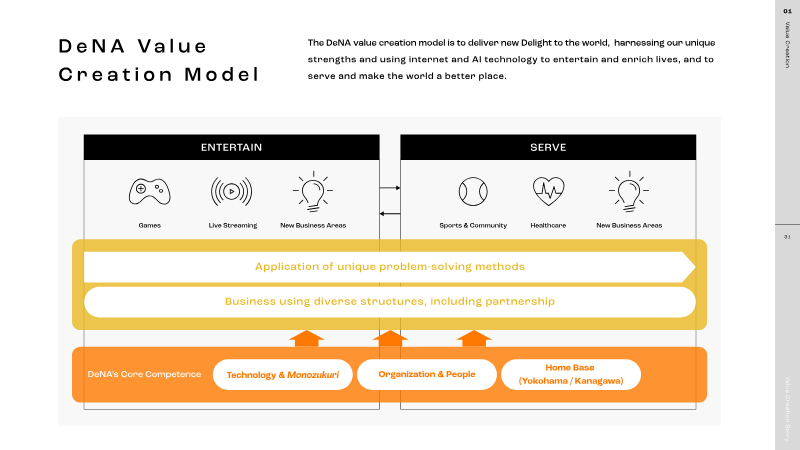
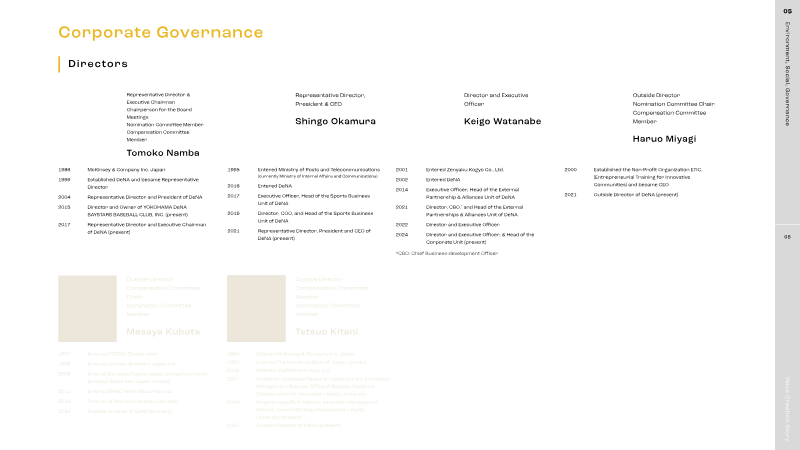
O VISION ENTERTAIN We will be the world's premier provider of internet and Al technology to delight people We seek to entertain and enrich lives, and to serve and make the world a better place SERVE C Each of us harnesses our individual strengths to make our unique business succeed.
DeNA Co.
Report
2025 Integrated Report: Value Creation Story
KAWASAKI BUNKA KOEN BHTSHFUE We will be the world premier provider of internet and technology to delight people everywhere. We seek to entertain and enrich lives and to serve and make the world a better place. Each of us harnesses our individual strengths to make our unique business succeed.
Koei Tecmo
Report
Financial Highlights: 1st Quarter of Fiscal Year Ending March 2011
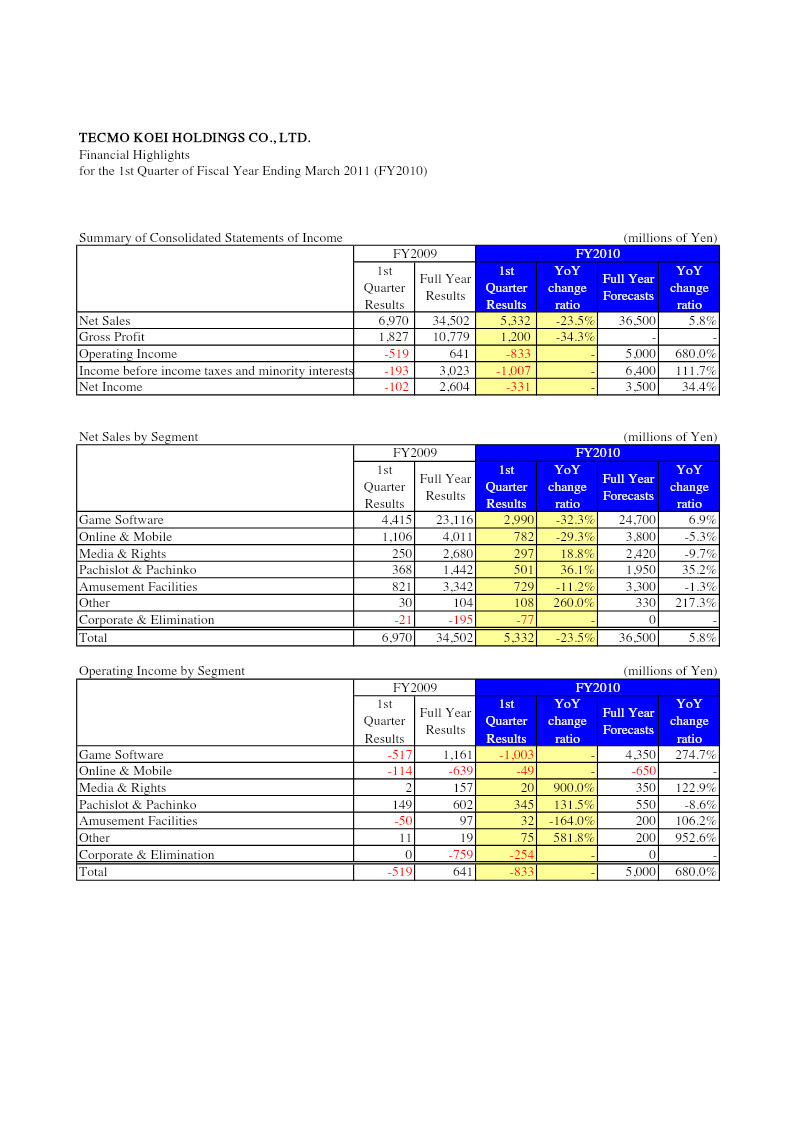
The financial highlights for the first quarter of fiscal year ending March 2011 reveal a mixed performance across Tecmo Koei Holdings’ operating segments. Net sales fell 23.5 % year‑over‑year to ¥34,502 million, driven mainly by declines in game software sales (−32.3 %) and online & mobile revenue (−29.3 %). In contrast, pachislot & pachinko sales rose 36.1 % to ¥1,442 million, while media & rights and amusement facilities experienced modest growth of 18.8 % and −11.2 %, respectively. The “Other” segment saw a sharp increase of 260 % to ¥104 million, though its absolute contribution remained small. Operating income swung from a loss of ¥519 million in the same quarter of FY2009 to a profit of ¥641 million, an improvement of 1,160 million yen. This turnaround was largely attributable to game software operating income rising from a loss of ¥517 million to a profit of ¥1,161 million. Online & mobile income improved from a loss of ¥114 million to a profit of ¥639 million, while media & rights and pachislot & pachinko also posted gains. The “Other” segment’s operating income increased markedly, though its impact on total profitability was limited by the overall scale. Net income shifted from a loss of ¥102 million to a profit of ¥2,604 million, reflecting the combined effect of stronger operating results and favorable tax treatment. Forecasts for the full year project net sales growth to 5.8 % and operating income to 680 %, indicating management’s expectation of a rebound in game software sales and continued strength in pachislot & pachinko. The analysis covers all business units within the company, with data expressed in millions of yen for FY2009 and FY2010, and includes year‑over‑year comparisons and forecasted full‑year figures.
Koei Tecmo
Report
Financial Highlights: Fiscal Year Ending March 2011
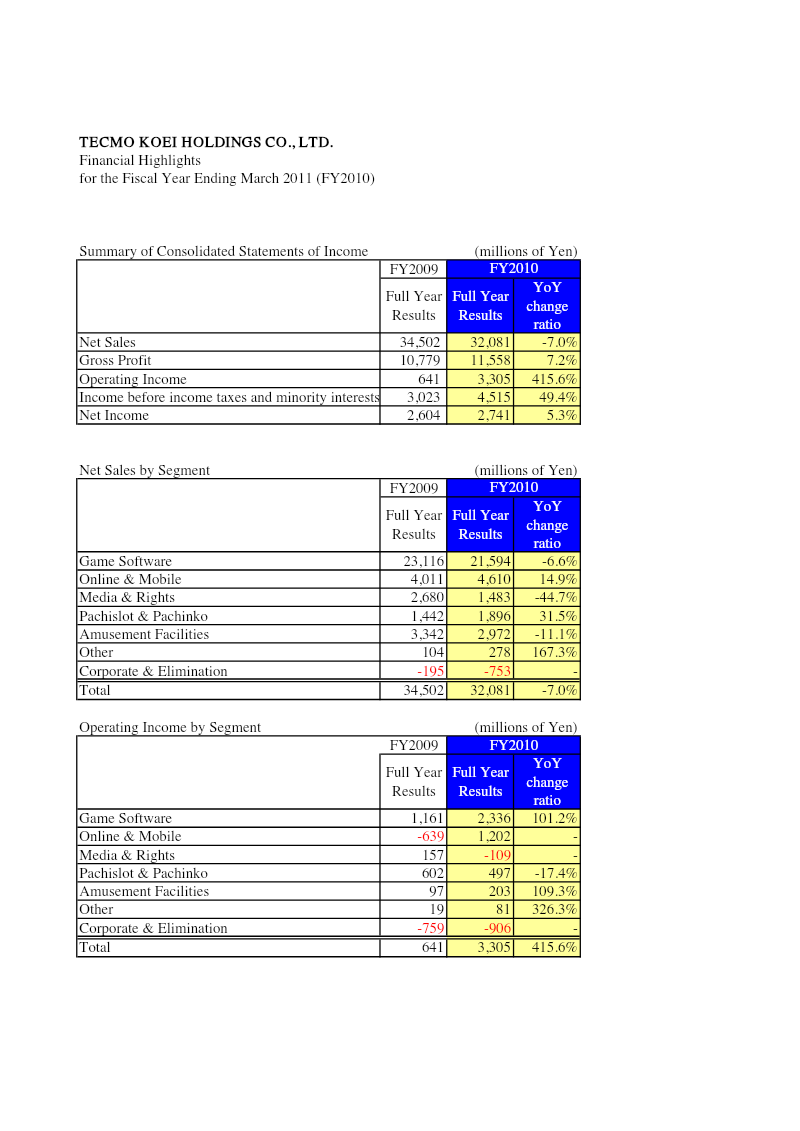
Financial highlights for the fiscal year ending March 2011 show a mixed performance for Tecmo Koei Holdings. Net sales fell 7 % to ¥32,081 million from ¥34,502 million in FY2009, driven mainly by declines in game software sales (‑6.6 %) and media & rights revenue (‑44.7 %). Conversely, online & mobile sales grew 14.9 %, and pachislot & pachinko revenue increased 31.5 %. The “Other” segment, largely comprising new or restructured businesses, surged 167.3 % to ¥278 million. Operating income expanded dramatically by 415.6 %, rising from ¥641 million to ¥3,305 million. This surge was largely due to a 101.2 % jump in game software operating income and a 109.3 % increase in amusement facilities, offset by declines in pachislot & pachinko (‑17.4 %) and media & rights (negative contribution). The “Other” segment contributed a 326.3 % increase in operating income, reflecting successful new initiatives. Income before taxes and minority interests grew 49.4 % to ¥4,515 million, while net income increased modestly by 5.3 % to ¥2,741 million. The company’s profitability improved despite lower sales volumes, largely through cost efficiencies and higher-margin segments. The analysis covers Japan‑based operations for FY2010, using consolidated financial statements. Data are presented in millions of yen, with year‑over‑year comparisons highlighting key segment shifts and overall profitability trends.
Koei Tecmo
Report
Financial Highlights: 1st Quarter of the Fiscal Year Ending March 2012
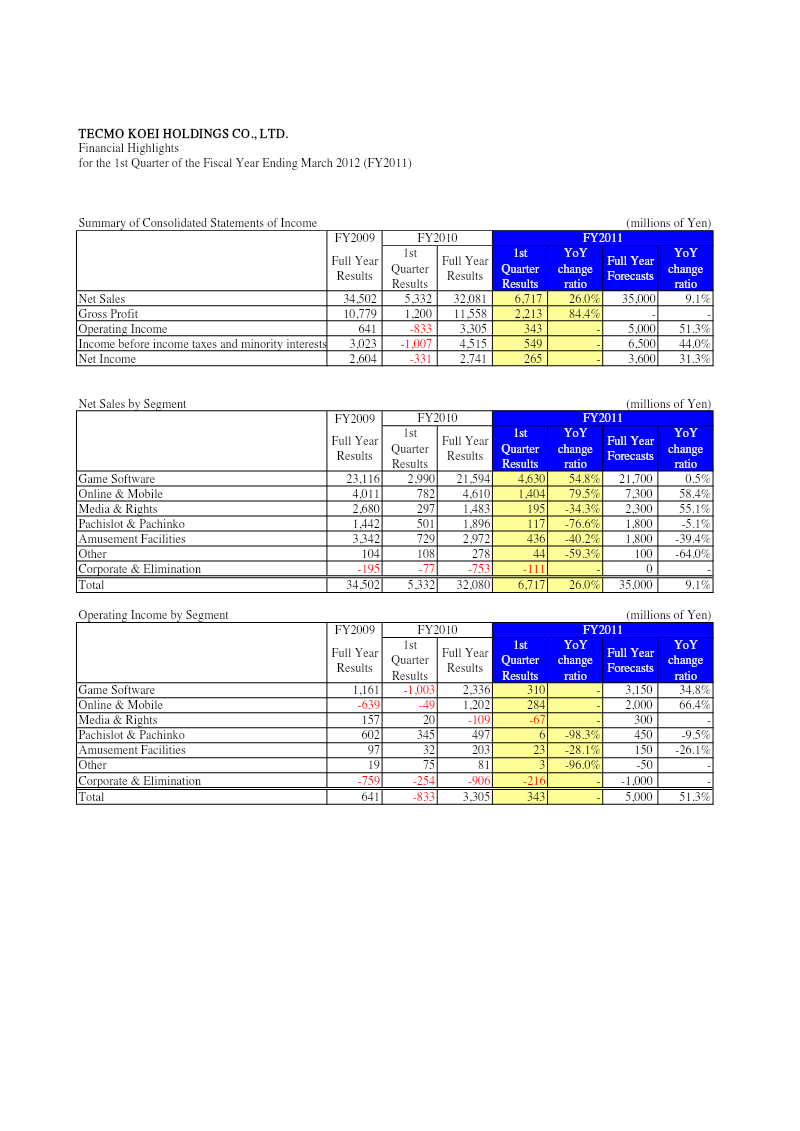
The financial highlights present Tecmo Koei Holdings’ performance for the first quarter of fiscal year 2011, ending March 31, 2012. Net sales rose 26 % year‑over‑year to ¥34.5 billion, driven primarily by the Game Software segment, which generated ¥23.1 billion in sales and contributed a 54.8 % increase from the previous year’s first quarter. Online & Mobile sales also grew strongly, up 79.5 % to ¥4.6 billion, while Media & Rights and Pachislot & Pachinko segments declined sharply by 34.3 % and 76.6 %, respectively. Amusement Facilities sales fell 40.2 %. Corporate and elimination items offset gains, resulting in a net income of ¥2.6 billion, up 31.3 % from the prior year’s first quarter. Operating income improved markedly to ¥641 million, a 51.3 % increase from the prior year’s first quarter, largely due to gains in Game Software (¥1.16 billion) and Online & Mobile (¥1.20 billion). However, the Media & Rights segment posted a loss of ¥109 million, and Pachislot & Pachinko’s operating income fell 98.3 % to ¥497 million, reflecting a significant downturn in that business line. The report covers Japan‑based operations across five core segments—Game Software, Online & Mobile, Media & Rights, Pachislot & Pachinko, and Amusement Facilities—over the first quarter of FY2011. Data are presented in millions of yen, with year‑on‑year comparisons and forecasts for the full fiscal year. The methodology relies on consolidated financial statements, with no explicit survey or sampling details disclosed. Overall, the company experienced robust growth in its core gaming and online divisions, offset by declines in traditional gambling‑related businesses.
Koei Tecmo
Report
Financial Highlights: 1st Half of Fiscal Year Ending March 2012
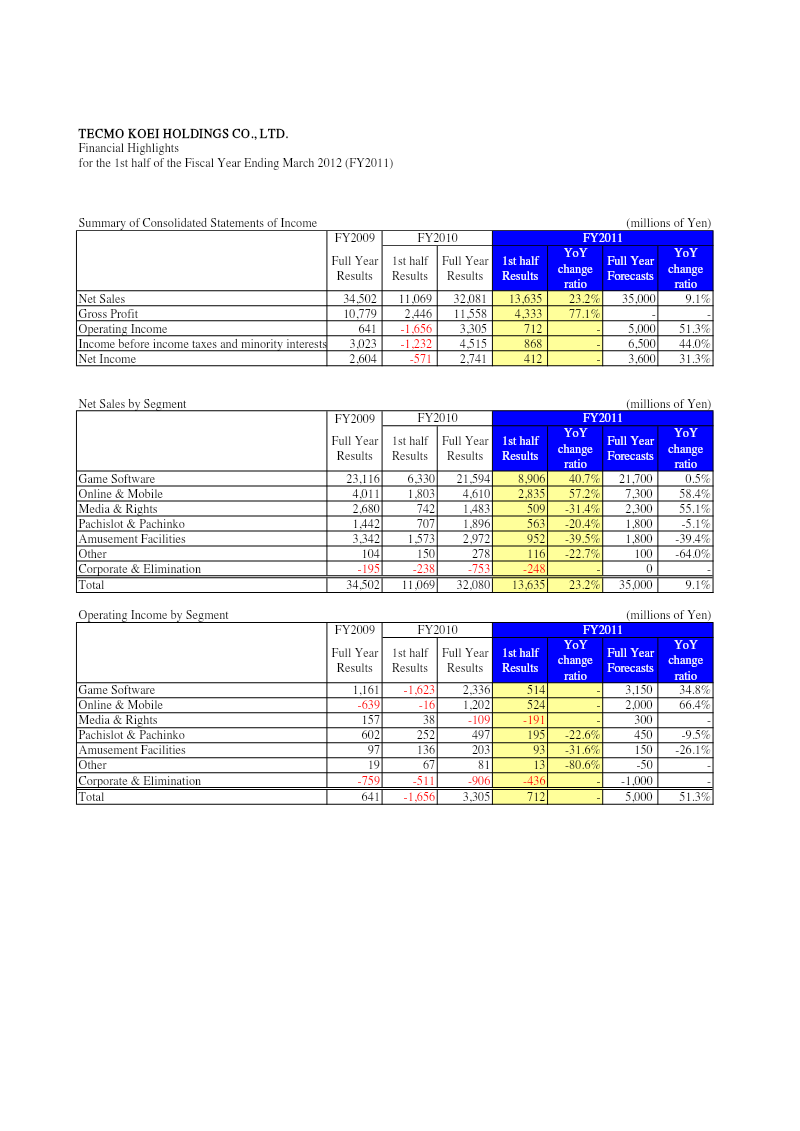
Financial highlights for the first half of fiscal year ending March 2012 reveal a mixed performance across Tecmo Koei Holdings’ business segments. Net sales rose 23.2 % year‑over‑year to ¥11,069 million, driven primarily by growth in Game Software (40.7 % increase) and Online & Mobile (57.2 % increase). Media & Rights, Pachislot & Pachinko, Amusement Facilities, and Other segments all experienced declines ranging from 20.4 % to 39.5 %. Corporate and elimination items contributed a net negative of ¥753 million, offsetting gains in other areas. Operating income for the period was ¥641 million, a sharp improvement from a loss of ¥1,656 million in the same period a year earlier. The recovery was largely due to Game Software (+34.8 %) and Online & Mobile (+66.4 %). However, Media & Rights, Pachislot & Pachinko, Amusement Facilities, and Other segments remained unprofitable or posted modest gains. Corporate and elimination costs again weighed heavily on profitability. Net income increased to ¥412 million, up 31.3 % from a loss of ¥571 million in the prior year’s first half, reflecting stronger operating performance and reduced tax expenses. Forecasts for the full year indicate a modest 9.1 % increase in net sales to ¥35,000 million and a target operating income of ¥5,000 million. The analysis draws on consolidated financial statements for the first half and full year of FY2011, comparing them to FY2009 and FY2010 figures. Data are presented in millions of yen, with year‑over‑year changes expressed as percentages. The report covers all business segments within the company’s geographic scope, primarily Japan and related international operations.
Previous
1
…
5
6
7
…
27
Next