Report8 pages
Consolidated Financial Report: Q2 2020
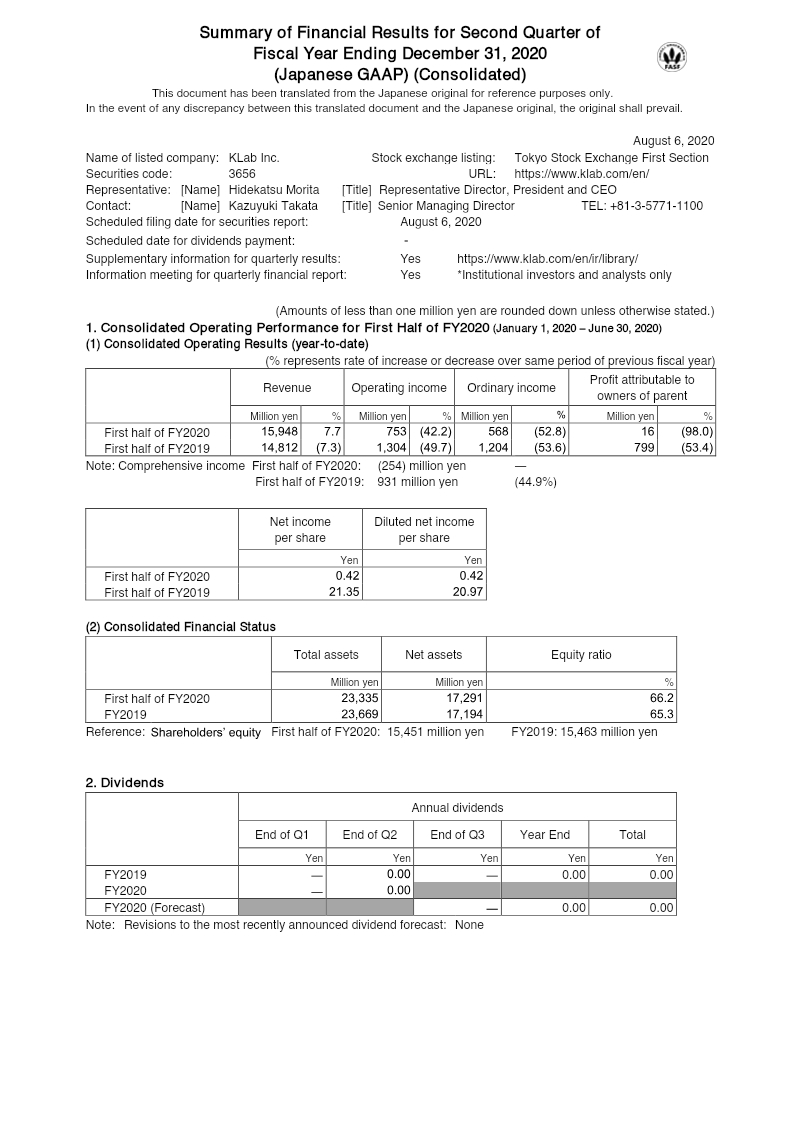
KLab Inc. reports consolidated financial results for the first half of fiscal year 2020 (January 1–June 30, 2020). Revenue rose to ¥15.95 billion from ¥14.81 billion in the same period of FY2019, a 7.7 % increase, driven by growth in the game business and other businesses such as research & consulting. Operating income fell sharply to ¥753 million from ¥1,305 million, a 42.2 % decline, largely due to higher cost of sales and lower gross profit margin. Ordinary income dropped 52.8 % to ¥568 million, and profit attributable to owners of parent fell 98 % to ¥16 million. Net income turned negative, with a loss of ¥44 million versus a profit of ¥21 million in FY2019, reflecting significant foreign exchange losses and impairment charges. Comprehensive income also turned negative at ¥254 million compared with a positive ¥932 million in FY2019, driven by valuation losses on available‑for‑sale securities and foreign currency translation adjustments.
Total assets decreased modestly to ¥23.34 billion from ¥23.67 billion, while shareholders’ equity remained stable at ¥17.29 billion, giving an equity ratio of 66.2 %. Net assets grew slightly to ¥17.29 billion, and the company maintained a strong liquidity position with cash and deposits of ¥6.38 billion. No dividends were declared for FY2019 or FY2020, and the forecasted dividend remained unchanged. The report covers Japan only, covering KLab’s core game development and ancillary businesses, with data derived from consolidated financial statements under Japanese GAAP. The methodology follows standard accounting principles without restatements or significant policy changes during the period.
- KLab Inc. reported a 98% decline in profit attributable to owners of the parent to ¥16 million for the first half of 2020, compared to the same period in 2019.
- Operating income fell 42.2% to ¥753 million, driven by an increased cost of sales and a lower gross profit margin.
- Revenue grew by 7.7% to ¥15.95 billion, supported by performance in the company's core game business and research and consulting services.
- The company recorded a net loss of ¥44 million for the first half of 2020, primarily due to significant foreign exchange losses and impairment charges.
- Comprehensive income turned negative at ¥254 million, impacted by valuation losses on available-for-sale securities and foreign currency translation adjustments.
+1
KLab
Report8 pages
Quarterly Financial Report: Q3 2020
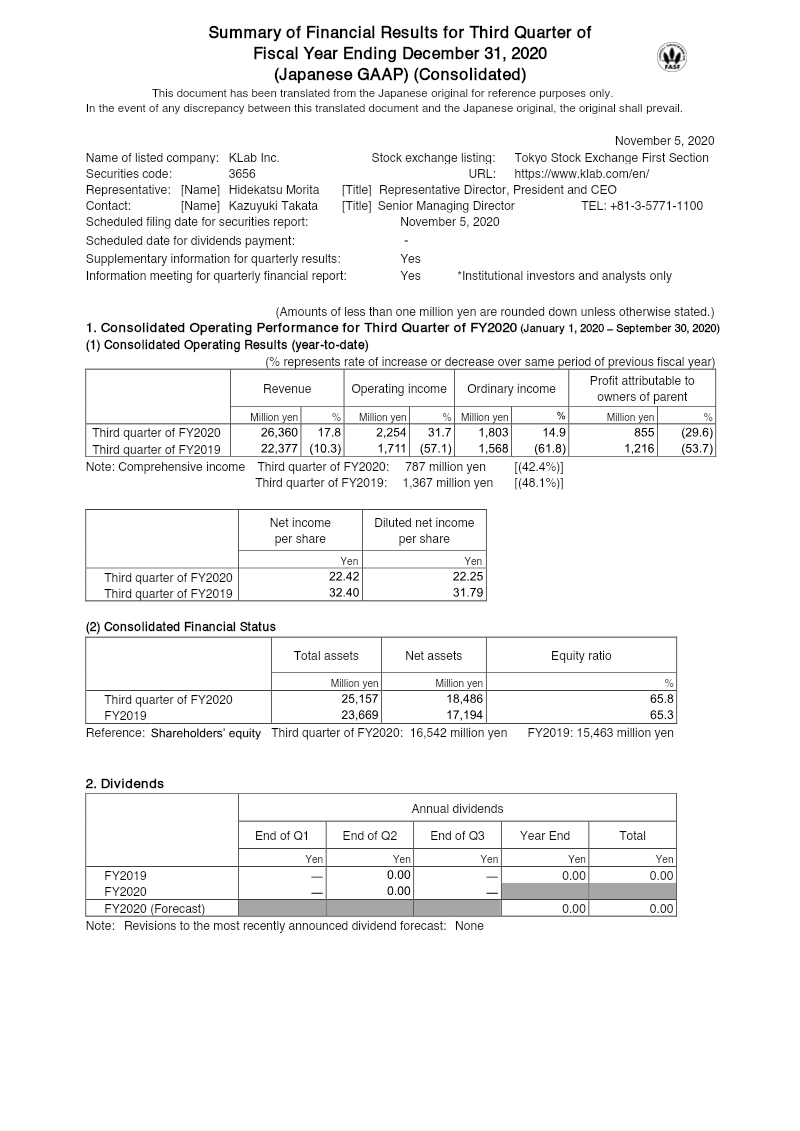
KLab Inc. reports a robust third‑quarter performance for fiscal year 2020, with revenue rising to ¥26.36 billion from ¥22.38 billion in the same period of FY2019, a 17.8 % increase driven by its game business segment. Operating income grew to ¥2.25 billion, up 31.7 % year‑over‑year, while ordinary income reached ¥1.80 billion, a 14.9 % rise. Net profit attributable to the parent fell to ¥855 million, a 29.6 % decline, largely due to higher foreign‑exchange losses and an impairment charge of ¥498.9 million on investments. Comprehensive income for the quarter was ¥787 million, down 42.4 % from ¥1.37 billion in FY2019, reflecting a reversal of the valuation gain on available‑for‑sale securities and foreign‑currency translation adjustments.
Total assets increased to ¥25.16 billion, with current assets up 13.8 % and non‑current assets slightly down due to a reduction in intangible software assets. Net assets rose to ¥18.49 billion, and the equity ratio improved to 65.8 %. Outstanding shares averaged 38.17 million, with no treasury shares held at quarter‑end.
The company maintained a dividend policy of zero for FY2020, with no forecasted dividends. No changes to accounting principles were reported, and the effective tax rate was applied consistently across periods. The report covers Japan‑based operations for FY2020 (January 1–September 30) and compares results to the same period in FY2019.
- KLab Inc. reported a 17.8% year-over-year revenue increase to ¥26.36 billion for the first nine months of FY2020, driven by strong performance in its game business segment.
- Operating income rose 31.7% to ¥2.25 billion, while ordinary income grew 14.9% to ¥1.80 billion compared to the same period in FY2019.
- Net profit attributable to the parent fell 29.6% to ¥855 million, primarily due to foreign-exchange losses and a ¥498.9 million impairment charge on investments.
- Comprehensive income declined 42.4% to ¥787 million, impacted by a reversal of valuation gains on available-for-sale securities and foreign-currency translation adjustments.
- The company’s financial position strengthened with net assets rising to ¥18.49 billion and an improved equity ratio of 65.8%.
+1
KLab
Report9 pages
Q1 2021 Financial Statement
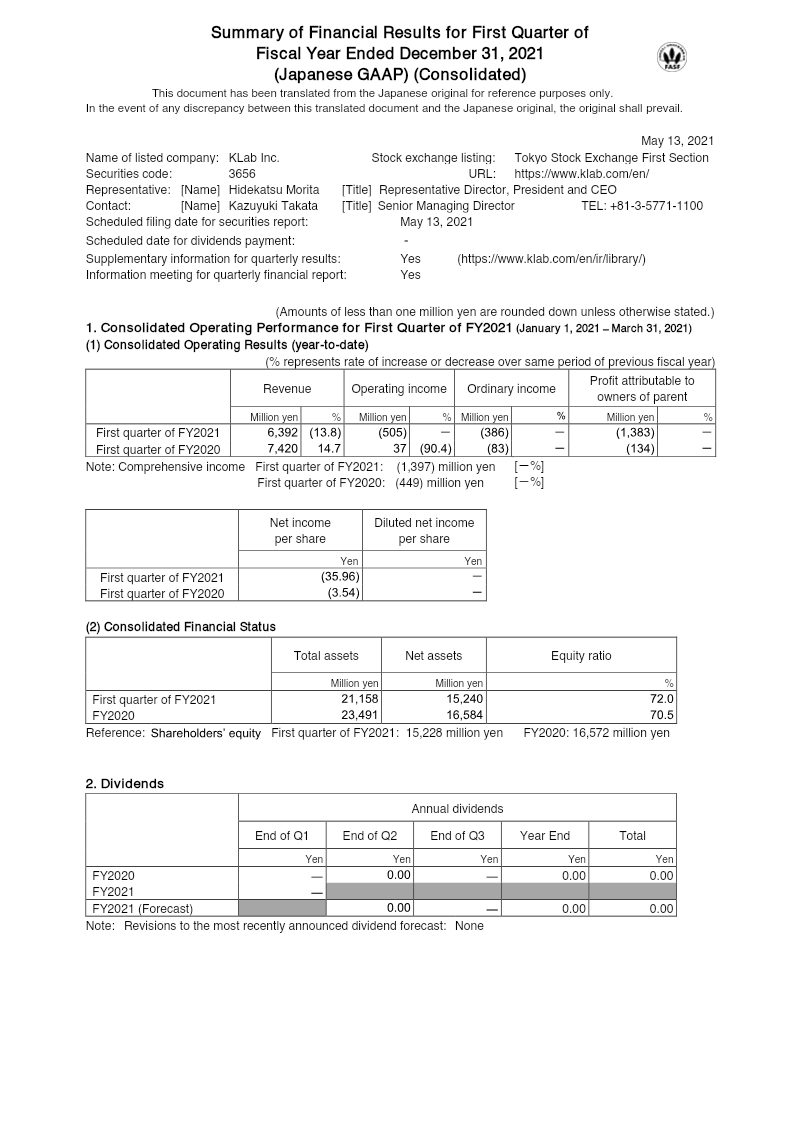
KLab Inc. reported a sharp decline in first‑quarter FY2021 operating performance compared with the same period of FY2020. Revenue fell to ¥6,392 million from ¥7,420 million, a 13.8% drop, while operating income turned negative at ¥(505) million versus a profit of ¥37 million in FY2020. Ordinary income and profit attributable to the parent also swung from a ¥(83) million loss to a ¥386 million loss, reflecting significant impairment charges of ¥1.54 billion on software assets that dominated the extraordinary loss line item. Comprehensive income deteriorated to a ¥1,397 million loss from a ¥449 million loss in FY2020, largely driven by the same impairment and foreign‑exchange losses.
Total assets decreased to ¥21.16 billion from ¥23.49 billion, with net assets falling to ¥15.24 billion and the equity ratio contracting from 70.5% to 72.0%. Cash and deposits were ¥6.38 billion, while current liabilities stood at ¥5.10 billion, leaving a modest working‑capital cushion. No dividends were declared for FY2021, and the company maintained its share‑repurchase program capped at ¥500 million.
The quarter’s financials were prepared under Japanese GAAP, with no changes to accounting principles or estimates. The company’s segment analysis shows the game business as the sole revenue generator, with a reported impairment loss of ¥1.54 billion recorded in this segment. A subsequent acquisition of GlobalGear Co., Ltd. was announced, aimed at expanding KLab’s casual‑game portfolio and global reach.
- KLab Inc. reported a 13.8% year-over-year revenue decline in Q1 2021, falling to ¥6,392 million from ¥7,420 million.
- Operating income swung to a ¥505 million loss compared to a ¥37 million profit in the same period of 2020.
- The company recorded a significant ¥1.54 billion impairment charge on software assets, which was the primary driver of a ¥386 million loss attributable to the parent company.
- Comprehensive income deteriorated significantly to a ¥1,397 million loss, exacerbated by the software impairment and foreign-exchange losses.
- Total assets decreased to ¥21.16 billion from ¥23.49 billion, though the company maintains a working-capital cushion with ¥6.38 billion in cash against ¥5.10 billion in current liabilities.
+1
KLab
Report8 pages
Financial Report: Q2 2021
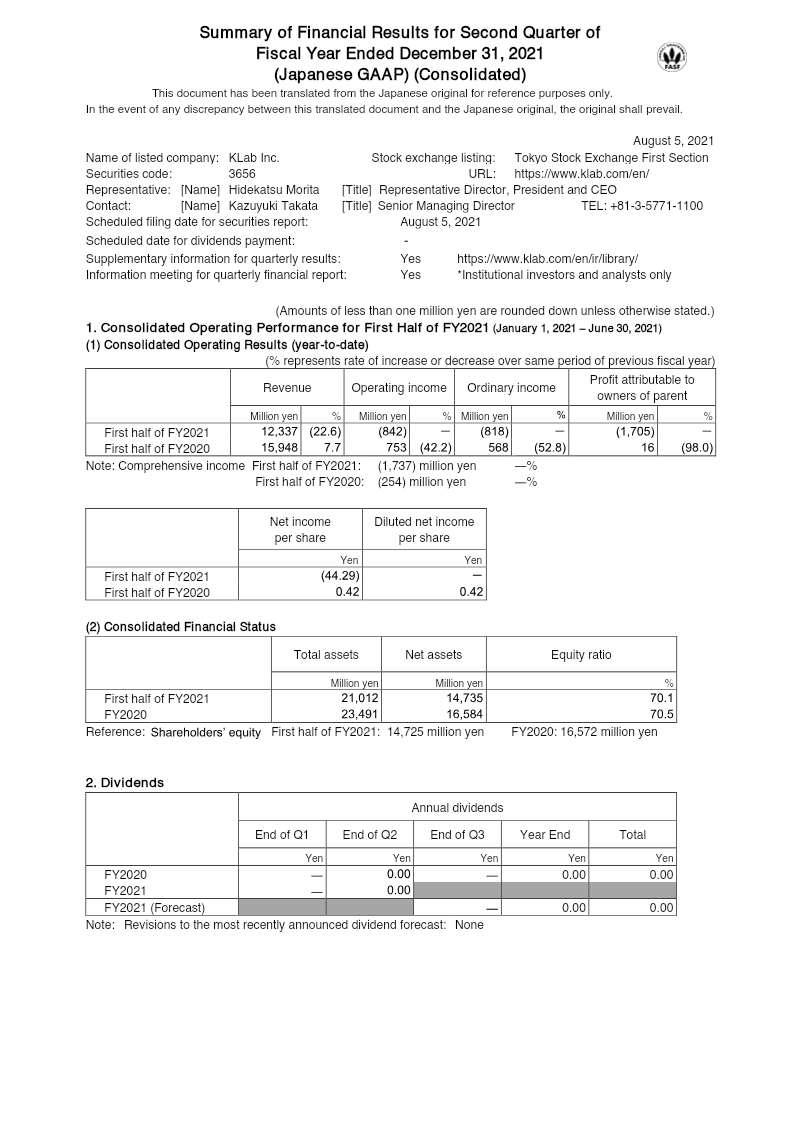
KLab Inc. reports a sharp contraction in operating performance for the first half of fiscal 2021 (January 1–June 30). Total revenue fell to ¥12.34 billion, a 22.6 % decline from the ¥15.95 billion recorded in the same period of FY2020, while operating income turned into a loss of ¥842 million versus an operating profit of ¥753 million in FY2020. Ordinary income and profit attributable to owners of the parent both swung into negative territory, with a loss of ¥818 million and ¥1.71 billion respectively, compared to profits of ¥568 million and ¥16 million in FY2020. Net income for the period was a loss of ¥44.3 million per share, contrasting with a modest profit of ¥0.42 per share in FY2020.
The comprehensive loss widened to ¥1.74 billion, driven largely by a ¥1.54 billion impairment loss on goodwill and other extraordinary losses. Asset‑side, total assets declined to ¥21.01 billion from ¥23.49 billion, while equity fell to ¥14.74 billion, maintaining an equity ratio of 70.1 %. Treasury stock increased to ¥200.985 million after a February acquisition of 286,600 shares.
Revenue concentration remained in the game business segment (≈¥12.13 billion), with a secondary “Other” segment contributing ¥209 million. The company disclosed no dividend for FY2021 and maintained a forecast of zero dividends for the year.
Methodologically, figures are presented under Japanese GAAP, with a consolidated view of all subsidiaries. No changes to accounting principles or restatements were reported for the period.
- KLab Inc. experienced a significant financial downturn in H1 2021, with total revenue falling 22.6% year-over-year to ¥12.34 billion.
- Operating performance swung from a ¥753 million profit in H1 2020 to an operating loss of ¥842 million in H1 2021.
- The company reported a net loss of ¥1.71 billion attributable to owners of the parent, resulting in a loss of ¥44.3 per share compared to a profit of ¥0.42 per share in the prior year.
- A ¥1.54 billion impairment loss on goodwill and other extraordinary losses contributed to a comprehensive loss of ¥1.74 billion for the period.
- Total assets declined to ¥21.01 billion from ¥23.49 billion, though the company maintained a solid equity ratio of 70.1%.
+1
KLab

Report9 pages
Supplementary Explanatory Materials Regarding the Opinion of the Company’s Board of Directors on Shareholder Proposals: GungHo Online Entertainment
GungHo Online Entertainment’s board opposes all shareholder proposals presented by Strategic Capital and LIM Japan Event Master Fund at the 2026 Annual General Meeting. The board’s stance centers on preserving corporate value through prudent financial management and robust governance structures.
For shareholder‑return proposals, the board cites that two proposals would divert roughly 57 % of cash and deposits to dividends or treasury‑share buybacks, deemed excessive relative to the company’s operating environment. GungHo maintains a balanced return policy: a 4 % dividend‑on‑equity (DOE) target alongside a consolidated payout ratio of at least 50 %, with an ordinary dividend of ¥90.00 per share for FY 2025 and a planned treasury‑share acquisition up to ¥5 billion (≈3.9 % of issued shares). The board argues that these measures align with capital efficiency and long‑term value creation.
Governance proposals were rejected on the basis that GungHo already has a strong independent director framework—currently 40 % outside directors, rising to 50 % after the AGM—and that appointing an outside chair or chairman would undermine operational leadership. The board also defends its current dividend determination process, which allows flexibility between shareholder and board resolutions.
Other proposals, including changes to remuneration disclosure, sales‑by‑title reporting, and investigations into alleged misconduct, were dismissed because GungHo’s existing internal controls, external audit procedures, and disclosure practices already meet regulatory standards. The board concluded that none of the proposals would enhance corporate value, justifying its unanimous opposition.
- GungHo Online Entertainment’s board has unanimously rejected all shareholder proposals from Strategic Capital and LIM Japan Event Master Fund for the 2026 Annual General Meeting.
- The board rejected shareholder-return proposals that would have distributed approximately 57% of the company's cash and deposits, labeling the demand as excessive.
- GungHo maintains a capital return policy targeting a 4% dividend-on-equity (DOE) and a minimum 50% consolidated payout ratio, including a ¥90.00 per share dividend for FY 2025.
- The company plans to execute a treasury-share acquisition of up to ¥5 billion, representing approximately 3.9% of issued shares, to support long-term value creation.
- GungHo is increasing its board independence, with the proportion of outside directors set to rise from 40% to 50% following the 2026 AGM.
GungHo Online Entertainment

Report43 pages
1Q FY2022 Presentation Material
1Q FY2022 Presentation Material The future information, such as earnings forecast, written in this document is based on our expectations and assumptions as of the date the forecast was made. Our actual results could differ materially from those described in this forecast because of various 1. Quarterly Results <sub>(October </sub>- December 2021) 3. Internet Advertisement Business 6. Medium to long-term strategy FY2022 Sales and OP were off to a strong start.
- Q1 FY2022 saw strong overall performance with sales of 171.0 billion yen (up 30.6% YoY) and operating profit (OP) of 19.8 billion yen (up 2.8X YoY).
- Game sales and OP significantly grew, driven by "Uma Musume Pretty Derby," reaching 58.3 billion yen (up 94.7% YoY) and 17.1 billion yen (up 15.1X YoY) respectively.
- Media revenue from ABEMA and related businesses increased to 24.9 billion yen (up 22.4% YoY), though it recorded an operating loss of 3.8 billion yen (an improvement of 80 million yen YoY).
- Advertising sales reached a new record of 87.8 billion yen (up 14.7% YoY), with an OP of 5.7 billion yen (up 0.7% YoY).
- ABEMA has exceeded 76 million downloads in five years and nine months since its launch, with its paid online live entertainment feature "ABEMA PPV ONLINE LIVE" and online sports betting "WINTICKET" contributing to its growth.
+2
CyberAgent

Report30 pages
1Q FY2023 Presentation Material
The presentation outlines CyberAgent’s strategic focus for FY2023, emphasizing a dual‑stream business model that blends advertising revenue with game development while expanding into media and digital content. Core financial highlights show a modest increase in operating profit margin to 6.7 % from 5.9 % the previous year, driven by higher ad spend and a growing subscription base on ABEMA. Operating profit rose to ¥6.4 billion, with revenue growth of 8.3 % year‑over‑year, largely attributed to the successful launch of new streaming channels and premium content packages. Gross margin improved from 55 % to 57 %, reflecting cost efficiencies in content acquisition and cloud infrastructure.
Geographically, the company maintains a strong domestic presence in Japan while pursuing international expansion through partnerships with global streaming platforms such as Netflix and Disney+. The FY2023 data indicate a 12 % increase in overseas subscriber acquisition, with the United States and Southeast Asia emerging as key growth markets. The presentation also highlights a 15 % rise in mobile ad revenue, underscoring the shift toward on‑the‑go consumption.
Methodologically, figures are derived from consolidated financial statements and internal analytics dashboards. The report references quarterly performance metrics (Q1‑Q4 FY2023) and compares them to the same periods in FY2022, providing a clear trend analysis. Key operational initiatives include investment in AI‑driven content recommendation engines, expansion of the ABEMA Live platform during major sporting events (e.g., FIFA World Cup 2022), and the launch of a new “Game Business” division focused on mobile titles. Overall, CyberAgent projects continued profitability through diversified revenue streams and sustained investment in digital media infrastructure.
- CyberAgent achieved an 8.3% year-over-year revenue increase and an operating profit of ¥6.4 billion in 1Q FY2023.
- Operating profit margins improved to 6.7% from 5.9% the previous year, supported by a gross margin increase from 55% to 57%.
- Overseas subscriber acquisition grew by 12%, with the United States and Southeast Asia identified as the primary growth markets.
- Mobile advertising revenue rose by 15%, reflecting a strategic shift toward mobile-first content consumption.
- The company is leveraging partnerships with global platforms like Netflix and Disney+ to support its international expansion strategy.
+1
CyberAgent

Report45 pages
3Q FY2023 Presentation Material: Japan
3Q FY2023 Presentation Material The future information, such as earnings forecast, written in this document is based on our expectations and assumptions as of the date the forecast was made. Our actual results could differ materially from those described in this forecast because of various 1. Financial Summary<sub>(April-June 2023)</sub> 3. Internet Advertisement Business 6. Medium to long-term strategy FY2023 Media and Ads increased the sales.
- Overall Q3 FY2023 performance saw a significant drop in operating profit (down 86.2% YoY to 1.4 billion yen) despite sales remaining flat (down 0.2% YoY to 171.7 billion yen).
- The Game business experienced lower-than-expected earnings, with sales down 27.0% YoY to 33.7 billion yen and an operating loss of 0.1 billion yen, primarily due to a slowdown after major game anniversaries in Q2.
- The Media business, specifically ABEMA, saw improved performance, with sales up 13.1% YoY to 33.3 billion yen and a reduced operating loss of 1.5 billion yen (a 2.4 billion yen improvement YoY).
- The Ads business achieved record-high sales of 105.4 billion yen (up 9.1% YoY), but operating profit decreased by 37.4% YoY to 3.8 billion yen due to continued upfront investment.
- SG&A expenses increased by 5.2% YoY to 39.8 billion yen in Q3 FY2023.
+2
CyberAgent

Report34 pages
1Q FY2024 Presentation Material
The presentation outlines CyberAgent’s fiscal‑year 2024 first‑quarter performance, emphasizing a robust rebound across its three core businesses—Internet advertising, media (ABEMA), and game development. Consolidated sales reached ¥193 billion, up 15.2 % year‑over‑year, while operating profit climbed to ¥6.28 billion, a 7.5‑point increase from the prior year’s loss. The advertising arm delivered ¥105.3 billion in revenue, up 10.1 % YoY, and an operating profit of ¥5.6 billion, reflecting a 13.3 % YoY gain and sustained improvement in operating‑margin efficiency (OPM). Media operations posted ¥42.7 billion, a 27.8 % YoY rise, though operating loss narrowed to ¥0.9 billion, driven by reduced losses in ABEMA‑related activities. Game sales hit ¥45.0 billion, up 10.1 % YoY and 6.5 % QoQ; operating loss fell to ¥3.4 billion, a 32.9 % YoY decline and 42.4 % QoQ improvement, thanks to a new hit title.
Financial statements show total assets of ¥468.7 billion and shareholders’ equity of ¥129.0 billion, with cash deposits at ¥184.8 billion. SG&A expenses rose 8.1 % YoY to ¥43.7 billion, while headcount increased to 7,336 employees.
Strategically, the company targets a “growth phase” with new digital ad platforms (e.g., ANA Moment Ads), continued investment in ABEMA, and a pipeline of high‑quality games such as “Jujutsu Kaisen Phantom Parade.” Forecasts indicate that FY2024 operating profit will reach ¥30 billion, with sales projected at ¥750 billion. The presentation stresses a commitment to enhancing monetization, AI‑driven advertising efficiency, and extending game lifecycles to secure long‑term profitability.
- CyberAgent returned to profitability in 1Q FY2024 with ¥6.28 billion in operating profit, a significant recovery from the prior year's loss, on consolidated sales of ¥193 billion.
- The company projects full-year FY2024 performance to reach ¥750 billion in sales and ¥30 billion in operating profit.
- The game development segment saw sales rise 10.1% YoY to ¥45.0 billion, with operating losses narrowing by 32.9% YoY to ¥3.4 billion, largely driven by the success of the new title 'Jujutsu Kaisen Phantom Parade.'
- The internet advertising business remains the primary revenue driver, contributing ¥105.3 billion in revenue—a 10.1% YoY increase—and ¥5.6 billion in operating profit.
- Media operations, anchored by ABEMA, grew revenue by 27.8% YoY to ¥42.7 billion, successfully narrowing the segment's operating loss to ¥0.9 billion.
+2
CyberAgent

Report54 pages
FY2024 Presentation Material: October 2023 to September 2024
October 2023 to September 2024 The future information, such as earnings forecast, written in this document is based on our expectations and assumptions as of the date the forecast was made. Our actual results could differ materially from those described in this forecast because of various risks and uncertainties. 1. FY2024 Full Year Results (October 2023 -September 2024) 2. FY2025 Forecast (October 2024 -September 2025) 3. Internet Advertisement Business 6. Medium to Long-Term Strategy 7.
- Consolidated sales for FY2024 reached 802.9 billion yen, an 11.5% increase year-over-year, marking the 27th consecutive year of sales growth driven by strong performance in three key businesses.
- The company's full-year sales were 436.3 billion yen, up 7.6% year-over-year, indicating market share growth by outpacing overall market expansion.
- The dividend forecast has been raised to 16 yen from 15 yen, with a Dividend on Equity (DOE) guidance of 5%, and the company's ROE, dividend payout ratio, and DOE all exceed the TSE average.
- Operating loss significantly improved year-over-year, with FY2024 showing a 9.5 billion yen increase in operating income compared to the previous year.
- Sales from ABEMA and related businesses grew by 22.4% year-over-year to 107.5 billion yen in FY2024, primarily driven by ABEMA-related businesses and advertising.
+1
CyberAgent

Report43 pages
2Q FY2025 Financial Presentation Material
2Q FY2025 Presentation Material We corrected past annual securities reports and others due to the discovery of an inappropriate accounting treatment at the consolidated subsidiary. Please refer to the “Notice on Submission of Correction Reports of Past Annual Securities Reports and Amendments of Financial Statements for Past Fiscal Years” released on May 15, 2025, for details.
- The company achieved record-high sales of 217.3 billion yen in FY2025 Q2, up 1.2% YoY, with operating profit increasing by 0.7% YoY to 20.8 billion yen, primarily driven by Media & IP and Ad businesses.
- An inappropriate accounting treatment at a consolidated subsidiary led to corrections of past annual securities reports and amendments of financial statements, with details released on May 15, 2025.
- The Media & IP business saw significant growth, with sales up 14.4% YoY to 57.0 billion yen and operating profit increasing 6.5x YoY to 3.3 billion yen, through building a multi-layered revenue stream and investing in anime production.
- The Ad business maintained a high sales increase rate, up 9.9% YoY to 117.5 billion yen, and operating profit increased by 8.7% YoY to 6.0 billion yen, with an operating profit margin of 5.1%.
- Sales and profit in the game console game sector declined 23.4% YoY to 51.4 billion yen and 15.7% YoY to 15.3 billion yen respectively, despite a significant QoQ increase (34.6% in sales, 4.6x in OP) due to a game release in February 2024.
+2
CyberAgent

Report37 pages
1Q FY2025 Presentation Material
The presentation outlines CyberAgent’s FY 2025 financial outlook, operational highlights, and strategic priorities across its Media & IP, Internet Advertising, and Game divisions. FY 2025 revenue is projected at ¥820 billion with operating profit of ¥42 billion, representing 24.9 % and 19.8 % of the year‑to‑date targets, respectively. First‑quarter results show a 5.6 % YoY sales increase to ¥203.8 billion and a 32.1 % rise in operating profit to ¥8.3 billion, driven largely by a 10.5 % lift in Media & IP sales (¥55.6 billion) and an 11.8 % growth in Internet Advertising sales (¥117.7 billion). The Game segment, however, posted a 15.1 % YoY decline to ¥38.2 billion and a 4.1 % drop in operating profit, attributed to slower releases despite strong performance of new titles.
Operating margins improved from 3.3 % in FY 2024 to 4.1 % in FY 2025, supported by a 32 % increase in operating income. SG&A expenses rose 4.4 % YoY to ¥45.7 billion, while cash deposits increased 11.3 % YoY to ¥205.6 billion, reflecting liquidity strengthening.
Strategically, the company is shifting from a Media‑only model to an integrated Media & IP business, aiming to generate global IPs through ABEMA and new production units such as CA Soa Inc. The medium‑to‑long‑term plan emphasizes investment in high‑profit IP content, game development, and advertising technology leveraging AI to enhance ad effectiveness. The presentation also lists a pipeline of over six new games for FY 2025, including international releases, and outlines organizational changes to support the expanded IP focus.
- CyberAgent reported a 5.6% YoY revenue increase to ¥203.8 billion and a 32.1% rise in operating profit to ¥8.3 billion for 1Q FY2025.
- The Game segment underperformed, recording a 15.1% YoY revenue decline to ¥38.2 billion and a 4.1% drop in operating profit due to a slower release cadence.
- Growth was primarily driven by the Media & IP segment, which saw a 10.5% sales increase to ¥55.6 billion, and the Internet Advertising segment, which grew 11.8% to ¥117.7 billion.
- The company is pivoting to an integrated Media & IP strategy, utilizing ABEMA and new production units like CA Soa Inc. to develop global intellectual property.
- CyberAgent plans to bolster its gaming portfolio with a pipeline of over six new titles in FY2025, including several international releases.
+1
CyberAgent
Report1 pages
Financial Report for First Two Quarters: Fiscal 2026
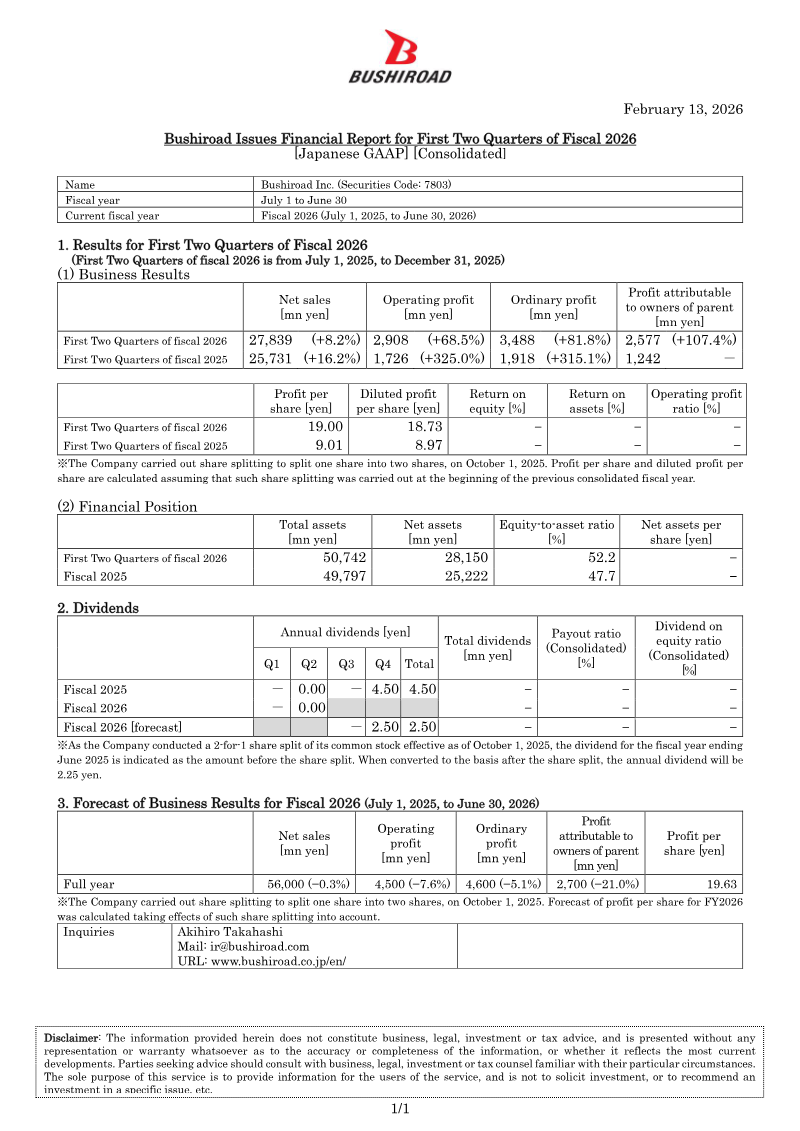
Bushiroad Inc. reports consolidated financial results for the first two quarters of fiscal 2026 (July 1–December 31, 2025). Net sales rose 8.2 % to ¥27,839 million, while operating profit increased 68.5 % to ¥2,908 million and ordinary profit grew 81.8 % to ¥3,488 million; profit attributable to owners of the parent company surged 107.4 % to ¥2,577 million. Earnings per diluted share reached ¥19.00, a significant jump from ¥9.01 in the same period of fiscal 2025, reflecting both higher profitability and a 2‑for‑1 share split executed on October 1, 2025. Total assets expanded to ¥50,742 million and net assets climbed to ¥28,150 million, raising the equity‑to‑asset ratio from 47.7 % to 52.2 %.
The company’s dividend policy for fiscal 2025 included a ¥4.50 million payout, while no dividends were declared in the first half of fiscal 2026; a forecast for the full year projects no dividend distribution.
For the full fiscal year 2026, Bushiroad forecasts net sales of ¥56,000 million (a slight decline of 0.3 % from the prior year), operating profit of ¥4,500 million (down 7.6 %), ordinary profit of ¥4,600 million (down 5.1 %), and profit attributable to the parent of ¥2,700 million (down 21.0 %). Earnings per share are projected at ¥19.63, adjusted for the share split.
These figures cover Bushiroad’s domestic Japanese operations under Japanese GAAP, with the fiscal year running from July 1 to June 30. The report relies on consolidated financial statements and includes a forward‑looking forecast based on current management expectations.
- Bushiroad Inc. reported strong growth for the first two quarters of fiscal 2026 (July 1–December 31, 2025), with net sales rising 8.2% to ¥27,839 million and operating profit surging 68.5% to ¥2,908 million.
- Profit attributable to owners of the parent company more than doubled, increasing 107.4% to ¥2,577 million compared to the same period in fiscal 2025.
- Earnings per diluted share reached ¥19.00, bolstered by improved profitability and a 2-for-1 share split implemented on October 1, 2025.
- The company’s balance sheet strengthened during the first half of the fiscal year, with total assets reaching ¥50,742 million and the equity-to-asset ratio improving to 52.2%.
- Despite the strong first-half performance, management forecasts a decline for the full fiscal year 2026, projecting net sales of ¥56,000 million (down 0.3%) and profit attributable to the parent of ¥2,700 million (down 21.0%).
+1
Bushiroad
Report1 pages
Financial Report for First Quarter of Fiscal 2026: Japan
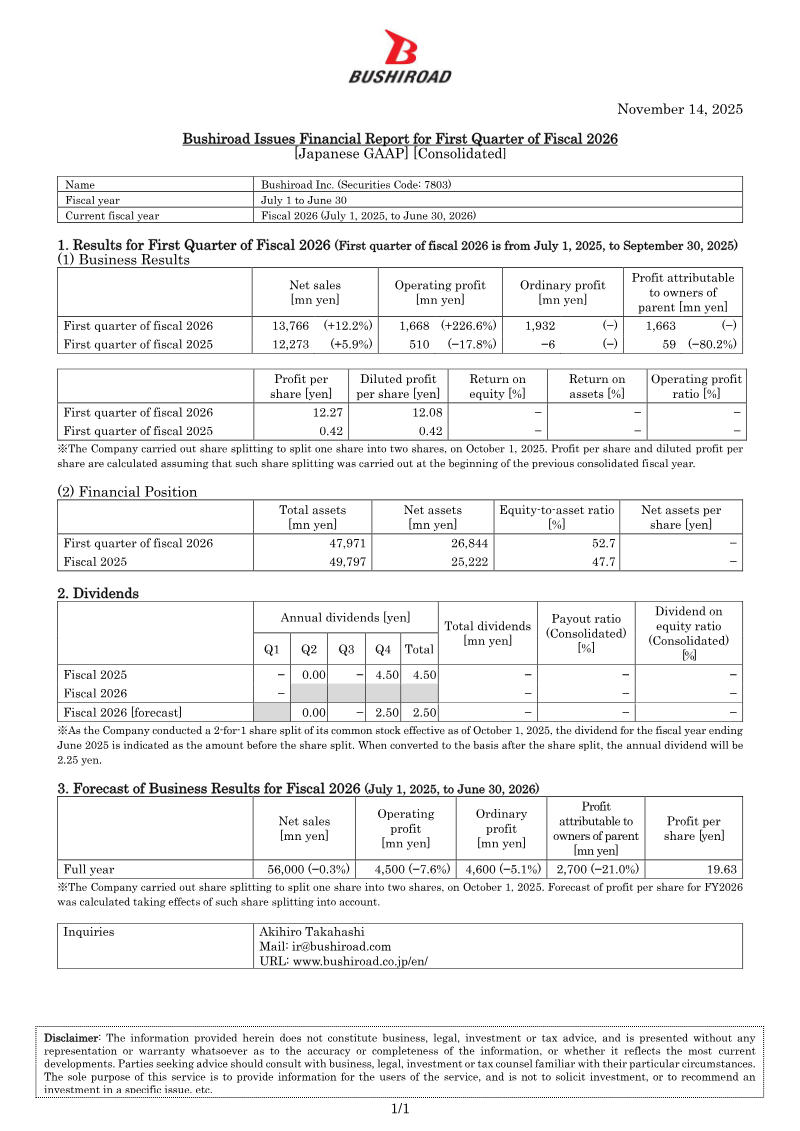
Bushiroad Inc., a Japanese entertainment company, reported first‑quarter fiscal 2026 results for the period July 1 to September 30, 2025. Net sales rose 12.2% year‑over‑year to ¥13,766 million, driven by stronger performance across its core card game and event‑ticket businesses. Operating profit surged 226.6% to ¥1,668 million, while ordinary profit reached ¥1,932 million, a reversal from the previous year’s operating loss of ¥510 million. Profit attributable to owners of parent companies stood at ¥1,663 million, up from a loss of ¥59 million in the same quarter of fiscal 2025. Earnings per share, adjusted for a 2‑for‑1 stock split effective October 1, 2025, climbed to ¥12.27.
Total assets for the quarter were ¥47,971 million, with net assets of ¥26,844 million, reflecting an equity‑to‑asset ratio increase to 52.7% from 47.7% in fiscal 2025. Net assets per share were not disclosed due to the recent split.
Dividend policy for fiscal 2025 showed a single payout of ¥4.50 per share in Q3, with no dividends announced for fiscal 2026 yet; a forecast indicates a potential ¥2.50 per share in Q4 after the split. The company projects full‑year 2026 net sales of ¥56,000 million (a slight decline of 0.3% from the prior year), operating profit of ¥4,500 million (down 7.6%), and ordinary profit of ¥4,600 million (down 5.1%). Forecasted earnings per share for FY2026 are ¥19.63, reflecting the impact of the share split.
These figures illustrate a rebound in profitability after a challenging prior year, with modest sales growth and an improving capital structure. The company’s guidance signals continued pressure on operating margins, likely due to rising content development costs and competitive market dynamics within Japan’s entertainment sector.
- Bushiroad Inc. achieved a significant financial turnaround in Q1 fiscal 2026, reporting an operating profit of ¥1,668 million compared to an operating loss of ¥510 million in the same period last year.
- Net sales for the quarter ending September 30, 2025, grew 12.2% year-over-year to ¥13,766 million, fueled by strong performance in the company's card game and event-ticket divisions.
- Profit attributable to owners of the parent company reached ¥1,663 million, marking a substantial recovery from the ¥59 million loss recorded in Q1 fiscal 2025.
- The company’s capital structure improved, with the equity-to-asset ratio rising to 52.7% from 47.7% in the previous fiscal year.
- Full-year fiscal 2026 projections anticipate a slight decline in performance, with forecasted net sales of ¥56,000 million and operating profit of ¥4,500 million, representing decreases of 0.3% and 7.6% respectively.
Bushiroad
Report6 pages
Consolidated Balance Sheets: FY2012-FY2013
The consolidated financial statements cover the fiscal years ending March 31, 2012 and March 31, 2013. Net sales fell from ¥13,334 million to ¥12,632 million, yet operating income rose from ¥2,194 million to ¥2,574 million, reflecting lower cost of sales and improved operating efficiency. Net income more than doubled, increasing from ¥749 million to ¥1,654 million, largely driven by a substantial extraordinary gain of ¥406 million on the sale of subsidiary shares and reduced operating expenses. Comprehensive income grew from ¥732 million to ¥1,691 million; foreign‑currency translation adjustments swung from a negative ¥5 million to a positive ¥36 million, offsetting other comprehensive losses.
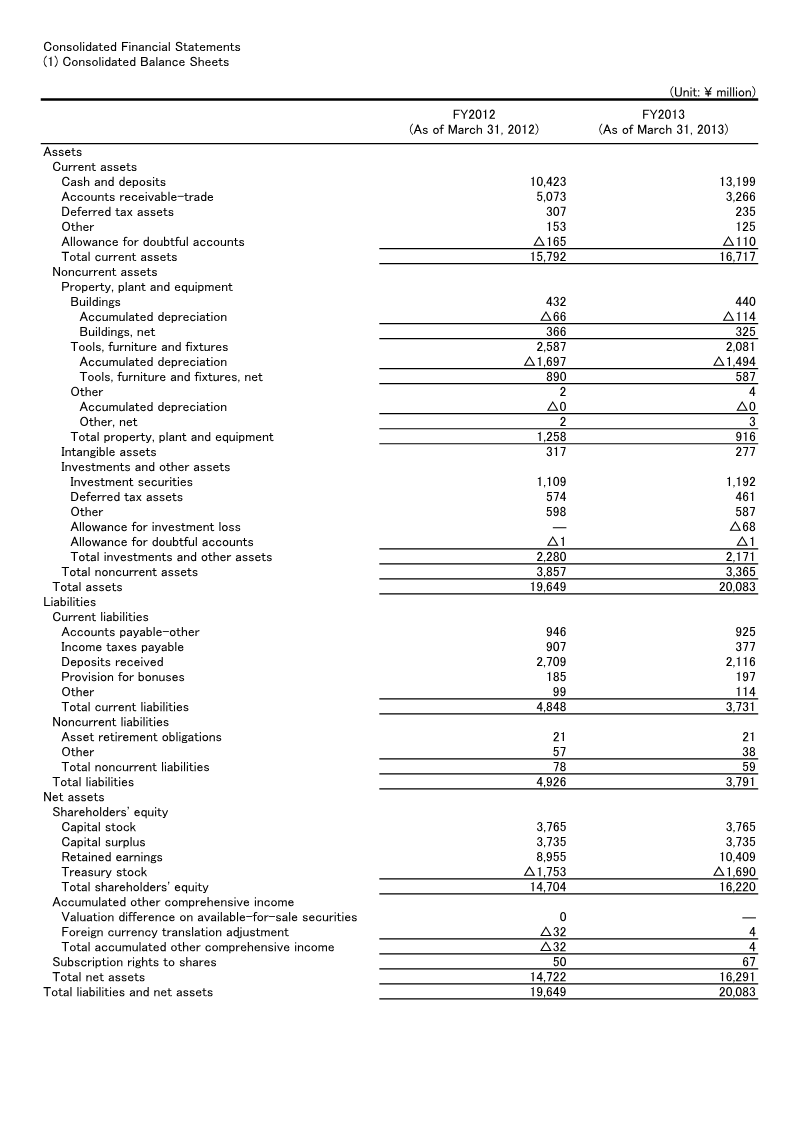
Assets increased from ¥19,649 million to ¥20,083 million. Current assets grew modestly, with cash and deposits rising by ¥2,776 million. Non‑current assets declined due to a reduction in property, plant and equipment net balance from ¥1,258 million to ¥916 million, reflecting asset disposals and depreciation. Liabilities fell from ¥4,926 million to ¥3,791 million, driven by lower current liabilities and a reduction in non‑current obligations. Shareholders’ equity expanded from ¥14,722 million to ¥16,291 million; retained earnings grew by ¥1,453 million, while treasury stock decreased in net value from a negative ¥1,753 million to a negative ¥1,690 million.
Cash flow analysis shows operating cash inflows rising from ¥1,043 million to ¥2,836 million. Investing activities remained negative, with a net outflow of ¥2,971 million in 2012 and ¥946 million in 2013, largely due to property, plant and equipment purchases. Financing cash flows were negative in both years, with treasury stock repurchases offset by modest dividend payments. The company’s liquidity improved, as cash and equivalents increased from ¥11,293 million to ¥9,199 million despite the net cash outflow in 2012. Overall, the firm strengthened profitability and equity while managing asset composition and cash flows over the two‑year period.
- Net income more than doubled from ¥749 million in FY2012 to ¥1,654 million in FY2013, bolstered by a ¥406 million extraordinary gain from the sale of subsidiary shares and reduced operating expenses.
- Operating income increased from ¥2,194 million to ¥2,574 million despite a decline in net sales from ¥13,334 million to ¥12,632 million, indicating improved operational efficiency and lower cost of sales.
- Shareholders' equity grew from ¥14,722 million to ¥16,291 million, supported by a ¥1,453 million increase in retained earnings.
- Total liabilities decreased significantly from ¥4,926 million to ¥3,791 million, reflecting reductions in both current and non-current obligations.
- Operating cash inflows saw substantial growth, rising from ¥1,043 million in FY2012 to ¥2,836 million in FY2013.
mixi
Report4 pages
Quarterly Consolidated Balance Sheets: 2Q FY2013
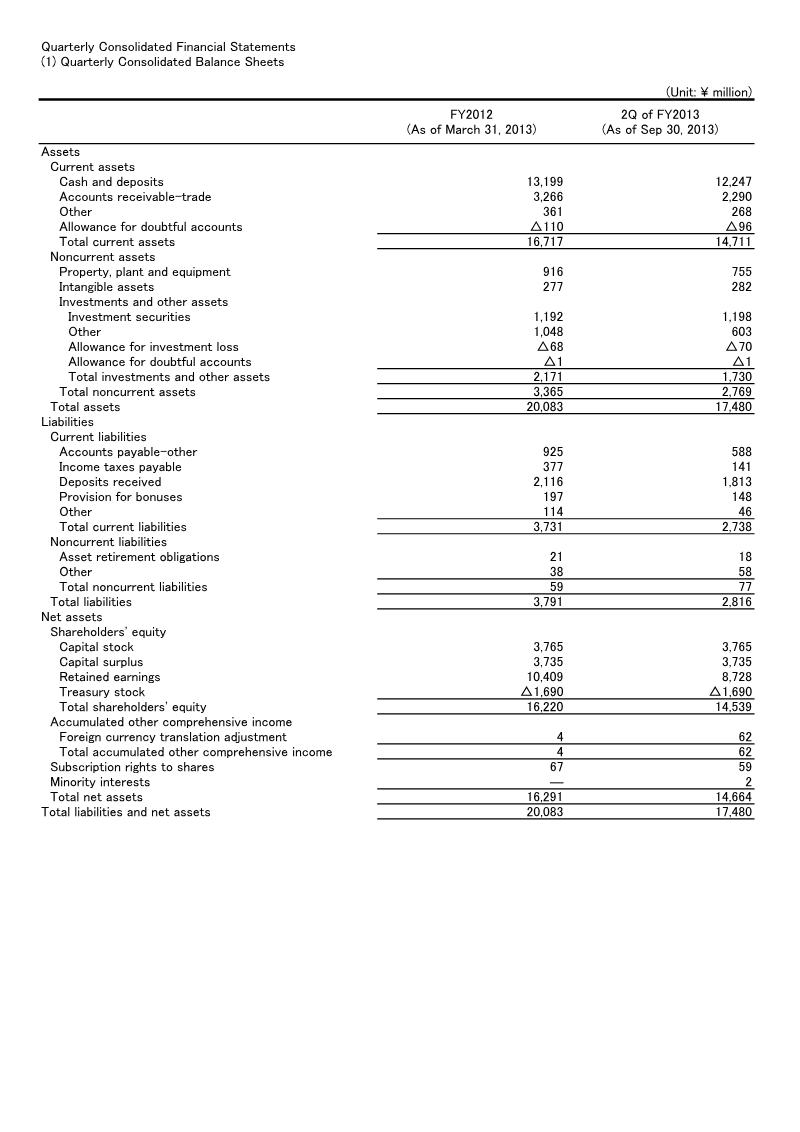
The quarterly consolidated balance sheet and income statements for the second quarter of fiscal year 2013 reveal a contraction in both operating performance and financial position compared with the same period of fiscal year 2012. Total assets fell from ¥20,083 million to ¥17,480 million, largely due to a reduction in current assets and non‑current investments. Current liabilities decreased from ¥3,731 million to ¥2,738 million, but shareholders’ equity declined from ¥16,291 million to ¥14,664 million, driven by a lower retained earnings balance and the continued impact of treasury stock.
Operating income swung from ¥1,612 million in 2Q FY2012 to a loss of ¥398 million in 2Q FY2013, reflecting higher selling, general and administrative expenses relative to sales. Net sales dropped by 41% from ¥6,817 million to ¥3,979 million, while cost of sales fell proportionally. Non‑operating losses increased sharply due to a ¥126 million loss on equity in affiliates and a ¥21 million loss on investments, offset only partially by foreign exchange gains of ¥20 million. Ordinary income turned negative, with a loss of ¥525 million in 2Q FY2013 versus a profit of ¥1,583 million previously.
Comprehensive income mirrored the net loss trend, reporting a ¥1,293 million loss attributable to owners of the parent in 2Q FY2013 versus a ¥1,184 million profit in 2Q FY2012. Cash flow analysis shows operating cash outflows of ¥448 million, a significant rise in investing cash inflows to ¥2,774 million—largely from sales of subsidiary shares—and financing outflows of ¥327 million due to dividend payments. Overall, the company experienced a notable decline in profitability and equity during the second quarter of FY2013.
- Net sales plummeted 41% year-over-year, falling from ¥6,817 million in 2Q FY2012 to ¥3,979 million in 2Q FY2013.
- Operating income shifted from a ¥1,612 million profit in 2Q FY2012 to a ¥398 million loss in 2Q FY2013, driven by high selling, general, and administrative expenses relative to sales.
- The company reported a net loss attributable to owners of the parent of ¥1,293 million for 2Q FY2013, a sharp reversal from the ¥1,184 million profit recorded in the same period of the previous year.
- Total assets contracted from ¥20,083 million to ¥17,480 million, while shareholders’ equity declined to ¥14,664 million due to lower retained earnings and treasury stock impact.
- Ordinary income turned negative, resulting in a loss of ¥525 million compared to a profit of ¥1,583 million in 2Q FY2012, exacerbated by ¥147 million in combined losses from equity in affiliates and investments.
mixi
Report2 pages
Mixi Report: FY2013 Business Results
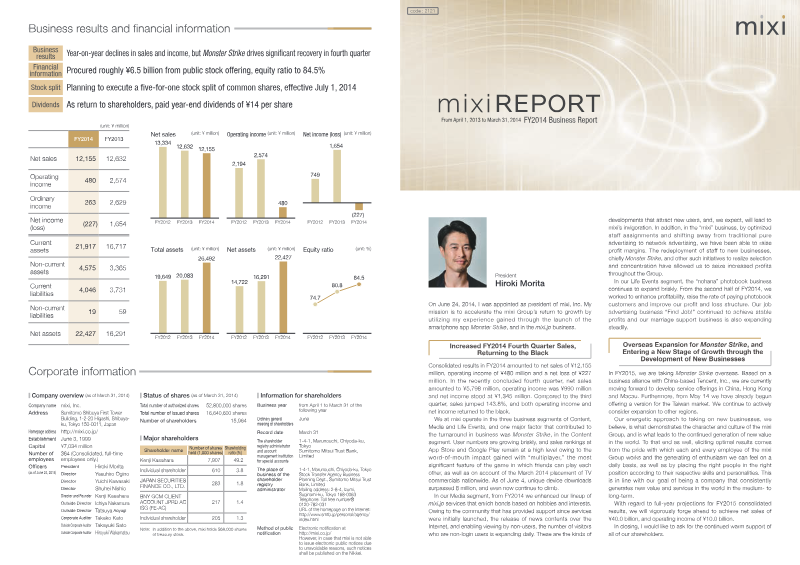
The FY2014 business results demonstrate a strategic pivot toward new growth areas after a period of declining sales and income. Net sales fell 3 % from ¥12,632 million in FY2013 to ¥12,155 million in FY2014, while operating income contracted sharply from ¥2,574 million to ¥480 million, resulting in a net loss of ¥227 million. The decline is largely attributed to reduced performance in the traditional “mixi” social networking segment, which has been restructured toward network advertising and staff redeployment to higher‑margin initiatives. In contrast, the Content Group’s flagship mobile game Monster Strike delivered a robust recovery: fourth‑quarter sales rose 143.8 % to ¥5,798 million, operating income reached ¥990 million, and net profit stood at ¥1,345 million. Monster Strike’s success is linked to aggressive marketing, including nationwide TV commercials and a focus on multiplayer features that encourage daily play among friends. The company plans to expand the game overseas, targeting China, Hong Kong, Macau, and Taiwan, with a partnership with Tencent to localize the service.
Other segments—Media and Life Events—continue to grow. The “nohana” photobook business achieved a 16 % increase in paid purchase rates, while the “Find Job!” job‑advertising service maintained a stable user base of 700 k members. Mixi’s equity ratio improved to 84.5 % after a ¥6.5 billion public offering, and a five‑for‑one stock split is scheduled for July 1 2014. Overall, the report highlights a shift from legacy social networking to diversified content and advertising services, with Monster Strike as the primary catalyst for returning profitability.
- Monster Strike drove a major recovery in Q4 FY2014, generating ¥5,798 million in sales—a 143.8% increase—and contributing ¥990 million in operating income.
- Mixi experienced an overall net loss of ¥227 million in FY2014, with net sales declining 3% to ¥12,155 million and operating income dropping to ¥480 million due to the decline of the legacy social networking segment.
- The company is aggressively expanding Monster Strike internationally through a partnership with Tencent to localize the game for markets in China, Hong Kong, Macau, and Taiwan.
- Mixi’s financial position was bolstered by a ¥6.5 billion public offering, improving the equity ratio to 84.5%, with a five-for-one stock split scheduled for July 1, 2014.
- The 'nohana' photobook business saw a 16% increase in paid purchase rates, while the 'Find Job!' service maintained a stable user base of 700,000 members.
+2
mixi
Report1 pages
Financial Highlights: 1st Quarter of Fiscal Year Ending March 2011
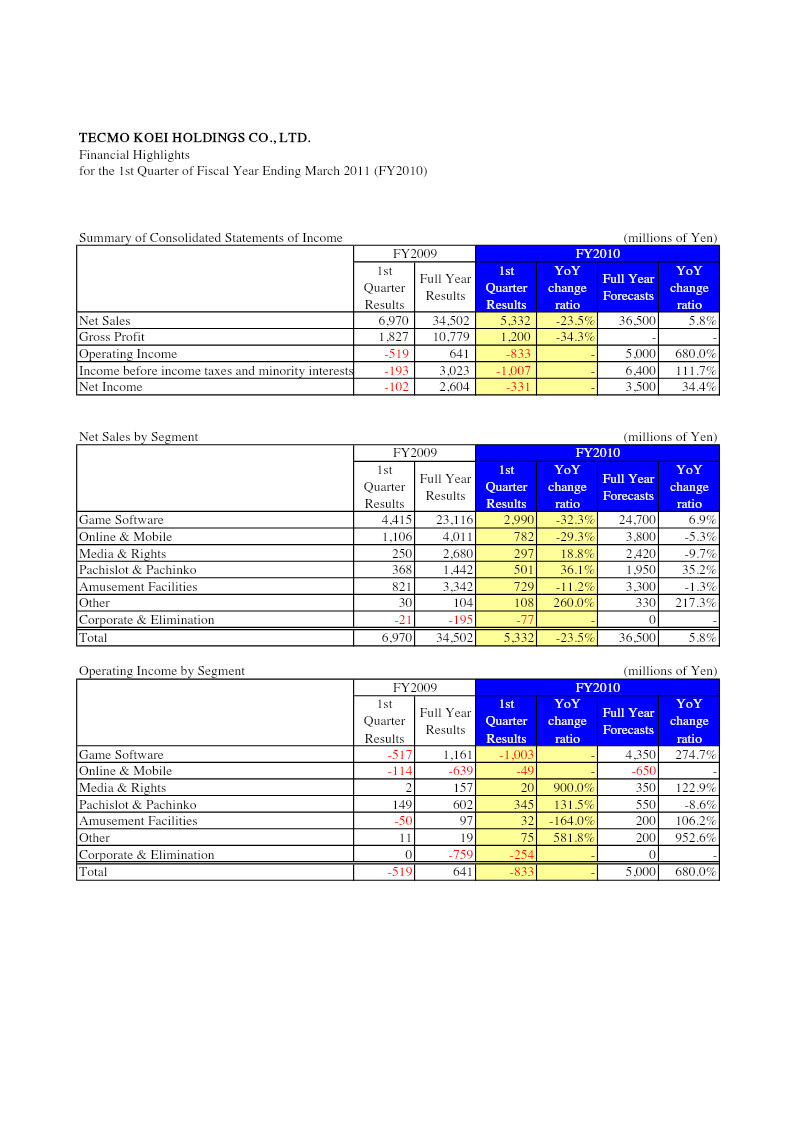
The financial highlights for the first quarter of fiscal year ending March 2011 reveal a mixed performance across Tecmo Koei Holdings’ operating segments. Net sales fell 23.5 % year‑over‑year to ¥34,502 million, driven mainly by declines in game software sales (−32.3 %) and online & mobile revenue (−29.3 %). In contrast, pachislot & pachinko sales rose 36.1 % to ¥1,442 million, while media & rights and amusement facilities experienced modest growth of 18.8 % and −11.2 %, respectively. The “Other” segment saw a sharp increase of 260 % to ¥104 million, though its absolute contribution remained small.
Operating income swung from a loss of ¥519 million in the same quarter of FY2009 to a profit of ¥641 million, an improvement of 1,160 million yen. This turnaround was largely attributable to game software operating income rising from a loss of ¥517 million to a profit of ¥1,161 million. Online & mobile income improved from a loss of ¥114 million to a profit of ¥639 million, while media & rights and pachislot & pachinko also posted gains. The “Other” segment’s operating income increased markedly, though its impact on total profitability was limited by the overall scale.
Net income shifted from a loss of ¥102 million to a profit of ¥2,604 million, reflecting the combined effect of stronger operating results and favorable tax treatment. Forecasts for the full year project net sales growth to 5.8 % and operating income to 680 %, indicating management’s expectation of a rebound in game software sales and continued strength in pachislot & pachinko. The analysis covers all business units within the company, with data expressed in millions of yen for FY2009 and FY2010, and includes year‑over‑year comparisons and forecasted full‑year figures.
- Tecmo Koei Holdings achieved a significant financial turnaround in Q1 FY2011, shifting from a ¥102 million net loss in the prior year to a ¥2,604 million profit.
- Operating income improved by ¥1,160 million year-over-year, moving from a ¥519 million loss to a ¥641 million profit, driven primarily by the game software and online & mobile segments.
- Total net sales for the quarter declined 23.5% year-over-year to ¥34,502 million, largely due to a 32.3% drop in game software sales and a 29.3% decrease in online & mobile revenue.
- The pachislot & pachinko segment bucked the downward trend in sales, recording a 36.1% increase to ¥1,442 million.
- Management projects a strong full-year recovery, forecasting 5.8% growth in net sales and a 680% increase in operating income.
Koei Tecmo
Report1 pages
Financial Highlights: Fiscal Year Ending March 2011
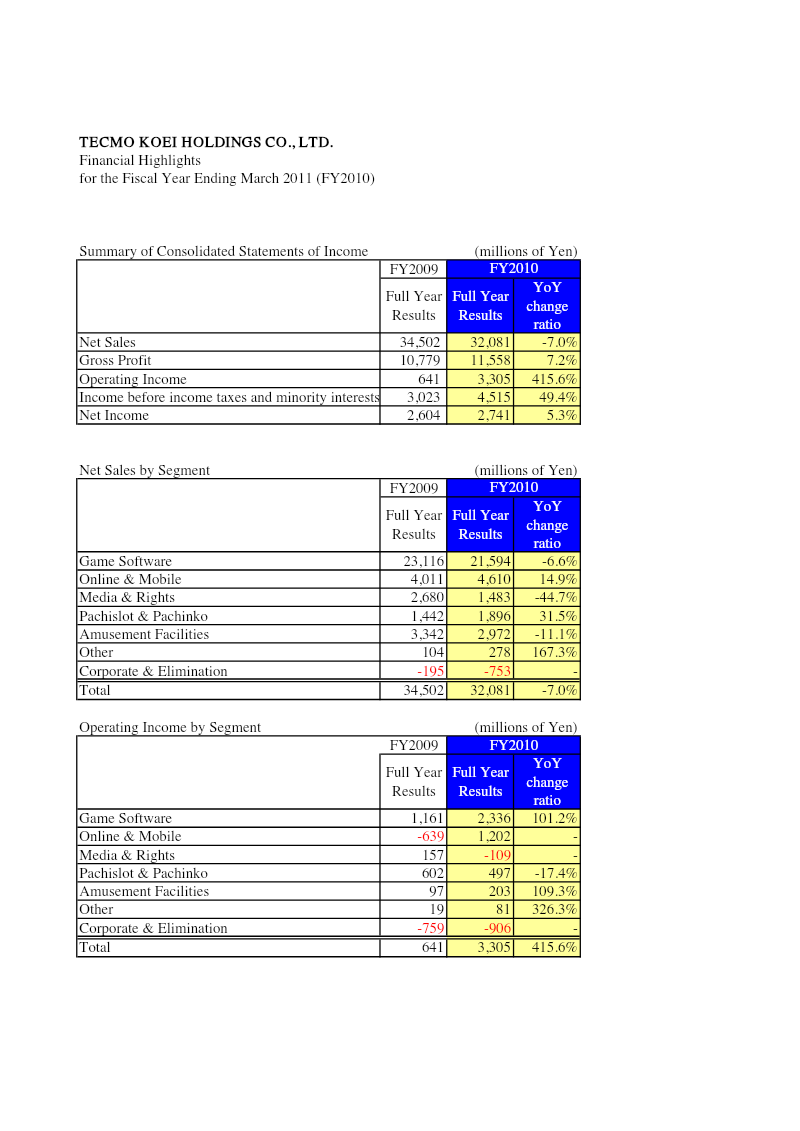
Financial highlights for the fiscal year ending March 2011 show a mixed performance for Tecmo Koei Holdings. Net sales fell 7 % to ¥32,081 million from ¥34,502 million in FY2009, driven mainly by declines in game software sales (‑6.6 %) and media & rights revenue (‑44.7 %). Conversely, online & mobile sales grew 14.9 %, and pachislot & pachinko revenue increased 31.5 %. The “Other” segment, largely comprising new or restructured businesses, surged 167.3 % to ¥278 million.
Operating income expanded dramatically by 415.6 %, rising from ¥641 million to ¥3,305 million. This surge was largely due to a 101.2 % jump in game software operating income and a 109.3 % increase in amusement facilities, offset by declines in pachislot & pachinko (‑17.4 %) and media & rights (negative contribution). The “Other” segment contributed a 326.3 % increase in operating income, reflecting successful new initiatives.
Income before taxes and minority interests grew 49.4 % to ¥4,515 million, while net income increased modestly by 5.3 % to ¥2,741 million. The company’s profitability improved despite lower sales volumes, largely through cost efficiencies and higher-margin segments.
The analysis covers Japan‑based operations for FY2010, using consolidated financial statements. Data are presented in millions of yen, with year‑over‑year comparisons highlighting key segment shifts and overall profitability trends.
- Tecmo Koei Holdings achieved a 415.6% surge in operating income to ¥3,305 million for the fiscal year ending March 2011, despite a 7% decline in net sales to ¥32,081 million.
- Profitability improved significantly through cost efficiencies and high-margin performance, resulting in a 49.4% increase in income before taxes and minority interests to ¥4,515 million.
- The core game software segment saw a 6.6% decline in sales but experienced a 101.2% jump in operating income, indicating a shift toward more profitable operations.
- Revenue diversification efforts showed mixed results, with online & mobile sales growing 14.9% and pachislot & pachinko revenue rising 31.5%, though the latter saw a 17.4% decline in operating income.
- The 'Other' business segment, focused on new initiatives, demonstrated strong growth with a 167.3% increase in sales to ¥278 million and a 326.3% rise in operating income.
+1
Koei Tecmo
Report1 pages
Financial Highlights: 1st Quarter of the Fiscal Year Ending March 2012
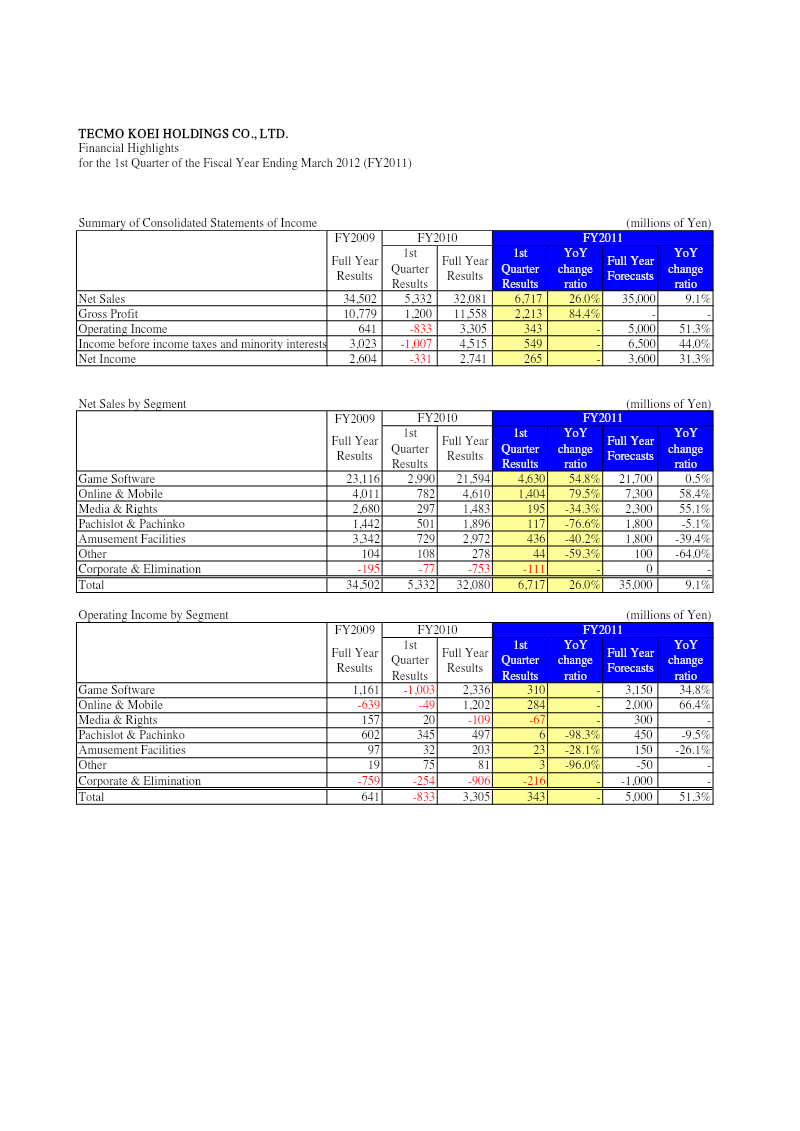
The financial highlights present Tecmo Koei Holdings’ performance for the first quarter of fiscal year 2011, ending March 31, 2012. Net sales rose 26 % year‑over‑year to ¥34.5 billion, driven primarily by the Game Software segment, which generated ¥23.1 billion in sales and contributed a 54.8 % increase from the previous year’s first quarter. Online & Mobile sales also grew strongly, up 79.5 % to ¥4.6 billion, while Media & Rights and Pachislot & Pachinko segments declined sharply by 34.3 % and 76.6 %, respectively. Amusement Facilities sales fell 40.2 %. Corporate and elimination items offset gains, resulting in a net income of ¥2.6 billion, up 31.3 % from the prior year’s first quarter.
Operating income improved markedly to ¥641 million, a 51.3 % increase from the prior year’s first quarter, largely due to gains in Game Software (¥1.16 billion) and Online & Mobile (¥1.20 billion). However, the Media & Rights segment posted a loss of ¥109 million, and Pachislot & Pachinko’s operating income fell 98.3 % to ¥497 million, reflecting a significant downturn in that business line.
The report covers Japan‑based operations across five core segments—Game Software, Online & Mobile, Media & Rights, Pachislot & Pachinko, and Amusement Facilities—over the first quarter of FY2011. Data are presented in millions of yen, with year‑on‑year comparisons and forecasts for the full fiscal year. The methodology relies on consolidated financial statements, with no explicit survey or sampling details disclosed. Overall, the company experienced robust growth in its core gaming and online divisions, offset by declines in traditional gambling‑related businesses.
- Tecmo Koei Holdings reported a 26% year-over-year increase in net sales to ¥34.5 billion and a 31.3% rise in net income to ¥2.6 billion for the first quarter of the fiscal year ending March 2012.
- The Game Software segment was the primary growth driver, generating ¥23.1 billion in sales—a 54.8% increase compared to the same period in the previous year.
- The Online & Mobile segment experienced significant expansion, with sales rising 79.5% to ¥4.6 billion and contributing ¥1.20 billion to operating income.
- Operating income for the company reached ¥641 million, a 51.3% improvement year-over-year, bolstered by strong performance in the gaming and online divisions.
- The Pachislot & Pachinko segment suffered a major downturn, with sales falling 76.6% and operating income declining by 98.3% to ¥497 million.
+1
Koei Tecmo