Report103 pages
Annual Report 2019: Shaping the Future of Entertainment
Corporate responsibility and sustainability priorities are covered in MTG’s Annual Corporate Responsibility Report, published 19 S EGMENTAL PERFORMANCE 31 Other Group Information 34 Financial Policies and Risk Management 36 Governance and Responsibilities 41 Internal Control Report 101 ALTERNATIVE PERFORMANCE It’s impossible to reflect on 2019 without first commenting on the split of MTG into two companies in March – Nordic Enter- tainment and new MTG.
- MTG's 2019 strategy focused on profitable growth in esports and gaming, driven by the ESL Pro Tour launch, Kongregate's revised strategy, and Innogames' mobile revenue optimization.
- MTG divested Nova Broadcasting Group in Bulgaria for EUR 185 million (SEK 1,917 million) in January 2019 and Zoomin in October 2019, to focus on its core esports and gaming verticals.
- MTG announced annual savings, redundancy costs, and impairment charges in 2019 as part of a strategic review and evaluation of its gaming portfolio.
- MTG's esports vertical, comprising ESL and DreamHack, saw external sales of SEK 1,712 million in 2019, up from SEK 1,515 million in 2018, but reported an EBIT loss of SEK -430 million.
- The gaming vertical generated SEK 2,531 million in external sales in 2019, an increase from SEK 2,296 million in 2018, with an EBIT of SEK 269 million.
+1
Modern Times Group
Report10 pages
Q4 2025 Investor Presentation
The Q4 2025 investor presentation details a period of record financial performance for the company, characterized by significant revenue growth and successful strategic integration. The primary thesis centers on the company’s transformative year, highlighted by the successful consolidation of Plarium and a shift toward a midcore gaming focus. For the fourth quarter of 2025, the company achieved net sales of SEK 3,123 million, representing an 8% organic growth rate and a 108% increase in constant currency year-over-year. Adjusted EBITDA reached SEK 717 million, maintaining a 23% margin, while unlevered free cash flow totaled SEK 878 million with a 66% conversion rate.
The scope of the report covers the global gaming operations of the company throughout the 2025 fiscal year, with specific emphasis on the fourth quarter. Key operational findings indicate that user acquisition (UA) spending rose to 38% of revenue in Q4, a 98% year-over-year increase in constant currency, largely driven by the integration of Plarium and the scaling of casual and racing franchises. Revenue streams showed a notable shift, with direct-to-consumer contributions rising 600 basis points to 32% of the total. Franchise performance was bolstered by strong results in the racing and word game segments, which saw year-over-year growth of 43% and 28%, respectively.
Methodologically, the financial data is presented on a reported basis, with constant currency adjustments applied to isolate organic growth trends. The report incorporates full-year 2025 figures and highlights the impact of the Plarium acquisition, which was integrated into the group starting in February 2025. Looking ahead, the company concludes the period with a stable leverage ratio and a new organizational structure, positioning itself for continued midcore expansion and the potential public offering of its PlaySimple division.
- The company achieved Q4 2025 net sales of SEK 3,123 million, marking 8% organic growth and a 108% year-over-year increase in constant currency.
- Adjusted EBITDA for Q4 2025 reached SEK 717 million with a 23% margin, supported by an unlevered free cash flow of SEK 878 million.
- User acquisition spending surged to 38% of revenue in Q4, representing a 98% year-over-year increase driven by the integration of Plarium and scaling of casual and racing franchises.
- Direct-to-consumer revenue contributions grew by 600 basis points to reach 32% of total Q4 revenue.
- Key franchise segments showed strong momentum, with racing games growing 43% and word games growing 28% year-over-year.
+5
Modern Times Group

Report12 pages
Q1 2025 Investor Presentation
The Modern Times Group Q1 2025 investor presentation outlines a period of significant financial expansion, primarily driven by the strategic acquisition of Plarium. The company reported a 79% year-over-year increase in net sales in constant currencies, reaching SEK 2,557 million for the quarter. This growth is supported by a 6% organic sales increase, reflecting sustained performance across the company’s existing gaming portfolio.
Key operational metrics highlight the impact of the Plarium integration, which contributed to a shift in revenue streams and user development. The company maintained a healthy adjusted EBITDA margin of 24% for the quarter, despite increased investment in marketing to scale new and established titles. Cash flow remains a central pillar of the company’s financial health, with SEK 538 million generated from operations in Q1 2025 and a free cash flow of SEK 143 million after accounting for earnout payments. The company’s leverage ratio stands at 0.82x, supported by an LTM EBITDA of SEK 3,058 million.
The scope of the presentation covers the global gaming operations of the company, with a specific focus on the transition period following the February 1, 2025, consolidation of Plarium. The portfolio includes a diverse range of franchises, such as strategy, simulation, racing, and word games. Looking ahead, the company maintains a positive outlook for the full year 2025, projecting organic sales growth between 3% and 7% and an adjusted EBITDA margin in the range of 21% to 24%. Future performance is expected to depend on disciplined marketing investments, the successful scaling of new game titles, and continued geographical expansion efforts.
- Modern Times Group achieved a 79% year-over-year increase in net sales to SEK 2,557 million in Q1 2025, largely driven by the acquisition of Plarium.
- The company maintained a 24% adjusted EBITDA margin for the quarter while balancing increased marketing investments to scale its gaming portfolio.
- Organic sales grew by 6% in Q1 2025, reflecting stable performance across existing titles alongside the integration of Plarium, which was consolidated on February 1, 2025.
- Operational cash flow reached SEK 538 million, with a free cash flow of SEK 143 million recorded after accounting for earnout payments.
- The company reports a leverage ratio of 0.82x, supported by an LTM EBITDA of SEK 3,058 million.
Modern Times Group
Report26 pages
Q4 2025 Financial Report
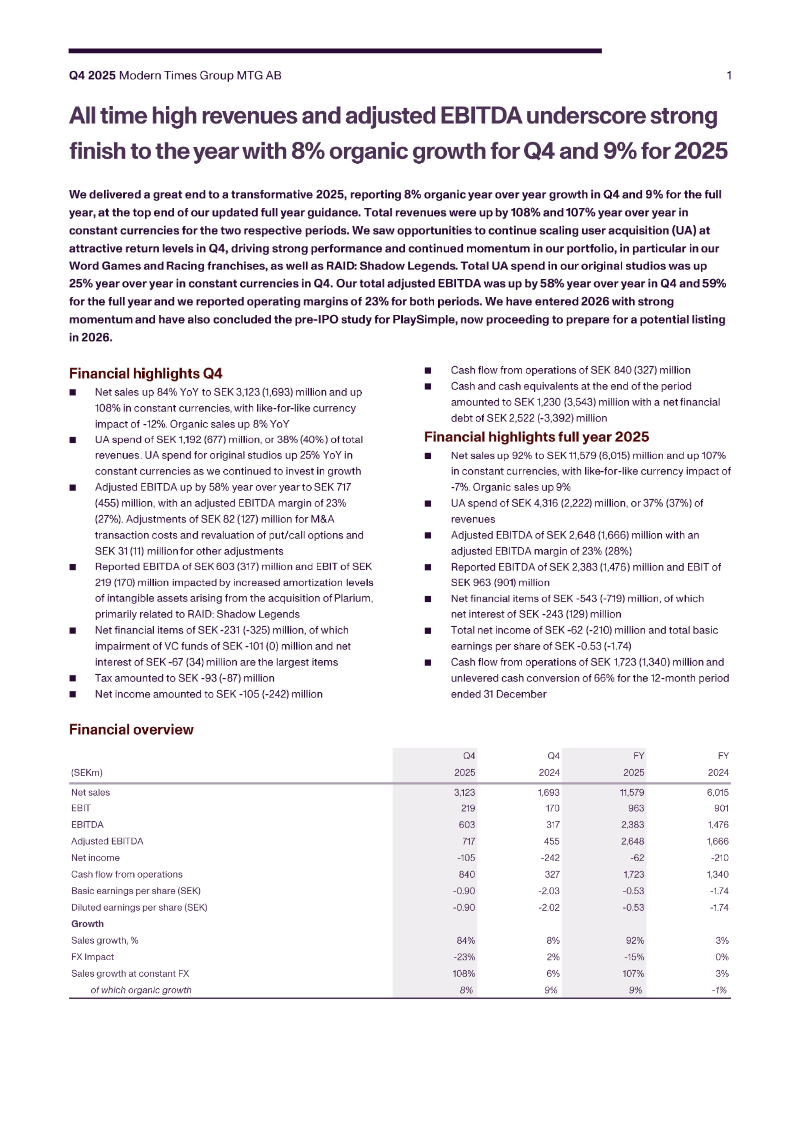
Q4 2025 Modern Times Group MTG AB 1 All time high revenues and adjusted EBITDA underscore strong finish to the year with 8% organic growth for Q4 and 9% for 2025 We delivered a great end to a transformative 2025, reporting 8% organic year over year growth in Q4 and 9 % for the full year ,at the top end of our updated full year guidance .
- MTG AB achieved all-time high revenues and adjusted EBITDA in Q4 2025, with 8% organic growth for the quarter and 9% for the full year 2025. Total revenues were up 108% in Q4 and 107% for the full year in constant currencies, while adjusted EBITDA increased by 58% in Q4 and 59% for the full year.
- Net sales for Q4 2025 reached SEK 3,123 million, an 84% increase year-over-year. Full-year net sales for 2025 were SEK 11,579 million, up 92% from 2024.
- The strong performance was driven by scaling user acquisition (UA) at attractive return levels, particularly in Word Games and Racing franchises, and RAID: Shadow Legends. Total UA spend in original studios increased by 25% year-over-year in Q4 in constant currencies.
- MTG has concluded a pre-IPO study for PlaySimple and is now preparing for a potential listing in 2026, which is seen as an opportunity to accelerate M&A ambitions in the casual gaming market.
- Plarium's consolidation from February 1, 2025, significantly impacted sales growth, contributing SEK 1,464 million to Q4 sales. The acquisition's effect on sales for the full year 2025 was SEK 5,384 million.
+1
Modern Times Group
Report110 pages
2021 Interim Report
Incorporated in the Cayman Islands with limited liability 3 Financial Performance Highlights 3 Financial Performance Highlights 9 Management Discussion and Analysis 9 Management Discussion and Analysis 23 Report on Review of Interim Financial Information Report on Review of Interim Financial Information 24 Consolidated Income Statement 25 Consolidated Statement of Comprehensive Income 26 Consolidated Statement of Financial Position 29 Consolidated Statement o...
- Tencent's FinTech and Business Services revenue significantly increased, reaching RMB 80,920 million for the six months ended June 30, 2021, up from RMB 56,337 million in the same period of 2020.
- The company experienced a shift from net cash of RMB 5.6 billion as of March 31, 2021, to net debt of RMB 21.0 billion as of June 30, 2021, primarily due to M&A activities and dividend payments, partially offset by RMB 17.3 billion in free cash flow.
- Tencent's Value Added Services (VAS) revenue grew to RMB 144,456 million for the six months ended June 30, 2021, compared to RMB 127,431 million in the prior year, with games contributing RMB 86,620 million and social networks RMB 57,836 million.
- Online Advertising revenue increased to RMB 44,653 million for the six months ended June 30, 2021, up from RMB 36,265 million in the same period of 2020, driven by social and other advertising.
- Selling and marketing expenses rose by 17% quarter-on-quarter to RMB 10.0 billion in Q2 2021, mainly due to seasonality and increased spending on digital content, games, and Business Services.
+2
Tencent
Report122 pages
2025 Interim Report
Incorporated in the Cayman Islands with limited liability smart communication inspires 2025 E Interim Report 33 Financial Performance Highlights Financial Performance Highlights 88 Management Discussion and Analysis 22 Report on Review of Interim Financial Information 23 Condensed Consolidated Income Statement 24 Condensed Consolidated Statement of Comprehensive Income 24 Condensed Consolidated Statement of Comprehensive Income 25 Condensed Consolidated S...
- Tencent's investment portfolio significantly grew to RMB948.3 billion as of June 30, 2025, up from RMB817.7 billion at the end of 2024, with listed associate investments alone increasing to RMB165.3 billion from RMB149.6 billion.
- The company completed the acquisition of a game company for USD1.2 billion (RMB8.8 billion) during the first half of 2025, resulting in RMB5.2 billion in goodwill.
- Gross profit for Marketing Services increased by 16% quarter-on-quarter to RMB20.6 billion, with gross margin improving to 58% from 56%.
- Gross profit for FinTech and Business Services rose by 5% quarter-on-quarter to RMB29.0 billion, with gross margin increasing to 52% from 50%.
- Net cash decreased to RMB74.6 billion as of June 30, 2025, from RMB90.2 billion as of March 31, 2025.
+1
Tencent
Report282 pages
2023 Annual Report: Tencent Holdings
7 MANAGEMENT DISCUSSION AND ANALYSIS 85 CORPORATE GOVERNANCE REPORT 85 CORPORATE GOVERNANCE REPORT 119 INDEPENDENT AUDITOR'S REPORT 119 INDEPENDENT AUDITOR’S REPORT 128 CONSOLIDATED INCOME STATEMENT 128 CONSOLIDATED INCOME STATEMENT 129 CONSOLIDATED STATEMENT OF COMPREHENSIVE INCOME 130 CONSOLIDATED STATEMENT OF FINANCIAL POSITION 133 CONSOLIDATED STATEMENT OF CHANGES IN EQUITY 137 CONSOLIDATED STATEMENT OF CASH FLOWS 139 NOTES TO THE CONSOLIDATED FINANCIAL STATEMENTS 1...
- Tencent's revenues for Q4 2023 remained broadly stable quarter-on-quarter at RMB155.2 billion.
- International Games revenues increased by 5% quarter-on-quarter to RMB13.9 billion, driven by PUBG Mobile and Clash of Clans.
- Domestic Games revenues decreased by 18% quarter-on-quarter to RMB27.0 billion due to seasonally lower revenue accruals in Q4.
- Online Advertising revenues increased by 16% to RMB29.8 billion, attributed to advertising platform upgrades benefiting Video Accounts, the mobile ad network, and Weixin Moments.
- Social Networks revenues decreased by 5% to RMB28.2 billion due to lower revenue accruals from app-based game virtual item sales.
+1
Tencent
Report122 pages
2024 Interim Report
Incorporated in the Cayman Islands with limited liability smart communication inspires 2024 P Interim Report 33 Financial Performance Highlights Financial Performance Highlights 88 Management Discussion and Analysis 22 Report on Review of Interim Financial Information 23 Condensed Consolidated Income Statement 23 Condensed Consolidated Income Statement 24 Condensed Consolidated Statement of Comprehensive Income 24 Condensed Consoli...
- Tencent's profit for Q2 2024 significantly increased to RMB 48,366 million, up from RMB 27,023 million in Q2 2023.
- Revenues for Q2 2024 grew to RMB 161,117 million, compared to RMB 149,208 million in Q2 2023.
- The company's net cash position decreased from RMB 92.5 billion as of March 31, 2024, to RMB 71.8 billion as of June 30, 2024, primarily due to share repurchases and dividend payments.
- Tencent's employee count slightly increased to 105,506 as of June 30, 2024, from 104,503 as of June 30, 2023.
- The weighted average fair value of employee share options granted in the first six months of 2024 was HKD 103.11 per share (RMB 93.53), a decrease from HKD 132.11 per share (RMB 115.67) in the same period of 2023.
+1
Tencent

Report60 pages
Gamedev Salary Pulse 2026: North America, Western Europe, Nordics, Central and Eastern Europe
The game development industry is currently navigating a period of profound structural instability, characterized by widespread workforce reductions and a pervasive sense of professional anxiety. Despite the rapid integration of artificial intelligence, the primary driver of current career displacement remains studio restructuring rather than technological replacement. While the majority of the workforce remains employed in hybrid or remote roles, a significant portion of professionals are actively reassessing their career trajectories. This climate of cautious realism is reflected in market sentiment, where nearly 40 percent of industry participants anticipate further decline, leading to increased emotional fatigue and a shift in priorities toward time-based benefits, such as the four-day workweek, over traditional office perks.
Geographically, the industry maintains a clear hierarchy in compensation, with North America consistently commanding the highest salary tiers across all seniority levels. In contrast, Central and Eastern Europe continue to function as the most cost-effective hubs for talent acquisition. This regional disparity underscores a broader trend of geographic diversification, as studios balance the need for specialized expertise with the economic realities of global operations. Although the workforce remains mobile, the prevalence of remote work has effectively anchored many professionals, creating a distinct divide where on-site employees demonstrate a significantly higher propensity for international relocation compared to their remote counterparts.
The current landscape is defined by a maturing workforce dominated by mid-to-senior level professionals, accompanied by a concerning decline in new entrants. This demographic shift, coupled with the ongoing volatility in employment, has necessitated more flexible recruitment strategies. Studios are increasingly moving away from traditional hiring models, favoring diverse solutions that range from subscription-based flat-fee packages to comprehensive recruitment process outsourcing. As the industry continues to evolve, these data-driven benchmarks serve as a critical framework for both studios and professionals attempting to navigate the complexities of global compensation and shifting labor market dynamics.
- Nearly 40 percent of game industry professionals anticipate further market decline, driving a shift in worker priorities toward time-based benefits like the four-day workweek over traditional office perks.
- Workforce reductions and studio restructuring remain the primary drivers of career displacement, significantly outpacing job losses attributed to artificial intelligence integration.
- North America maintains the highest global salary tiers for all seniority levels, while Central and Eastern Europe remain the most cost-effective regions for talent acquisition.
- The industry is experiencing a demographic shift characterized by a maturing workforce of mid-to-senior level professionals and a concerning decline in new entrants.
- Remote work has anchored the workforce, resulting in a clear divide where on-site employees are significantly more likely to relocate internationally than their remote counterparts.
+3
8BitMar 2026

Report14 pages
UnitedHealth Group: First Quarter 2025 Results and Revised Guidance
alth Group Reports First Quarter 20a UnitedHealth Group Reports First Quarter 2025 Results and Revises Full Year Guidance • Revised 2025 Earnings Outlook to $24.65 to $25.15 Per Share, Adjusted Earnings • First Quarter Earnings were $6.85 Per Share, Adjusted Earnings $7.20 Per Share • Revenues of $109.6 Billion Grew $9.8 Billion Year-Over-Year • Consumers Served by UnitedHealthcare Increased by 780,000 Year to Date • Optum Health Continues to Expect to Serve 650,000 New Value...
- UnitedHealth Group revised its 2025 earnings outlook to $24.65-$25.15 per share (net) and $26-$26.50 per share (adjusted), following first-quarter adjusted earnings of $7.20 per share.
- First-quarter 2025 revenues grew by $9.8 billion year-over-year to $109.6 billion, with earnings from operations reaching $9.1 billion.
- The company returned nearly $5 billion to shareholders in Q1 2025 through dividends and share repurchases, achieving a 26.8% return on equity.
- UnitedHealthcare increased its consumers served by 780,000 year-to-date, while Optum Health expects to serve 650,000 new value-based care patients in 2025.
- The medical care ratio increased to 84.8% in Q1 2025 from 84.3% in Q1 2024, primarily due to Medicare funding reductions and higher senior care activity, partially offset by Medicare Part D program changes.
+2
UnitedHealth Group
Report2 pages
Q1 2026 Market Themes to Watch
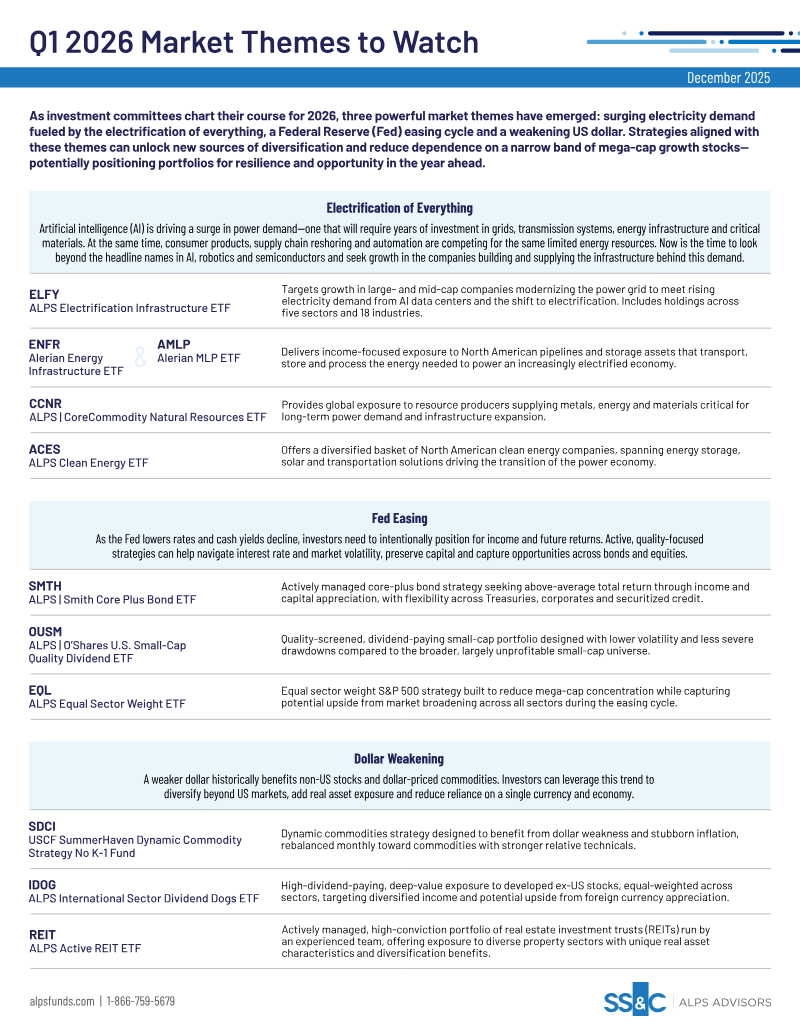
Investment committees navigating the 2026 landscape are advised to pivot toward three primary market themes: the widespread electrification of the global economy, the Federal Reserve’s interest rate easing cycle, and the depreciation of the US dollar. These trends offer a strategic framework for diversifying portfolios beyond the narrow concentration of mega-cap growth stocks, potentially enhancing resilience and capturing emerging opportunities across various asset classes.
The surge in power demand, driven by artificial intelligence, data center expansion, and industrial automation, necessitates significant capital allocation toward infrastructure. Rather than focusing solely on headline technology firms, investors are encouraged to target the underlying grid modernization, energy transmission, and critical material supply chains. This thematic shift encompasses North American energy pipelines, clean energy solutions, and global natural resource producers, all of which are essential to sustaining an increasingly electrified economy.
Simultaneously, the transition toward lower interest rates requires a shift in focus toward quality-oriented income strategies. As cash yields decline, active management in fixed income and the inclusion of quality-screened, dividend-paying small-cap equities can help mitigate volatility and reduce reliance on unprofitable market segments. Furthermore, the anticipated weakening of the US dollar provides a catalyst for diversifying into non-US developed markets and real assets, such as commodities and real estate investment trusts. By rebalancing toward these sectors, investors can hedge against currency risk and inflation while positioning for broader market participation across international and domestic landscapes.
- Investors should pivot from mega-cap growth stocks toward infrastructure assets that support the electrification of the economy, including grid modernization, energy transmission, and critical material supply chains.
- The surge in power demand driven by AI, data centers, and industrial automation necessitates capital allocation into North American energy pipelines, clean energy solutions, and global natural resource producers.
- The Federal Reserve’s interest rate easing cycle requires a shift toward quality-oriented income strategies, such as active fixed-income management and dividend-paying small-cap equities, to replace declining cash yields.
- Anticipated depreciation of the US dollar creates a strategic opportunity to diversify portfolios into non-US developed markets to hedge against currency risk.
- Real assets, including commodities and real estate investment trusts (REITs), should be utilized to hedge against inflation and capture broader market participation as the dollar weakens.
+2
GameVault System
Report7 pages
Video Games Ecosystem Report: Cyprus 2025
The report outlines a rapidly expanding video‑games ecosystem in Cyprus, projecting market revenue to surge from $1.2 billion in 2023 to $6.7 billion by 2025, with a compound annual growth rate of 5.96 % through 2030. The growth is driven by a growing number of tech firms relocating to the island, with 282 startups reported in July 2025—39 funded, 15 in Series A rounds, and one unicorn. Over 600 companies of varying sizes now operate locally, benefiting from Cyprus’s favorable tax regime, EU membership, and supportive regulatory framework.
Key success stories highlight local studios such as MY.GAMES and Ludus, whose mobile titles have achieved multi‑million downloads and cross‑platform revenue streams exceeding $2 million. The mobile segment dominates, with Playrix, Easybrain, and Outfit7 leading in casual and puzzle games; yet PC and console titles from Wargaming and Digital Vortex Entertainment demonstrate a growing presence in the market. Cross‑platform development and cloud gaming are emerging trends, offering opportunities for developers skilled across mobile and PC.
The island’s advantages include competitive corporate tax rates, strategic positioning between Europe and the Middle East, a growing talent pool enriched by relocation of experienced developers, and increasing investment in esports and blockchain gaming. The report also promotes the WN Conference Cyprus (September 2025) as a networking and market‑entry platform, anticipating attendance of 700+ participants. Overall, the data portray Cyprus as an attractive hub for game development and investment, poised for continued expansion through 2030.
- Cyprus's video game market revenue is projected to grow from $1.2 billion in 2023 to $6.7 billion by 2025, with a compound annual growth rate of 5.96% through 2030.
- The local ecosystem has expanded to over 600 companies, including 282 startups as of July 2025, with 39 funded, 15 in Series A rounds, and one unicorn.
- Mobile gaming remains the dominant segment, led by major players such as Playrix, Easybrain, and Outfit7, while PC and console development is represented by firms like Wargaming and Digital Vortex Entertainment.
- Local studios such as MY.GAMES and Ludus have successfully leveraged cross-platform development, with individual titles generating revenue exceeding $2 million.
- The industry is supported by a favorable tax regime, EU membership, and a strategic geographic position between Europe and the Middle East.
InvestGameMar 2026
Report19 pages
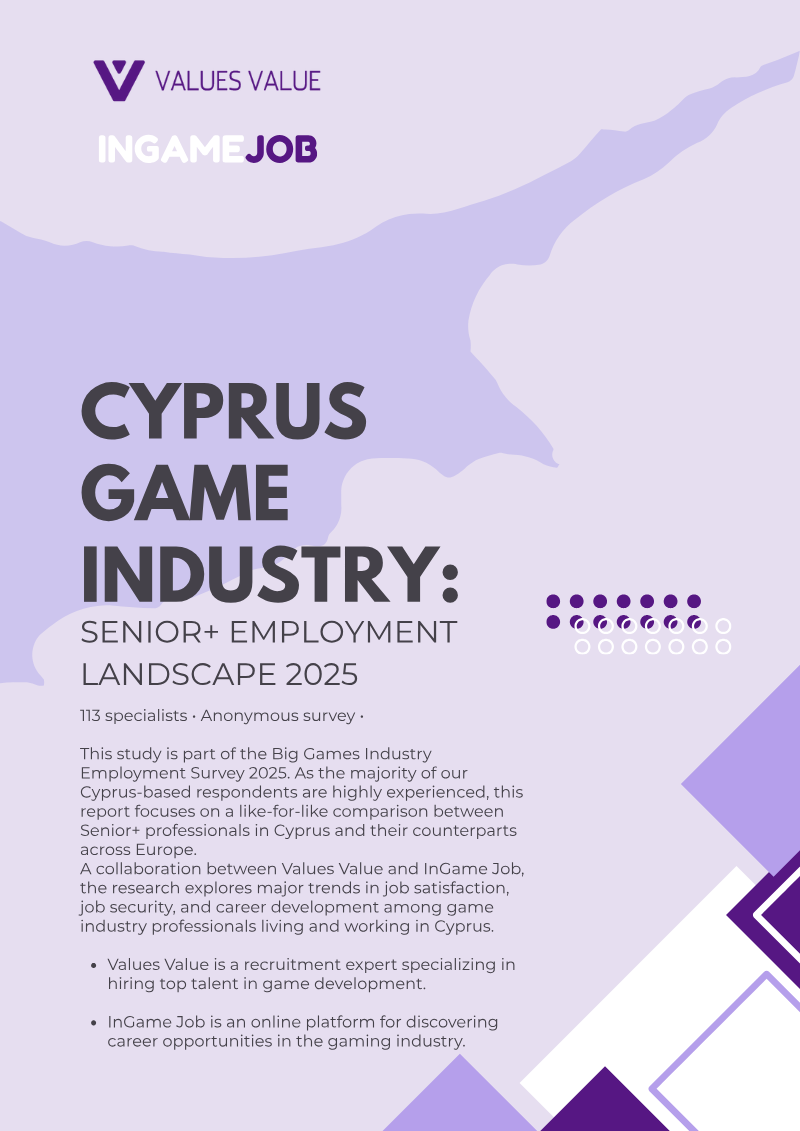
Cyprus Game Industry: Senior+ Employment Landscape 2025
The study examines the senior‑level employment landscape in Cyprus’s game industry for 2025, drawing on an anonymous survey of 113 professionals and a comparative analysis with European peers. Findings reveal that senior‑plus talent in Cyprus exhibits low job mobility, with 71 % reporting no change in the past year and only 20 % moving voluntarily. When moves occur, they are largely strategic, aimed at improving compensation or scope rather than reacting to instability. Senior professionals prioritize financial reliability, clear role definitions, and predictable work environments over brand visibility or rapid career acceleration. Lifestyle factors—including climate, taxation, and family considerations—reinforce long‑term retention and reduce relocation willingness.
Job security perceptions are higher in Cyprus (average 2.68 on a 5‑point scale) than across Europe, yet the expected risk of job loss in the next year is also higher for many roles. Burnout and limited professional development opportunities emerge as key structural risks, with 66 % reporting burnout and only 53 % receiving employer‑funded training. Overtime is common, with 27 % working one to two times a month and 45 % accepting it as part of leadership duties, contributing to long‑term fatigue.
Salary data show Cyprus median salaries for senior roles (e.g., €98 k for top management) below European averages, while desired salaries are substantially higher (e.g., €135 k for top management). Relocation openness is moderate, with 36 % not open and 32 % very open; visa support, health insurance, and relocation bonuses are the most valued benefits.
Overall, the market is mature but faces challenges in retaining talent through sustained engagement and development rather than short‑term compensation incentives. The primary risk for employers is gradual burnout and skill stagnation hidden behind long tenure, rather than sudden turnover.
- Senior-level talent in Cyprus exhibits low job mobility, with 71% of professionals reporting no change in employment over the past year.
- A significant retention risk exists in the form of burnout, which affects 66% of senior professionals, compounded by the fact that only 53% receive employer-funded training.
- Median salaries for top management in Cyprus are approximately €98k, falling significantly short of the €135k desired by professionals in these roles.
- Overtime is a systemic issue, with 45% of leaders accepting it as a standard duty and 27% of the broader senior workforce working overtime at least once or twice a month.
- While 36% of senior professionals are not open to relocation, 32% are very open, with visa support, health insurance, and relocation bonuses identified as the most critical incentives.
+1
Values ValueMar 2026

Report10 pages
Winning on Google Discover: A Data-Driven Guide for Gaming Media
The brief explains how Google’s February 5, 2026 “Discover core update” expands the personalized content feed and shifts traffic from traditional search to Discover, especially for gaming media. Across 197 active gaming sites in the Raptive network, roughly half of Google traffic originates from Discover, with a 20 % rise in sites receiving feed impressions after the update. The report identifies three key performance drivers that correlate with both Discover visibility and overall revenue: high U.S. traffic concentration, deep session depth, and structured editorial content such as guides and reference databases. Sites that meet these criteria see stronger Discover performance, while those dominated by forum‑style or low‑differentiation content face greater volatility.
Methodologically, the analysis draws on internal Raptive data from 6,000+ sites and external sources like Chartbeat and Google Search Console. It highlights early post‑update signals: Discover traffic is growing for smaller publishers, click volatility remains high due to real‑time recommendation algorithms, and AI summaries now occupy about half of feed impressions. The brief recommends five high‑impact actions—optimizing Core Web Vitals, crafting Discover‑specific headlines, adding author voice, aligning publishing calendars with gaming events, and correcting meta tags—to boost Discover clicks.
The document concludes by outlining Raptive’s support services, including a forthcoming Discover Workbook and personalized audits that have historically yielded an 89 % RPM uplift for gaming publishers. The brief positions Discover as a critical, data‑driven channel for gaming media amid declining search traffic and AI‑generated content.
- Google Discover now accounts for roughly 50% of Google traffic for gaming sites within the Raptive network, following a February 5, 2026 core update that shifted traffic away from traditional search.
- Sites that prioritize high U.S. traffic concentration, deep session depth, and structured editorial content like guides and databases experience superior Discover performance and revenue stability.
- Following the February 2026 update, 20% more gaming sites began receiving Discover feed impressions, with smaller publishers seeing notable traffic growth.
- AI-generated summaries currently occupy approximately 50% of all Discover feed impressions, contributing to high click volatility for publishers.
- Publishers relying on forum-style or low-differentiation content face increased traffic volatility compared to those producing structured, expert-led editorial content.
+2
RaptiveMar 2026

Report10 pages
Take Rates in China
The analysis evaluates how take‑rate structures shape mobile game monetisation in China and whether higher‑quality development can outweigh the pressure of traditional distribution fees. It contrasts Apple’s uniform 30 % commission with the far steeper charges imposed by domestic Android app stores, many of which demand up to 50 % of in‑app purchase revenue, and examines the emerging shift toward direct‑to‑consumer distribution and community‑driven platforms.
Apple’s 30 % rate applies to the roughly 25 % of Chinese gamers who use iOS, who nonetheless generate about 40 % of mobile game revenue. In the Android segment, the absence of Google Play has led to a fragmented ecosystem dominated by manufacturer‑backed stores such as those from Huawei, Oppo and Vivo, and by Tencent’s MyApp. These stores justify 50 % take rates by bundling distribution, marketing and cross‑store integration, a model that yields high internet‑service margins for hardware makers—Xiaomi reports a 64.7 % gross profit on services versus 7.2 % on devices. Large publishers like NetEase and Tencent have occasionally negotiated lower fees, but most developers accept the 50 % level to reach a broad audience.
A growing number of developers are bypassing high‑fee stores, opting for direct distribution or leveraging community platforms that charge little or no commission. Duoyi’s “Shenwu” achieved a 95 % gross profit on Android by selling directly, while its iOS version retained a 70 % margin after Apple’s cut. Similar success is seen with Lilith Games’ “Rise of Kingdoms,” which generated roughly $100 million in its launch month without major Android store presence, and miHoYo’s “Genshin Impact,” which combined a $100 million development budget with fan‑driven channels such as TapTap (0 % take rate) and Bilibili to secure millions of pre‑registrations. These cases illustrate that high‑quality titles paired with intensive marketing and community engagement can sustain profitability even when forgoing traditional store exposure.
The study’s scope covers the Chinese mobile gaming market from 2020 through 2021, focusing on iOS and Android distribution channels, take‑rate policies, and developer responses. Insights draw on Niko
- Chinese Android app stores, dominated by manufacturers like Huawei, Oppo, and Vivo, typically charge a 50% commission on in-app purchases, significantly higher than Apple’s 30% rate.
- Hardware manufacturers rely heavily on these high take rates for profitability; for example, Xiaomi reports a 64.7% gross profit margin on services compared to only 7.2% on hardware sales.
- While iOS users account for only 25% of the Chinese gaming population, they generate approximately 40% of total mobile game revenue.
- High-quality titles are increasingly bypassing traditional Android stores to avoid 50% fees, with developers like Duoyi achieving a 95% gross profit on Android by utilizing direct distribution.
- Community-driven platforms like TapTap, which charge a 0% take rate, are becoming viable alternatives for major releases, as demonstrated by miHoYo’s successful launch of Genshin Impact.
Niko PartnersFeb 2026

Report21 pages
Interview with Game Expert at Line Studio: Japan Market Insights
Market Insights: Japan Prepared for Korean Game Developers & Publishers Date: March 2026
Executive Summary
Japan’s mobile gaming ecosystem is undergoing a rapid shift. While heavyweight, long‑session RPGs once dominated the charts, lighter‑weight genres—puzzle, strategy, and simulation—now account for roughly 30 % of all downloads. At the same time, 39 % of Japanese gamers are already active on two or more platforms (iOS, Android, console, PC), opening fertile ground for cross‑platform titles and ecosystem‑wide monetisation strategies.
Korean “sub‑culture” games have captured a disproportionate share of this evolving market. Collectible RPGs such as Blue Archive and Goddess of Victory: NIKKE, together with the MMORPG Lineage W, resonate because they blend moe‑style character designs, high‑polish visuals, short‑session playability, and tightly localized narratives.
Success in Japan now hinges less on raw production values and more on deep cultural localisation, storytelling that aligns with Japanese sensibilities, softer monetisation cues, and design that respects short‑session habits. Empowering local Japanese partners to co‑create content, operations, and marketing is essential.
The most promising near‑term opportunities are:
AAA‑grade mobile RPGs with cross‑platform integration (mobile ↔ console ↔ PC). Casual or hybrid titles that combine low‑barrier gameplay with collection‑progression loops.
Conversely, sports and Web3 genres face high entry barriers due to entrenched local preferences and regulatory uncertainty.
Sustained growth will require long‑term IP stewardship, fan‑centered brand building, and continuous alignment with Japanese user preferences, rather than relying solely on technical excellence.
1. Market Landscape – From Heavyweight RPGs to Light‑Weight Genres
1.1 Shift in Genre Preference
Download Share (Q4 2025): Puzzle/Strategy/Simulation: ≈ 30 % Traditional heavyweight RPGs (e.g., turn‑based, open‑world): ≈ 22 % Collectible/Idle RPGs: ≈ 18 % Other (social, casual, AR): ≈ 30 %
Drivers of the shift 1. Time‑scarcity: Japanese commuters and office workers increasingly favor games that can be enjoyed in 5‑10‑minute bursts. 2. Platform diversification: With smartphones as the primary device, developers are optimizing for quick load times and low‑memory footprints. 3. Monetisation fatigue: Players are gravitating toward titles that reward skill and collection rather than pure spend‑to‑win mechanics.
1.2 Multi‑Platform Play
Cross‑platform adoption: 39 % of gamers regularly switch between at least two devices (e.g., mobile ↔ console, mobile ↔ PC). Implications: Data continuity (cloud saves, shared progression) is now a baseline expectation. Cross‑play events and seasonal
- Japanese mobile gaming is shifting toward lighter genres, with puzzle, strategy, and simulation titles now accounting for approximately 30% of all downloads.
- Cross-platform functionality is a critical market requirement, as 39% of Japanese gamers now actively play across two or more platforms, including mobile, console, and PC.
- Korean 'sub-culture' titles like Blue Archive, Goddess of Victory: NIKKE, and Lineage W have successfully penetrated the market by combining moe-style character designs with high-polish visuals and short-session playability.
- Success in Japan requires deep cultural localization and storytelling that aligns with local sensibilities, rather than relying solely on high production values.
- The most viable near-term opportunities for developers are AAA-grade mobile RPGs with cross-platform integration and hybrid titles that blend low-barrier gameplay with collection-progression loops.
+1
KOCCA – Korea Creative Content Agency

Report31 pages
The Dual Frontier: A Retailer’s Framework for Agentic Commerce
Retailers frequently adopt LLM‑powered chat widgets without addressing the core friction points that shape shopper behavior. The analysis argues that meaningful agentic commerce emerges when AI is tailored to a retailer’s specific product categories, customer profiles, and pain points. By deploying onsite ambient intelligence that proactively surfaces assistance when shoppers display confusion, retailers can intervene before friction escalates. Off‑site agent commerce remains nascent; catalog data quality and the availability of structured attributes are critical bottlenecks that must be resolved to enable reliable recommendations and transactions.
Data quality is identified as a pivotal differentiator. In an agentic environment, insufficient data can prevent a retailer from entering a shopper’s consideration set entirely, whereas in traditional e‑commerce it merely dampens conversion rates. The framework stresses the need to provide agent platforms with enough data for accurate recommendations while protecting proprietary signals from competitors. A calibrated approach—balancing “share freely,” “share selectively,” and “protect” signals—is essential to maintain trust, enhance recommendation confidence, and drive higher conversion rates.
A quantitative readiness diagnostic offers a pragmatic path forward. Four pillars—catalog, technical infrastructure, organizational capacity, and strategic urgency—are scored on a 32‑point scale. Scores of 26–32 signal mature foundations and immediate learning loops; 18–25 require focused catalog work over 8–12 weeks; 10–17 suggest a narrow pilot with partner support; and 0–9 indicate foundational improvements are needed before any agent rollout. Building these capabilities in‑house can take 12–18 months, whereas partnering with a platform such as Moloco Commerce Media accelerates deployment through catalog normalization, real‑time decisioning, and holdout‑based incrementality frameworks.
- Retailers must prioritize high-quality, structured catalog data, as insufficient data in an agentic environment causes total exclusion from a shopper's consideration set rather than just lower conversion rates.
- A 32-point readiness diagnostic across four pillars—catalog, infrastructure, organizational capacity, and strategic urgency—determines the viability of agentic commerce, with scores of 26–32 indicating immediate readiness and 0–9 requiring foundational work.
- Retailers should adopt a calibrated data-sharing strategy, categorizing signals into 'share freely,' 'share selectively,' and 'protect' to balance recommendation accuracy with the need to safeguard proprietary competitive advantages.
- Partnering with platforms like Moloco Commerce Media can bypass the 12–18 month timeline required for in-house development by providing immediate access to catalog normalization and real-time decisioning frameworks.
- Effective agentic commerce requires shifting from passive chat widgets to proactive ambient intelligence that intervenes when shoppers display signs of confusion.
+2
InvestGameFeb 2026
Report5 pages
Nexon Releases Earnings for Fourth Quarter and Full-Year 2025
Nexon reported record-breaking financial results for the fiscal year ended December 31, 2025, driven by a strategic IP growth initiative that balanced the expansion of legacy franchises with successful new global launches. Full-year revenue reached ¥475.1 billion, a 6% increase year-over-year, while operating income remained stable at ¥124.0 billion. The fourth quarter saw a significant revenue surge of 55% to ¥123.6 billion, although net income declined 66% to ¥10.9 billion, primarily due to fluctuations in foreign exchange gains compared to the previous year and higher-than-anticipated costs related to performance bonuses and platform fees.
The growth was spearheaded by the launch of ARC Raiders, which sold over 14 million units within 15 weeks and achieved a peak of 960,000 concurrent users. Simultaneously, the 22-year-old MapleStory franchise delivered its highest annual revenue in history, growing 43% year-over-year. This performance offset a 21% decline in the Dungeon&Fighter franchise, despite a strong recovery in its PC segment in China and Korea. The period was also marked by a significant player trust initiative regarding MapleStory: Idle RPG; a coding error led Nexon to offer full refunds, resulting in a ¥9 billion reduction in Q4 revenue.
Geographically, the results reflect Nexon’s successful diversification beyond its traditional Asian strongholds into Western markets via console and PC platforms. Looking ahead to the first quarter of 2026, the company expects revenue growth between 32% and 44%, supported by sustained momentum from new titles and major updates to core IPs. Nexon remains committed to aggressive shareholder returns, doubling its dividend and completing a ¥100 billion share buyback program during the fiscal year.
- Nexon achieved record full-year 2025 revenue of ¥475.1 billion, a 6% year-over-year increase, with operating income holding steady at ¥124.0 billion.
- The new title ARC Raiders was a major growth driver, selling over 14 million units within 15 weeks and reaching a peak of 960,000 concurrent users.
- The 22-year-old MapleStory franchise reached record annual revenue with 43% year-over-year growth, helping to offset a 21% decline in the Dungeon&Fighter franchise.
- Q4 net income dropped 66% to ¥10.9 billion due to foreign exchange fluctuations, increased platform fees, and performance bonuses.
- A player trust initiative following a coding error in MapleStory: Idle RPG resulted in a ¥9 billion revenue reduction in Q4 due to full customer refunds.
+3
NEXON Co.Feb 2026
Report94 pages
The PC & Console Gaming Report 2025
The global PC and console gaming market is projected to reach $92.7 billion by 2027, driven by a significant recovery in the console sector. While PC growth remains modest at a 2.6% CAGR, the console segment is expected to expand by 7.0%, fueled by the anticipated launch of the Nintendo Switch 2 and blockbuster releases such as Grand Theft Auto VI. Despite a revenue dip in 2024 due to a lighter premium release schedule, total playtime grew by 6%, signaling robust engagement even as market dynamics shift toward a "near zero-sum" competition for player attention.
Player behavior is increasingly characterized by "calcification," where engagement is concentrated into a shrinking pool of established "forever games." Titles aged six years or older now command over 60% of playtime on PC and nearly half on consoles. This consolidation is most visible on PC, where just five legacy titles account for 30% of annual hours. While PlayStation has emerged as a growth leader with a 21% increase in playtime since 2021, the broader trend across all platforms shows players becoming more "unreachable," with a rising share of the audience engaging with only one to three games per year.
To combat stagnation, publishers are increasingly leveraging "recursive nostalgia" by reintroducing classic maps and mechanics. While this strategy yielded massive engagement spikes for Fortnite, its effectiveness varies, often serving as a short-term boost rather than a long-term retention tool unless structured as a permanent gameplay mode. Furthermore, the discoverability crisis has intensified as annual releases on Steam approached 19,000 in 2024. With the impact of traditional seasonal sales declining fourfold since 2019, success now requires a shift toward targeted global events, external traffic generation, and product differentiation to break through a market dominated by AAA franchises and entrenched free-to-play titles.
- The global PC and console market is projected to reach $92.7 billion by 2027, with the console segment expected to grow at a 7.0% CAGR driven by the Nintendo Switch 2 launch and Grand Theft Auto VI.
- Player engagement is increasingly 'calcified,' as titles aged six years or older now account for over 60% of PC playtime and nearly 50% of console playtime.
- Market competition for player attention has become a near zero-sum game, with a rising percentage of the audience now limiting their engagement to only one to three games per year.
- On PC, market consolidation is extreme, with just five legacy titles responsible for 30% of total annual hours played.
- Despite a 2024 revenue dip caused by a light release schedule, total player engagement grew by 6%, indicating that playtime remains robust even as monetization becomes more difficult.
+2
NewzooFeb 2026

Report94 pages
Mobile Market Landscape 2026
The mobile ecosystem is undergoing a fundamental structural transformation as the industry shifts from a volume-based growth model to one defined by monetization efficiency and technological integration. By 2026, the market has reached a state of saturation where total app releases have surged by 25% year-over-year, yet only 10% of new titles successfully secure meaningful user attention. A pivotal milestone occurred in late 2025 when non-gaming applications surpassed gaming in total revenue for the first time, largely propelled by the explosive 273% revenue growth in generative AI and the strategic expansion of utility-based tools.
Within the gaming sector, traditional genres such as Casino and RPG have faced stagnation, forcing publishers to adopt hybridization strategies that blend deeper monetization mechanics into previously hypercasual titles. This pivot has yielded significant results, with hypercasual revenue increasing by approximately 80% as developers move toward puzzle and simulation subgenres. Meanwhile, midcore gaming revenue has plateaued at $33–34 billion, prompting a reliance on intensified LiveOps and direct-to-consumer strategies. Across the broader app landscape, the integration of generative AI into creative assets has become standard, with over half of top-grossing games utilizing these tools to scale production, despite ongoing concerns regarding creative monotony.
Geographically, growth patterns are diverging as emerging markets like Indonesia continue to drive massive download volumes, while mature Western markets focus on maximizing revenue per user. The utility and social segments are similarly prioritizing premium subscription models to combat plateauing download numbers. While tools such as antivirus and cloud storage are seeing a resurgence in demand, the industry faces a broader challenge in maintaining long-term retention. Ultimately, the market is transitioning away from hypergrowth toward a sustainable, mature phase characterized by subscription-driven monetization and the strategic application of AI to optimize both user experience and operational efficiency.
- Non-gaming applications surpassed gaming in total revenue for the first time in late 2025, driven by a 273% revenue surge in generative AI and utility-based tools.
- The mobile market has reached saturation, with a 25% year-over-year increase in app releases while only 10% of new titles successfully capture meaningful user attention.
- Hypercasual gaming revenue grew by approximately 80% as developers pivoted toward hybridization, blending deeper monetization mechanics into puzzle and simulation subgenres.
- Midcore gaming revenue has plateaued at $33–34 billion, forcing publishers to rely on intensified LiveOps and direct-to-consumer strategies to maintain performance.
- Over 50% of top-grossing games now utilize generative AI to scale production of creative assets, despite industry concerns regarding potential creative monotony.
+3
AppMagicFeb 2026