Related Documents

Report
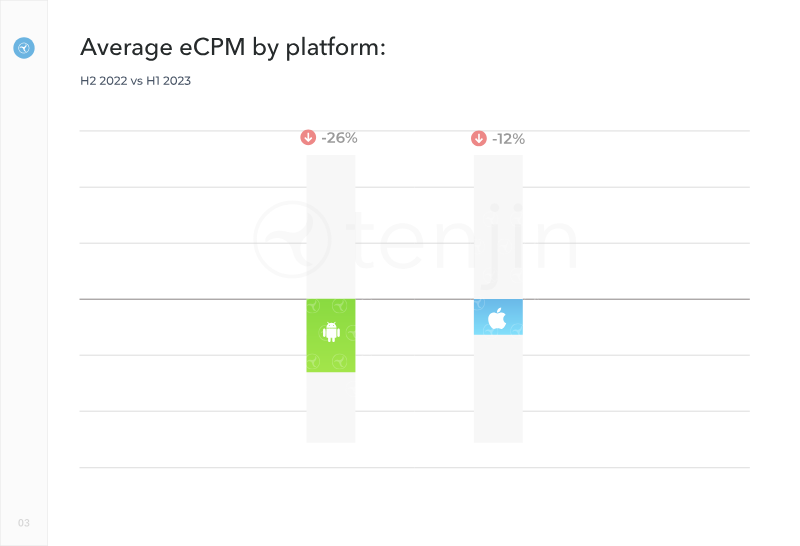
From Hyper to Hybrid: 2023 Follow-up
The mobile gaming landscape experienced a notable shift in monetization and user acquisition patterns between 2022 and the first half of 2023. In-app purchase (IAP) activity demonstrated robust growth across both major mobile operating systems, with Android and Apple platforms recording increases of 23% and 24%, respectively. This upward trend in monetization suggests a resilient consumer base despite broader economic fluctuations within the mobile app ecosystem. Geographic distribution of installs remained relatively stable on Android, with India, Brazil, and the United States maintaining their positions as the top three markets. Conversely, the iOS landscape underwent more significant regional changes, as the United Kingdom, Canada, and Germany gained prominence, displacing China and Saudi Arabia from the top five rankings. These shifts highlight the evolving importance of Western markets for iOS-based mobile game developers. Ad network performance also saw a realignment in competitive dominance. On Android, Google Ads ascended to the top position for total installs in the first half of 2023, while Meta entered the top five. On iOS, AppLovin reclaimed the leading position, and Meta secured a top-five spot, reflecting a dynamic advertising environment where major platforms continue to vie for market share. This analysis relies on anonymized data aggregated by Tenjin from January 1, 2022, through June 30, 2023. The findings are restricted to ad networks and countries that achieved a minimum threshold of 25 million installs, ensuring that the reported trends represent significant market activity. By tracking these metrics, the data provides a clear view of the shifting priorities and regional focus areas for mobile publishers navigating the transition toward hybrid monetization models.
TenjinJan 2023
Report
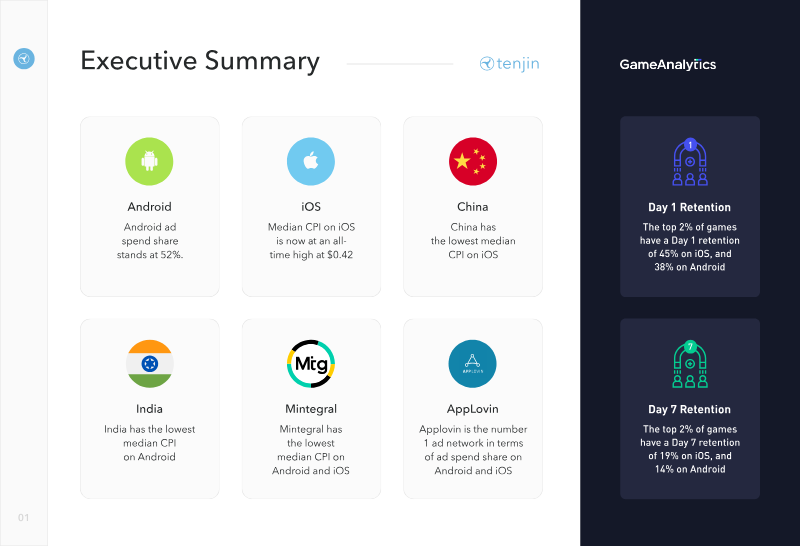
The State of Mobile Game and App Markets: H1 2022
The mobile app and gaming landscape underwent a significant strategic pivot during the first half of 2022, characterized by a transition from high-volume advertising to a quality-focused, data-driven methodology. Faced with rising user acquisition costs and the restrictive post-ATT environment, marketers reduced the total volume of mobile game creatives by nearly 30% year-over-year. This contraction reflects a broader industry shift toward precise traffic optimization, where performance metrics like Cost Per Purchase and In-App Purchase Return on Ad Spend have superseded raw install volume as the primary indicators of success. Geographically, the United States remains the dominant market, commanding the highest share of traffic and the most expensive advertising costs. CPMs surged significantly during this period, rising 18% for mobile games and 64% for non-gaming applications. In response to these economic headwinds and privacy-related tracking limitations, advertisers have increasingly pivoted toward the Android ecosystem, which now hosts approximately 70% of mobile game creatives. Simultaneously, growth is being sought in emerging Tier-2 and Tier-3 markets to offset the saturation and high costs found in traditional Western strongholds. To maintain performance, publishers are diversifying their acquisition channels, moving beyond traditional social media giants to include incentive-based traffic sources and search-driven discovery. App Store Optimization and Apple Search Ads have become critical components of visibility strategies, while the adoption of predictive analytics and first-party data collection allows developers to navigate the loss of IDFA-based targeting. By prioritizing user-generated content styles and optimizing opt-in prompts, which have reached success rates as high as 51% in certain hyper-casual segments, the industry is successfully recalibrating its approach to sustain long-term growth despite a challenging macroeconomic climate.
AdQuantumJan 2022

Report
The Hyper-Casual Benchmark Report: Q3 2022
The hyper-casual mobile gaming sector experienced a notable escalation in acquisition costs during the latter half of 2022, characterized by rising median cost-per-install (CPI) rates across both Android and iOS platforms. By the fourth quarter of 2022, median CPI reached all-time highs of $0.20 on Android and $0.42 on iOS. This upward trend in acquisition spending was global, as no major market tracked by ad spend experienced a decrease in median CPI on Android, while iOS markets saw varied fluctuations, including a significant decrease in the United States and notable increases in France and Germany. Retention metrics reveal a consistent performance advantage for iOS over Android across all tiers of game quality. For the top 2% of hyper-casual titles, iOS achieved a 45% Day 1 retention rate compared to 38% on Android, with Day 7 retention figures similarly favoring iOS at 19% versus 14%. This performance gap persists among the top 25% of games and the median cohort, where iOS maintains a higher percentage of returning players. These findings underscore a widening disparity between high-performing titles and average games, emphasizing the critical importance of engagement optimization in a landscape of increasing user acquisition costs. The analysis draws upon data from over 100,000 games and one-third of the global mobile player base to establish these benchmarks. By segmenting performance by platform and geographic region, the data highlights the shifting economic landscape for developers and publishers. The findings suggest that while market saturation and rising costs present significant challenges, the ability to maintain player retention remains the primary differentiator between top-tier hyper-casual games and the broader market.
TenjinJan 2022
Report
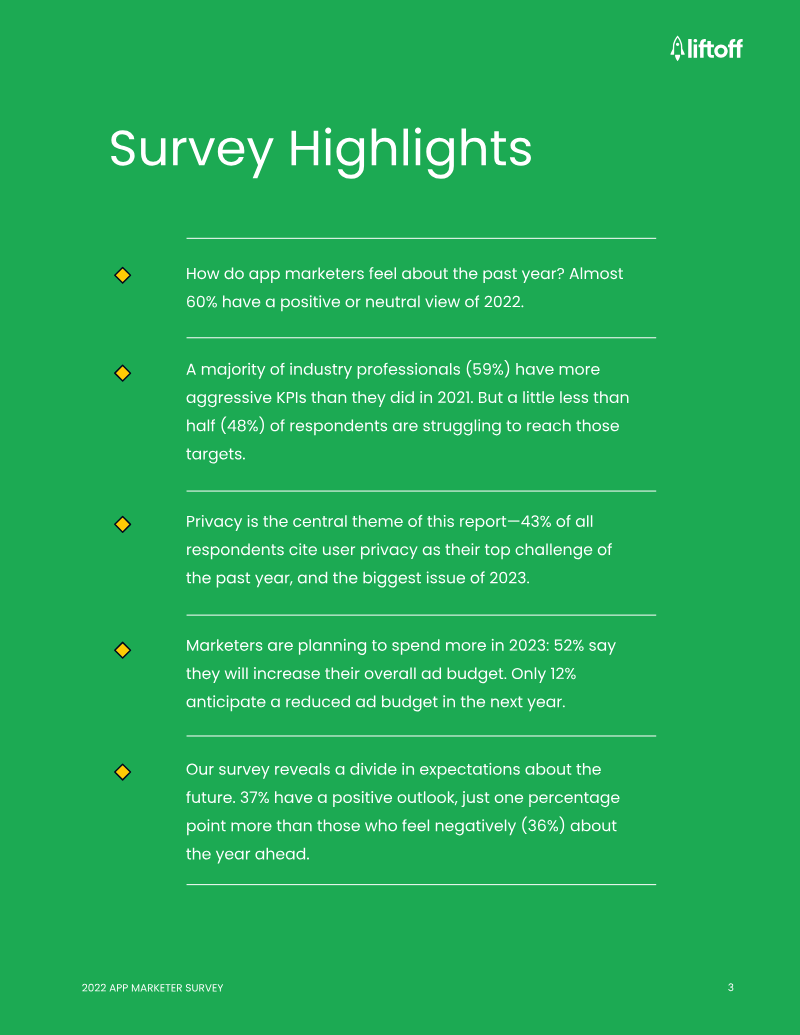
2022 App Marketer Survey
The survey of more than five hundred mobile marketers worldwide in 2022 reveals a mixed outlook for the industry. Roughly sixty percent of respondents view the past year positively, while forty percent see it as a decline; non‑gaming marketers are notably more optimistic. Despite this, 59 % of participants have set higher key performance indicators than in 2021, yet nearly half (48 %) report difficulty meeting those targets. Over half of the cohort plans to increase advertising spend in 2023, reflecting a continued belief that growth is achievable despite challenges. Privacy regulations remain the dominant obstacle. Apple’s App Tracking Transparency (ATT) rollout has disrupted user‑acquisition campaigns, with 64 % of marketers reporting a negative impact and only 12 % noting benefits. Data loss has left 73 % feeling “left in the dark,” while costs have risen for 72 %. In response, marketers are reallocating budgets toward less trackable channels such as organic/viral (68 %) and influencer marketing (57 %). However, 70 % feel unprepared for Google’s forthcoming GAID deprecation and only 47 % are familiar with SKAdNetwork 4, indicating a significant knowledge gap that could spur innovation in alternative acquisition tactics. Liftoff’s mobile growth acceleration platform, serving 6,600 businesses across 74 countries in gaming, social, finance, e‑commerce, and entertainment sectors, offers a comprehensive suite of solutions—Accelerate, Direct, Influence, Monetize, Intelligence, and Vungle Exchange—to help clients acquire high‑value users, access premium inventory, run creator campaigns, optimize in‑app ads, and leverage data analytics. These services aim to drive revenue growth and app engagement for a diverse global client base, positioning Liftoff as a key partner amid the evolving privacy landscape.
LiftoffJan 2022