Ten Square Games reported a mixed Q3 2025 performance, with bookings up 4.4% quarter‑over‑quarter driven by strong growth in Wings of Heroes, Real Combat Simulator and the new Trophy Hunter launch. However, adjusted EBITDA fell 18.4% QoQ as marketing spend surged, particularly user acquisition costs that rose 57.6 %. Despite the EBITDA dip, net profit climbed 24.3% year‑over‑year and cash flow remained solid, leaving a year‑end cash pool of PLN 107.5 million and an adjusted EBITDA margin hovering around 32% for the first three quarters of 2025.
The company is pursuing a dual‑track strategy that balances core title revitalisation—Fishing Clash, Hunting Clash, and Wings of Heroes—with the launch of new projects such as Real Combat Simulator. Financials from 2024‑25 show a rebound in EBITDA, rising from €23 million to €94 million in Q1‑24, and a net profit margin increase to 28% by Q2‑25. This growth is attributed to robust core game performance and disciplined cost management, while dividend and buyback payouts total €485 million, including a planned €100 million dividend in 2025.
Looking ahead, Ten Square Games plans to expand market reach and strengthen its portfolio through targeted acquisitions and a blend of in‑house development and M&A. Projections for 2026 call for revenue growth to PLN 485 million, with a focus on virtual‑currency monetisation and IFRS 15 deferred‑revenue accounting. The strategy underscores a commitment to shareholder value through durable dividends, disciplined marketing spend, and continued portfolio diversification.

Sensor Tower · 2026

Modern Times Group · 2026

Sensor Tower · 2026

InvestGame · 2025

G5 Entertainment AB · 2024

Liftoff · 2024

Bandai Namco · 2021

GameRefinery · 2021

King · 2021
GREE · 2018
IGG · 2015
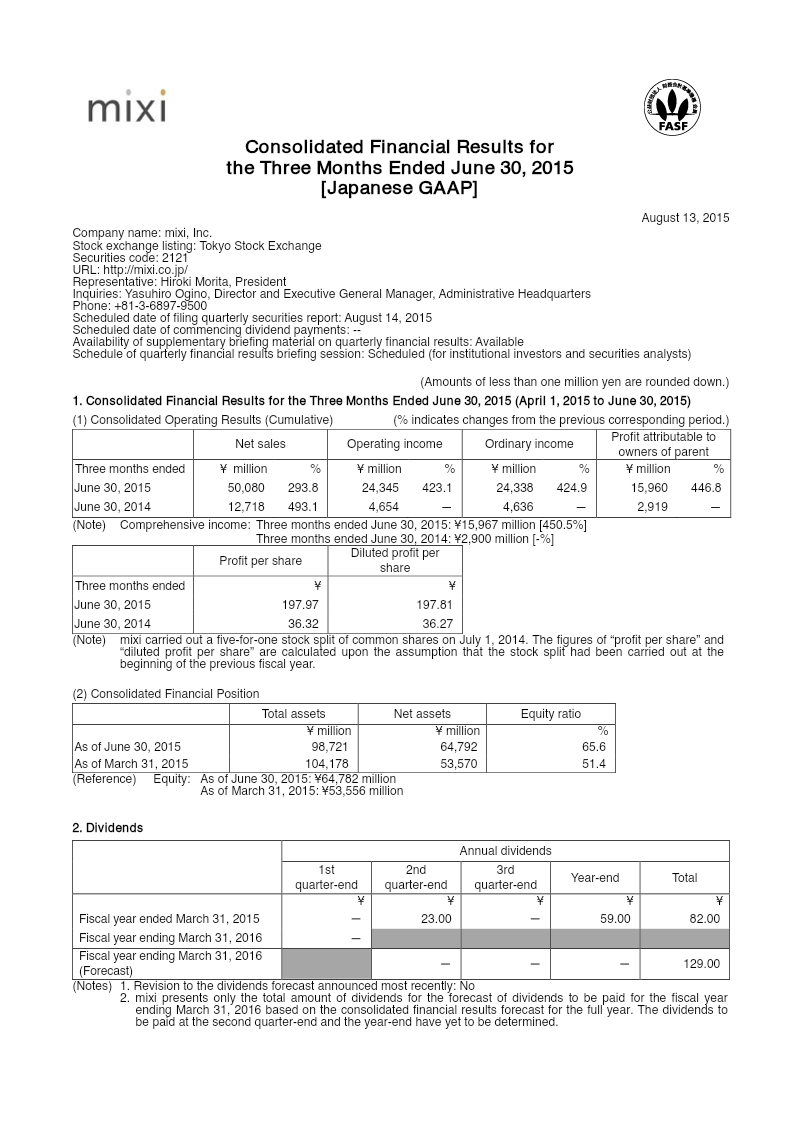
mixi · 2015