Related Documents
Report
Q1 2024 Digital Market Index
In the first quarter of 2024, the mobile gaming market showed a clear shift away from hyper‑casual titles, which experienced a year‑over‑year decline of more than ten percent across all major platforms. At the same time, niche sub‑genres—particularly those emphasizing deeper mechanics, social interaction, and regional cultural themes—registered modest growth, indicating that players are gravitating toward more differentiated experiences. Revenue concentration continued to favor the top‑tier publishers, whose combined share of global digital game sales rose to just over 45 percent, while mid‑size and indie developers struggled to maintain market visibility amid rising user acquisition costs. Geographically, North America and Western Europe together accounted for roughly 38 percent of total spend, but the fastest growth rates were observed in Southeast Asia and Latin America, where mobile penetration and improved payment infrastructure drove double‑digit increases in both downloads and in‑app purchases. The overall market size reached $23.7 billion in Q1, representing a 4.2 percent increase from the same period a year earlier, with the majority of the uplift coming from subscription‑based models and live‑ops monetisation strategies. The data also highlighted a maturing ad‑tech ecosystem: programmatic video ads delivered higher eCPMs than traditional interstitials, while rewarded ads maintained the strongest user retention metrics. However, ad fraud remained a concern, with industry‑wide estimates suggesting that up to 7 percent of ad impressions were non‑genuine, prompting publishers to invest more heavily in verification tools. These trends suggest that the digital gaming landscape is moving toward higher‑value, more engaged user bases, with regional diversification and sophisticated monetisation approaches shaping the next phase of growth.
Sensor TowerMar 2024
Report
Digital Marketing Index Report: Q4 2025
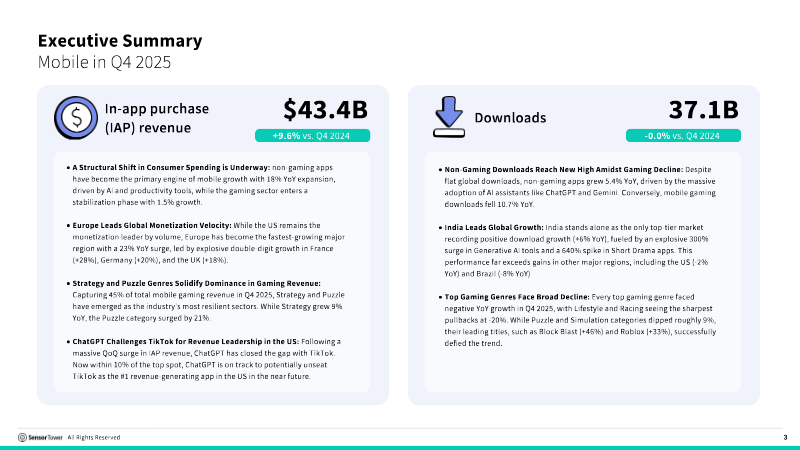
The analysis evaluates global digital‑marketing dynamics for the final quarter of 2025, emphasizing shifts in channel performance, the rise of generative‑AI as a discovery source, and the concentration of retail‑media reach among dominant platforms. Growth patterns reveal a stark regional divide: India stands alone among the five largest markets as the only one posting positive overall change, while other leading economies recorded declines or stagnation. In the United States, retail‑media impressions expanded 13 percent quarter‑over‑quarter to reach 123 billion, with Amazon accounting for the entire volume and delivering more than six times the impressions generated by Walmart. This concentration underscores Amazon’s expanding role as the primary conduit for retail‑media exposure in North America. Across the same period, generative‑AI referrals, although still representing less than one percent of total traffic, surged dramatically—up 133 percent year‑over‑year in the United States, United Kingdom and France, and 126 percent in Canada. The rapid acceleration signals that chat‑based assistants such as ChatGPT, Claude and Gemini are emerging as significant discovery engines despite their modest share of overall visits. Conversely, traditional organic search experienced the only decline among major acquisition channels, falling four percent year‑over‑year. Paid advertising, email marketing and other performance‑driven tactics continued to post gains, reinforcing a broader transition toward paid and AI‑augmented pathways for user acquisition. The findings collectively illustrate a digital‑marketing ecosystem increasingly dominated by platform‑centric retail media and AI‑driven referral mechanisms, while legacy search channels lose ground in mature markets.
Sensor TowerOct 2025

Report
Digital Market Index: Q2 2025
The global digital landscape reached a significant milestone in the second quarter of 2025, as in-app purchase revenue hit a record $40 billion. This period marked a historic structural shift in the mobile economy, with non-gaming applications accounting for 52% of total consumer spending, surpassing mobile games for the first time. While total downloads stabilized at 37 billion, the market displayed clear signs of maturation; gaming downloads contracted by 6.8% year-over-year, while AI-driven productivity tools and short-drama streaming platforms emerged as the primary engines of growth. The United States maintained its position as the premier revenue market at $15 billion, though emerging regions such as Brazil and various African nations are increasingly vital for download volume and monetization expansion. Within the gaming sector, Strategy titles overtook RPGs as the highest-grossing category, achieving a 23% year-over-year increase. However, the most significant individual performance came from ChatGPT, which became the fastest application to reach one billion downloads and secured a position among the top five global revenue earners. This surge in AI utility was mirrored in the advertising sector, where U.S. digital ad spend rose 12% to $34 billion. Major technology firms including Microsoft, Google, and Adobe significantly increased their marketing budgets to promote AI integrations like Copilot, contributing to a landscape where social media maintains a 72.5% share of total ad spend. Retail media has solidified its role as a critical advertising channel, with U.S. impressions rising 29% to 65 billion across various retailers. Despite this broad growth, Amazon remains the undisputed leader in the space, generating nearly 80 billion impressions and outperforming all other tracked retailers combined. These findings are supported by expanded tracking capabilities across key Asian markets and diverse digital channels, though the data specifically excludes certain year-over-year Amazon metrics due to recent tracking implementation. Overall, the quarter reflects a pivot toward high-utility AI applications and a diversifying advertising ecosystem dominated by social and retail platforms.
Sensor TowerAug 2025


Report
Digital Market Index: Q3 2025
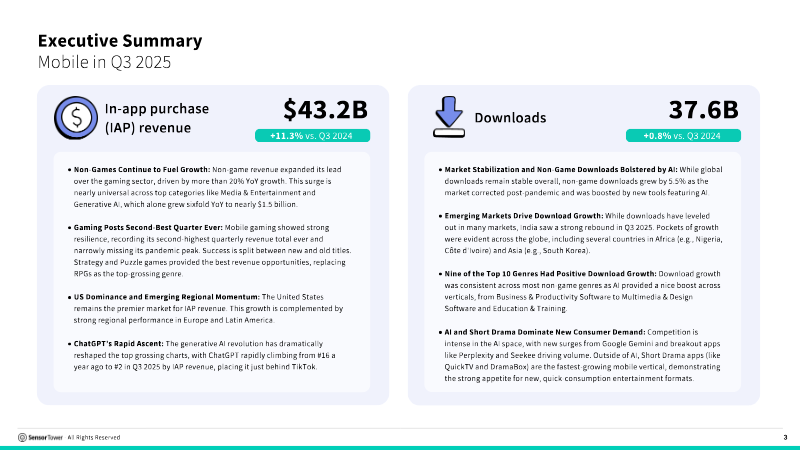
Global mobile app consumer spending reached a record $43.2 billion in the third quarter of 2025, representing an 11.3% year-over-year increase. This growth was primarily fueled by a 20% surge in non-game revenue, particularly from Generative AI tools which generated $1.5 billion during the period. While total global downloads remained stable at 37.6 billion, a clear divergence emerged between sectors; non-game downloads grew by 5.5%, while gaming installs continued a post-pandemic decline. Geographically, the United States maintained its market leadership with $15 billion in revenue, though Brazil emerged as the fastest-growing major market with a 29% revenue increase. India simultaneously reached a two-year high in downloads, surpassing 6.5 billion. The digital advertising landscape saw significant expansion, with U.S. spend rising 12% to $35.9 billion. Social media remains the dominant channel, capturing 72% of the market, but mobile app advertising is the fastest-growing segment at 42% year-over-year. Within specific industries, the gaming sector entered the top five spending categories for the first time following a 28% increase in investment. Strategic shifts were also evident in the insurance and consumer goods sectors, where companies like Geico and Procter & Gamble executed massive quarterly spending spikes to capitalize on premium fluctuations and seasonal demand. Retail media has become a critical pillar of the digital economy, dominated heavily by Amazon. Generating over 80 billion impressions, Amazon’s reach surpassed the combined total of the next thirty major retailers. Outside of Amazon's ecosystem, retail media impressions grew 7% year-over-year, though performance was inconsistent across platforms; Target and Best Buy saw double-digit growth while Walmart experienced a decline. Personal care remains the most competitive retail category, driven by high-volume co-branded partnerships between major manufacturers and established retail platforms.
Sensor TowerNov 2025