Related Documents
Financial
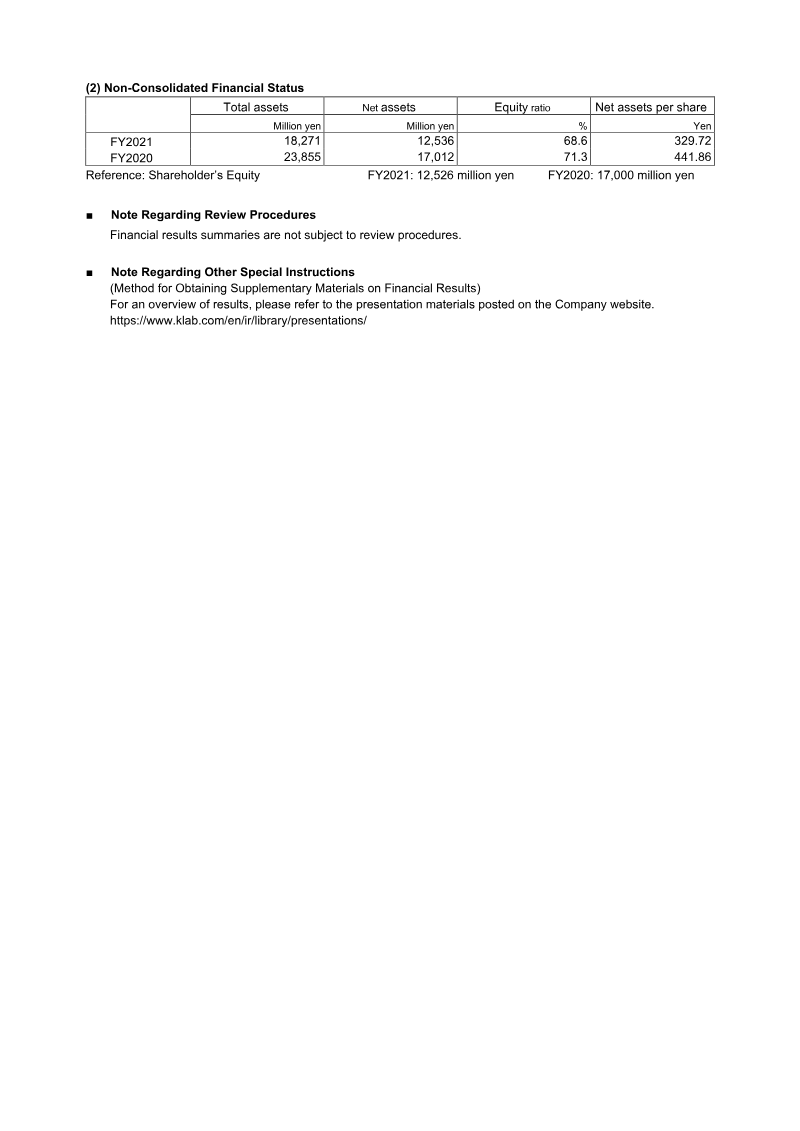
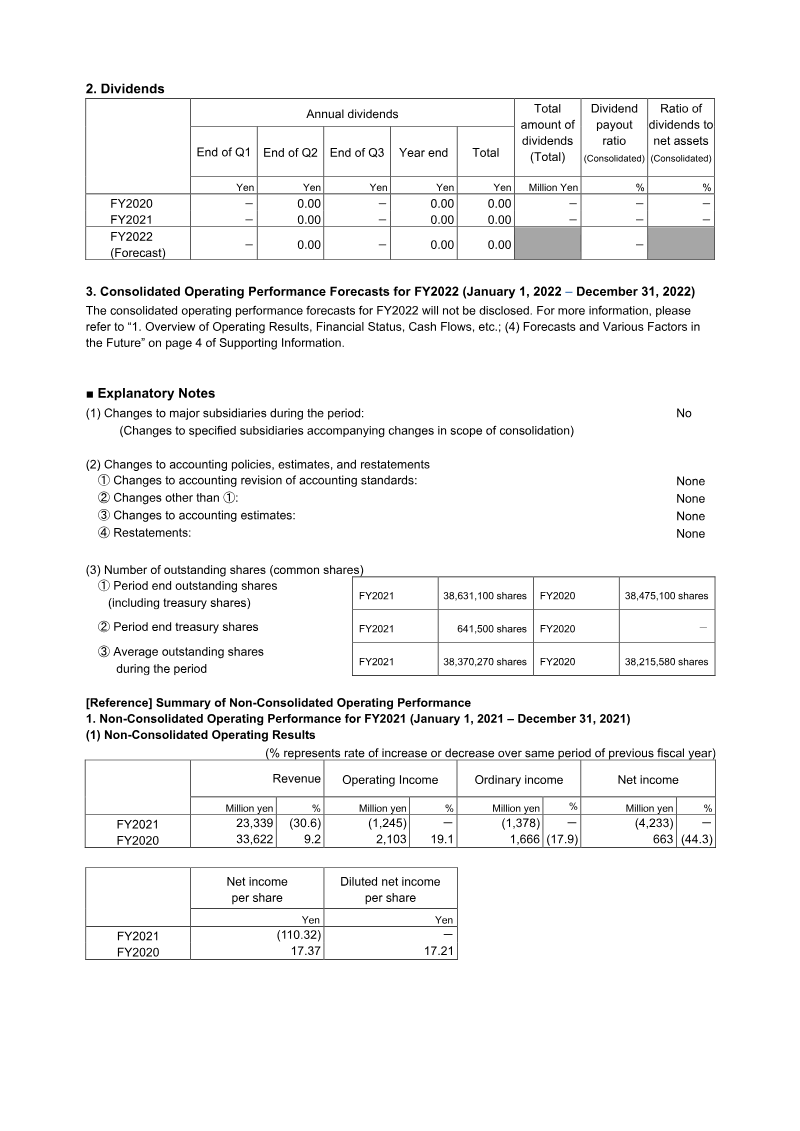
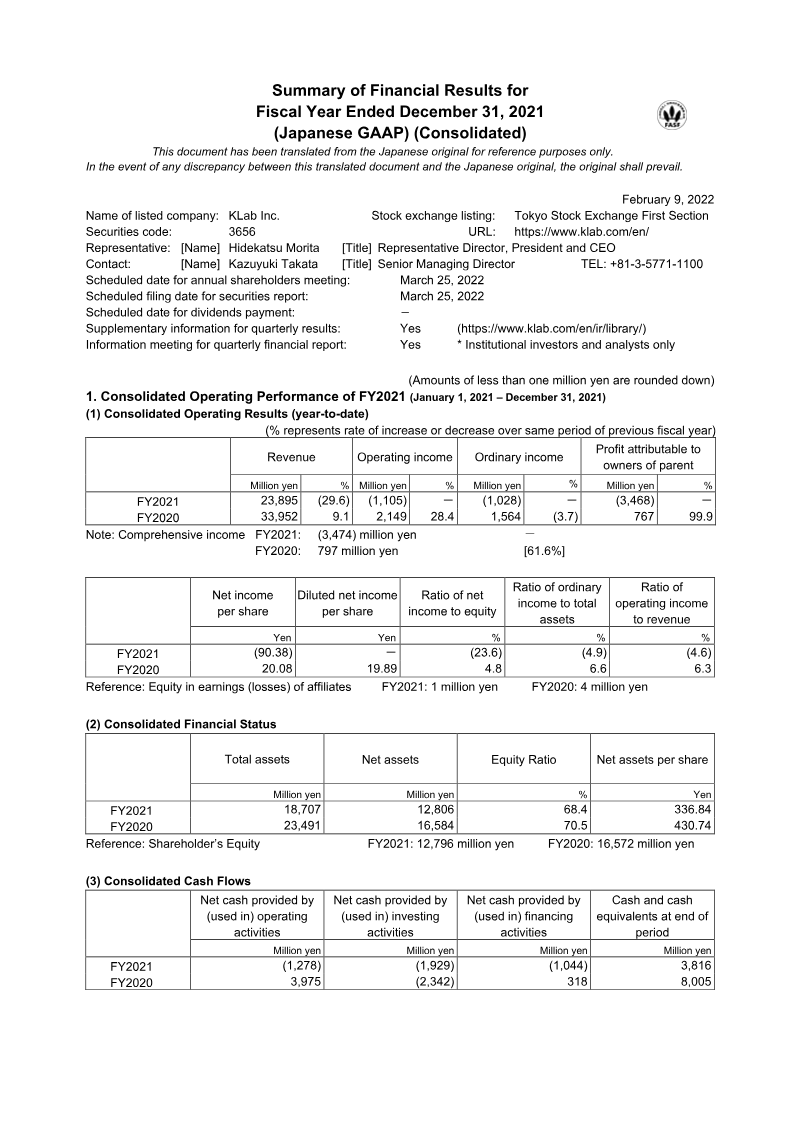
Summary of Financial Results for Fiscal Year Ended December 31, 2021 (Japanese GAAP)
KLab Inc. experienced a significant financial downturn during the fiscal year ended December 31, 2021, characterized by a sharp transition from profitability to substantial losses. Revenue fell by 29.6% to ¥23.9 billion, down from ¥33.9 billion the previous year. This decline was primarily driven by the underperformance of existing titles, most notably Love Live! School Idol Festival ALL STARS, which faced intensified market competition. The company shifted from a ¥2.1 billion operating profit in 2020 to a ¥1.1 billion operating loss, while the net loss attributable to owners reached ¥3.47 billion. This volatility resulted in a net loss of ¥90.38 per share, a stark reversal from the ¥20.08 per share profit recorded in the prior fiscal year. The core Game Business segment saw its profit margin erode by over 60%, ending at ¥2.57 billion. Financial stability was further impacted by ¥1.68 billion in extraordinary impairment losses on software assets and negative operating cash flows. Consequently, total net assets decreased from ¥16.58 billion to ¥12.81 billion, and cash and cash equivalents plummeted by ¥4.19 billion to end the period at ¥3.82 billion. These figures reflect both the high costs of intangible asset development and the diminishing returns from the current mobile gaming portfolio within the Japanese market. Looking forward, the outlook remains cautious as earnings forecasts for 2022 have been withheld. This decision stems from high levels of market volatility and uncertainty regarding the release schedule of a major collaborative project with Electronic Arts. While the company continues to focus on its game business, the depletion of cash reserves and the significant drop in net assets per share highlight a period of contraction and strategic transition. Management remains focused on navigating these headwinds through upcoming pipeline developments, though the immediate financial impact of these initiatives remains difficult to quantify.
KLabFeb 2022
Financial
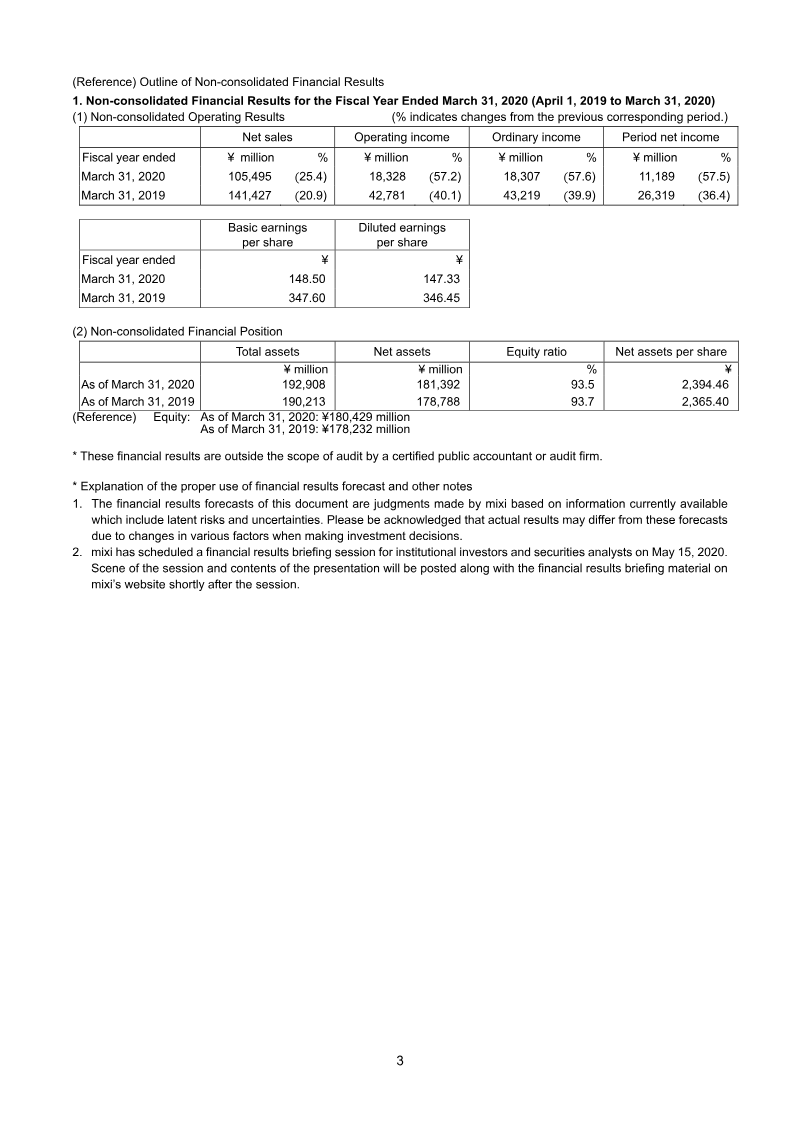
Consolidated Financial Results for the Fiscal Year Ended March 31, 2020
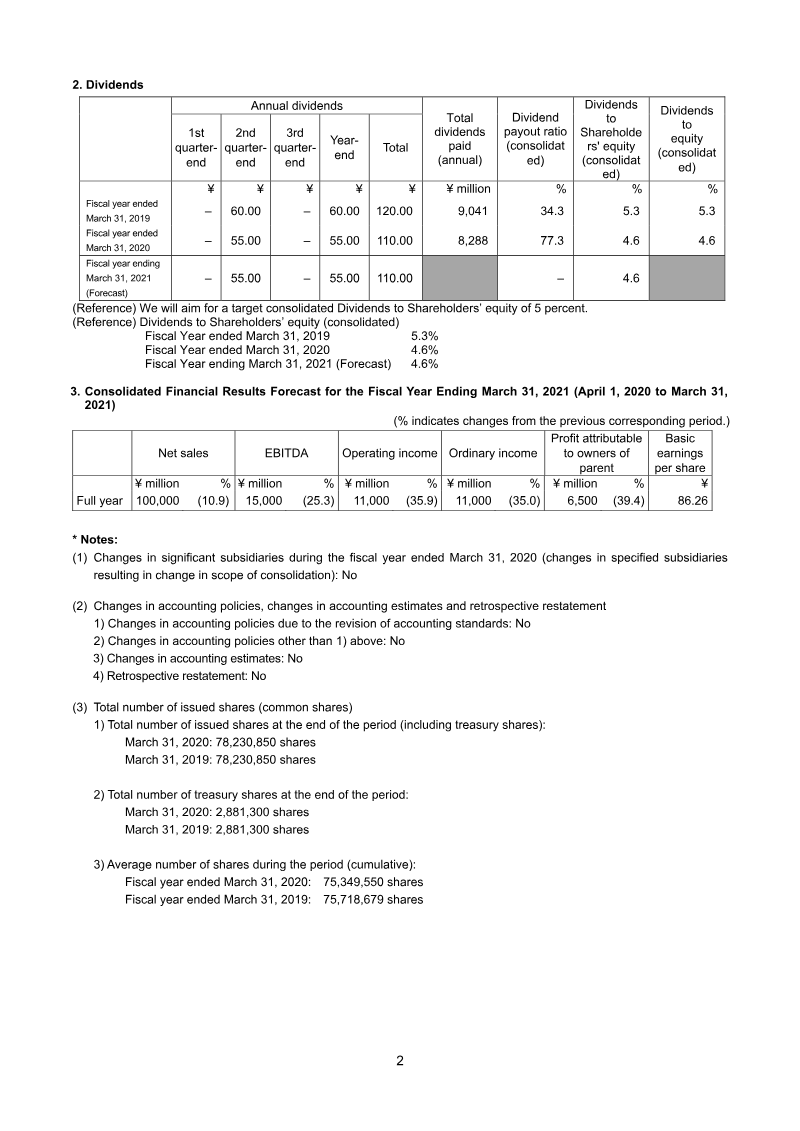
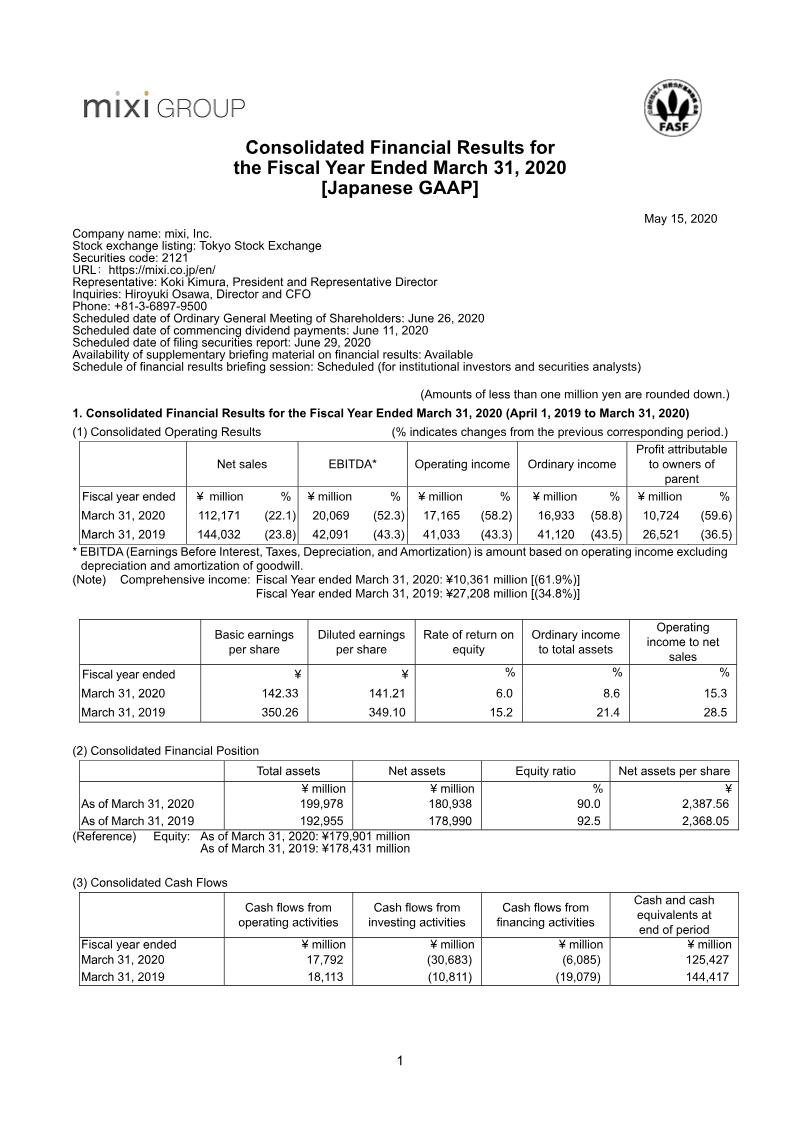
Mixi Group experienced a period of significant financial contraction and strategic transition during the fiscal year ended March 31, 2020. Net sales fell by 22.1% to ¥112,171 million, while profit attributable to owners of the parent plummeted by 59.6% to ¥10,724 million. This downturn was primarily driven by the Entertainment Business, where revenue dropped from ¥138,605 million to ¥107,216 million, causing basic earnings per share to decline from ¥350.26 to ¥142.33. Despite these challenges, the organization maintained a robust equity ratio of 90% and held ¥180,938 million in total net assets, signaling a stable capital base amidst declining operational performance. The fiscal year was characterized by aggressive inorganic growth and diversification within the Japanese market, which accounts for over 90% of total sales and assets. Cash outflows for investing activities rose sharply to ¥30.7 billion, largely due to the acquisition of subsidiaries such as Chariloto Co., Ltd. and Net Dreamers Co., Ltd. The latter acquisition alone accounted for ¥15 billion, contributing to a substantial increase in unamortized goodwill, which reached ¥17,315 million. These investments reflect a strategic pivot toward integrating sports media and professional team management into the core portfolio, even as impairment losses were recorded in underperforming entertainment retail segments. Looking toward the 2021 fiscal year, projections indicate continued pressure on the bottom line, with net sales expected to contract further to ¥100,000 million and profits forecasted to drop to ¥6,500 million. Cash and cash equivalents decreased by ¥19 billion during the period to end at ¥125.4 billion, yet the dividend policy remained steady at ¥115 to ¥120 per share. This financial trajectory highlights a company utilizing its significant cash reserves to fund a structural shift toward new lifestyle and entertainment segments while managing the diminishing returns of its legacy business lines.
mixiMay 2020
Financial
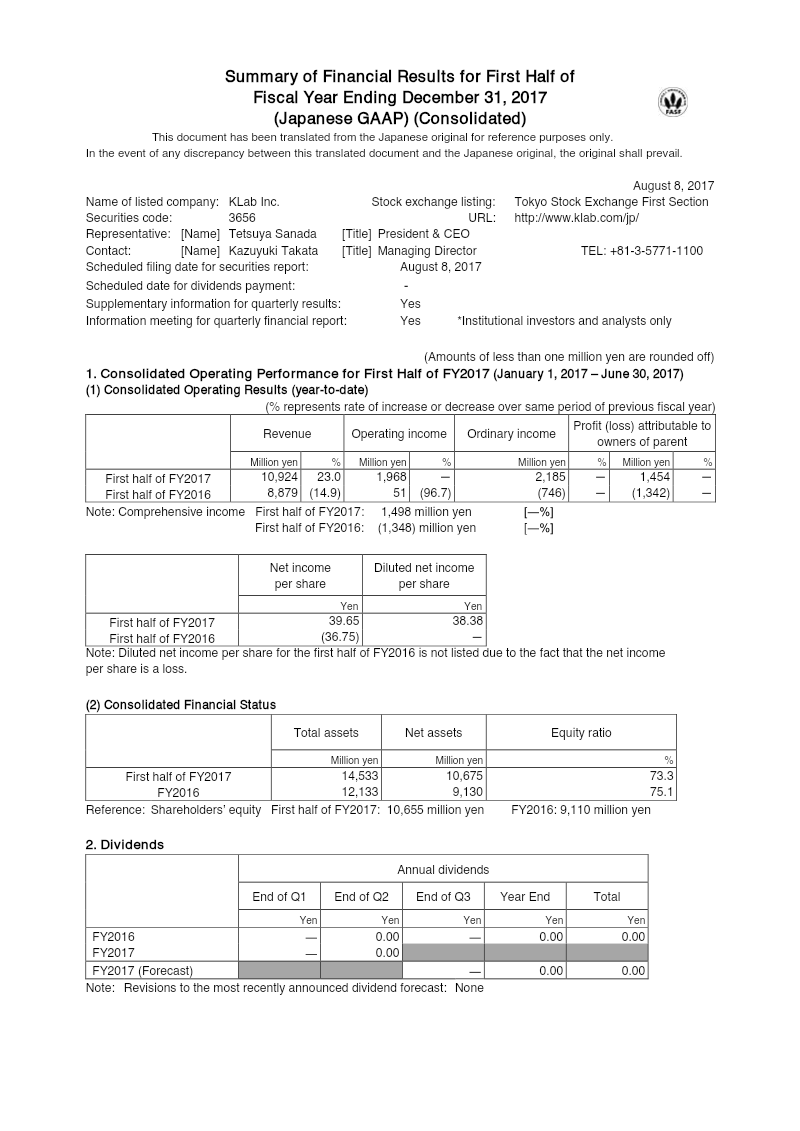
Summary of Financial Results for First Half of Fiscal Year Ending December 31, 2017
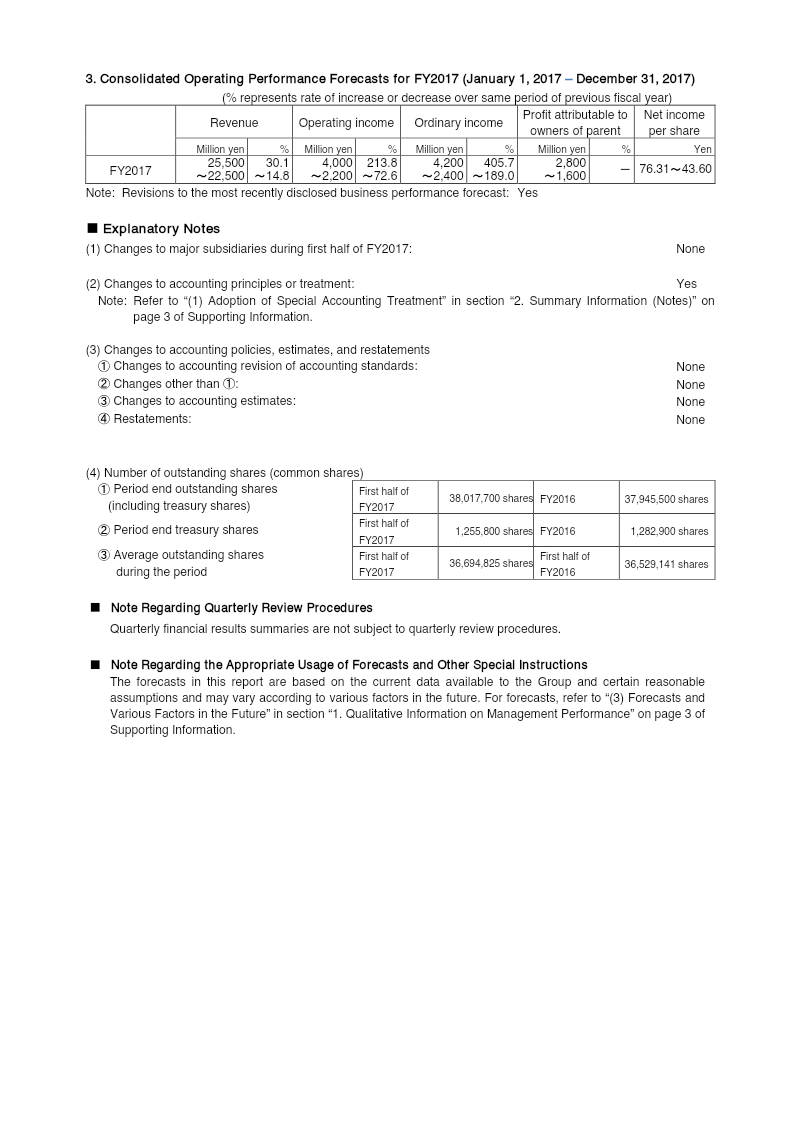
This financial summary details the consolidated operating performance of KLab Inc. for the first half of the fiscal year ending December 31, 2017. Covering the period from January 1 to June 30, 2017, the findings reveal a significant financial turnaround compared to the same period in 2016. Revenue rose 23.0% to 10.9 billion yen, driven by the stable performance of core titles and the successful June launch of Captain Tsubasa: Tatakae Dream Team. The transition from a net loss of 1.3 billion yen in the previous year to a profit of 1.45 billion yen highlights improved operational efficiency. Operating income reached 1.96 billion yen, a stark contrast to the 51 million yen reported in 2016. This growth was supported by a 6.6% reduction in selling, general, and administrative expenses—primarily through lower advertising and outsourcing costs—and a 175 million yen foreign exchange gain. The company’s financial position remains robust, with total assets increasing to 14.5 billion yen and an equity ratio of 73.3%. Strategic developments noted include the July 2017 acquisition of ABASEA Inc. and its subsidiary Spicemart Inc. for 1 billion yen. This move aims to enhance KLab’s data analysis and consulting capabilities within the competitive mobile gaming markets of Japan and China. Methodologically, the report utilizes Japanese GAAP and introduces a range-based forecasting model for the full fiscal year. Management revised its annual guidance upward, projecting revenue between 22.5 and 25.5 billion yen and ordinary income between 2.4 and 4.2 billion yen, reflecting confidence in current market trends and the success rate of new game titles.
KLabAug 2017
Financial
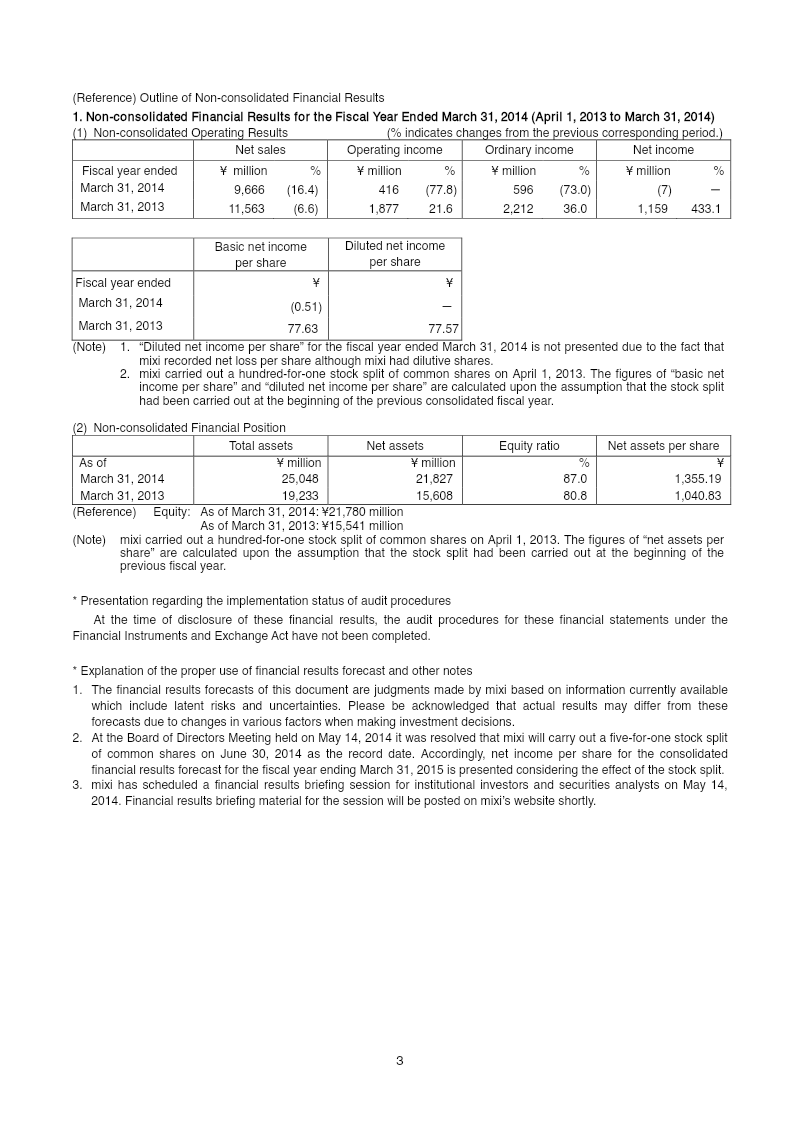
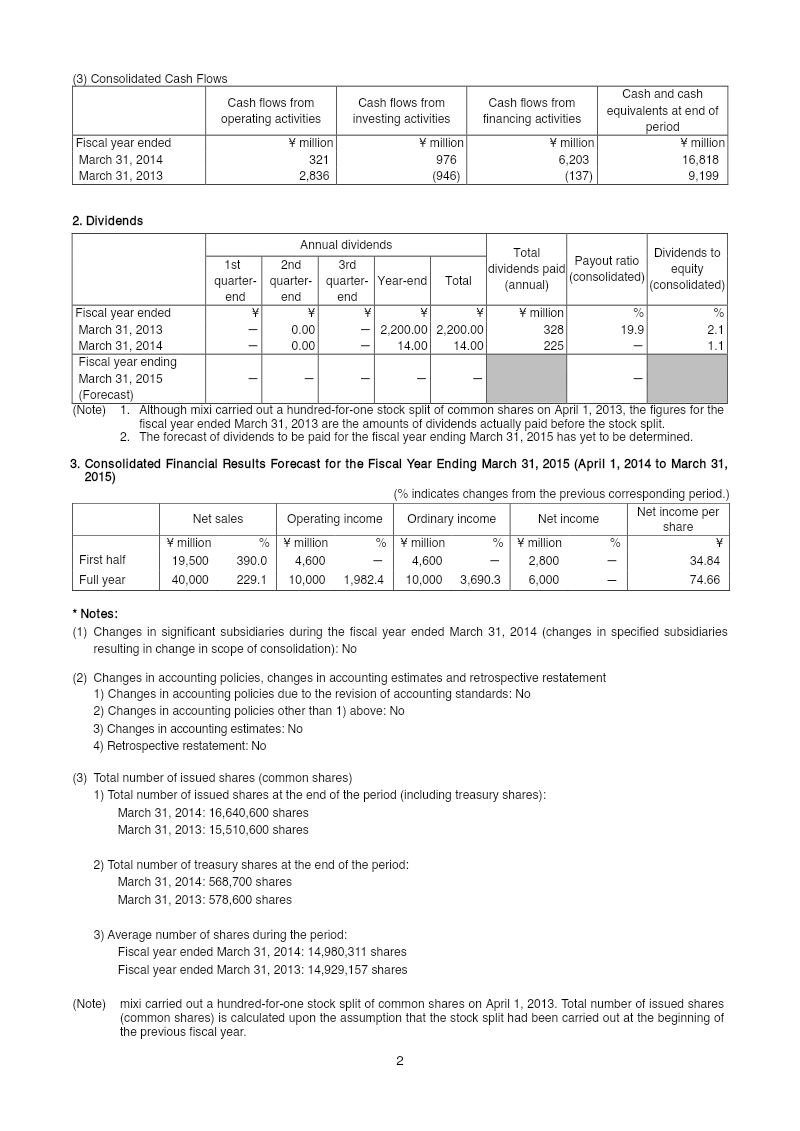
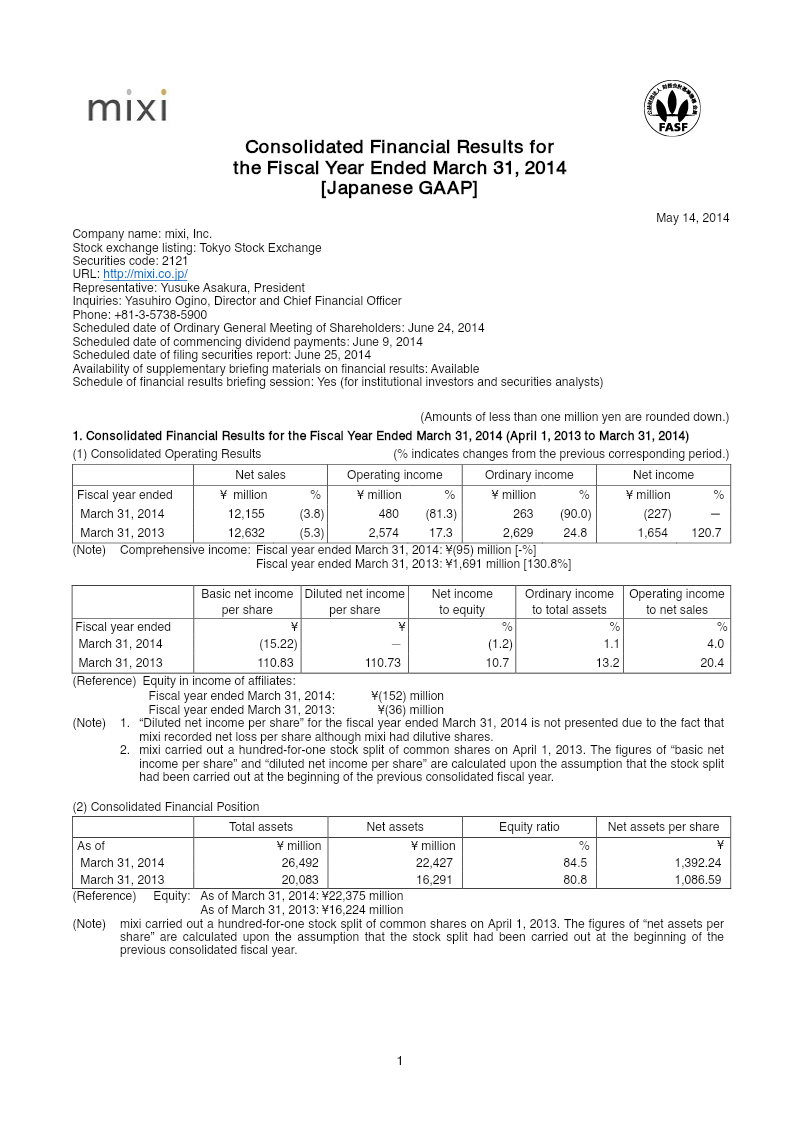
Consolidated Financial Results for the Fiscal Year Ended March 31, 2014
The fiscal year ended March 31, 2014, represented a period of significant structural transition and strategic reinvestment for the Japanese social networking and gaming firm. While net sales experienced a modest 3.8% decline to ¥12,155 million, the company recorded a net loss of ¥227 million, a sharp reversal from the previous year’s profit. This downturn was largely attributed to impairment losses from the liquidation of Chinese subsidiaries, the closure of local bases, and high effective tax rates resulting from goodwill amortization. Despite these losses, the company’s financial foundation remained robust, with total assets increasing to ¥26,492 million and an equity ratio of 84.5%. The Social Net Business segment served as the primary revenue engine, contributing ¥11,550 million in external sales. This performance was bolstered by the growth of the mobile title Monster Strike, which signaled a shift in the company’s core growth drivers. To support this evolution, the group pursued aggressive portfolio expansion through the 100% acquisitions of Diverse, Inc. and Confianza & Co., Inc. for approximately ¥1.2 billion, alongside a strategic business transfer to enhance research and matchmaking services. These moves were complemented by internal restructuring, including the disposal of aging server infrastructure and software assets totaling ¥337 million. Capital management was a central focus throughout the period, characterized by a hundred-for-one stock split and new share issuances that raised ¥6.5 billion. These actions nearly doubled cash and cash equivalents to ¥16.8 billion, providing the liquidity necessary for future scaling. Looking toward fiscal year 2015, the outlook is highly optimistic, with projections suggesting net sales will more than triple to ¥40,000 million and net income will reach ¥6,000 million. To further improve share liquidity and broaden the investor base in anticipation of this growth, the board approved an additional five-for-one stock split effective July 2014.
mixiMay 2014