FinancialKLab
Summary of Financial Results for Fiscal Year Ended December 31, 2021 (Japanese GAAP)
1 Feb 202218 pages~28 min full read
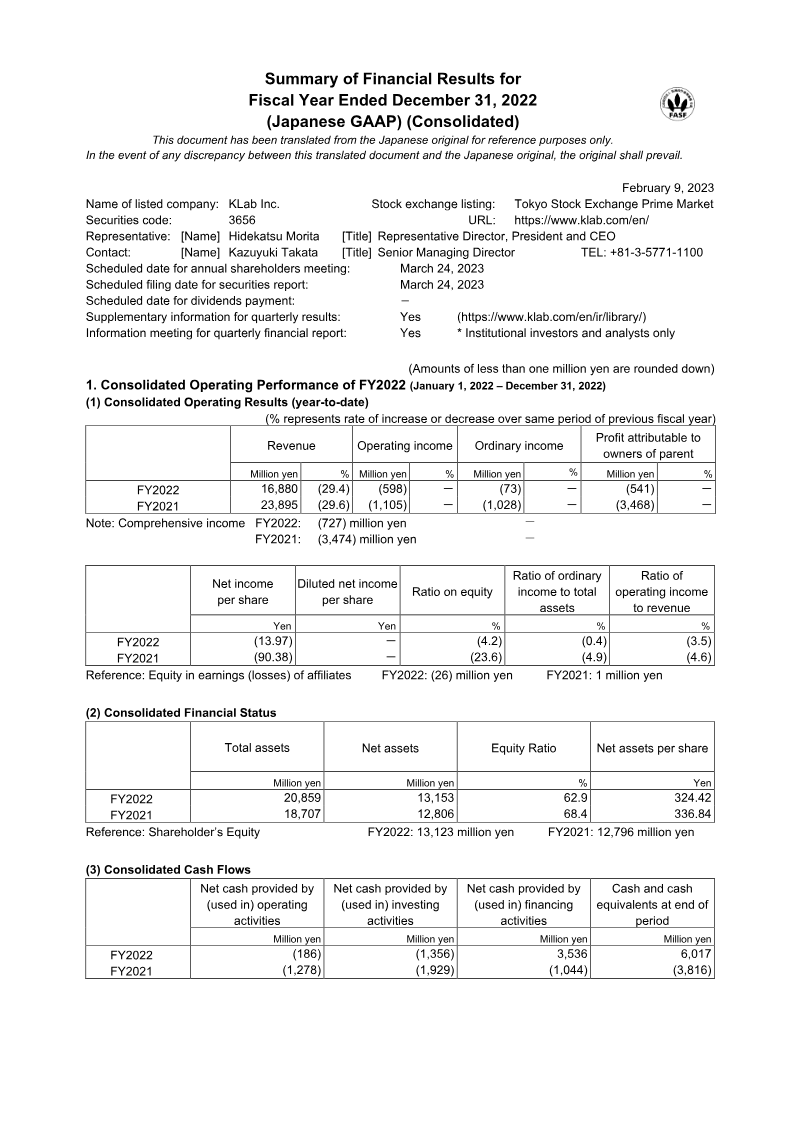
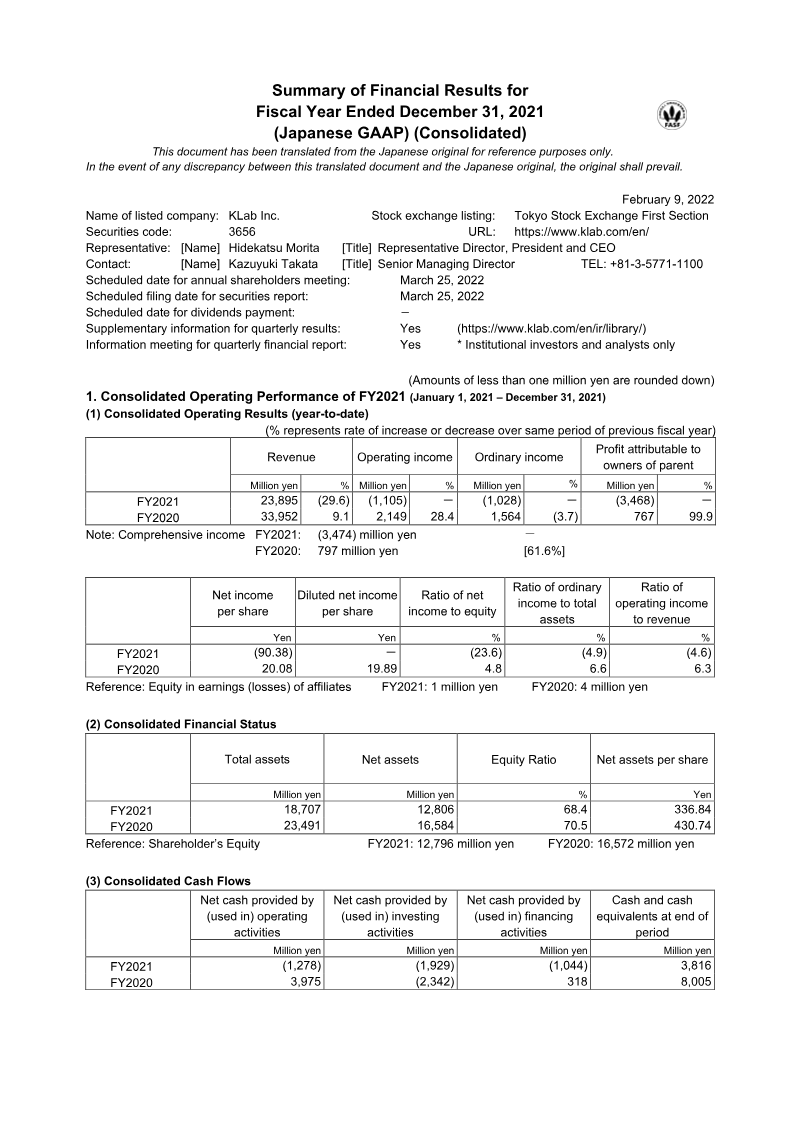
KLab Inc. swung from a ¥2.1 billion operating profit in 2020 to a ¥1.1 billion operating loss in 2021, with net losses reaching ¥3.47 billion.
See it on page 18Annual revenue declined by 29.6% to ¥23.9 billion, largely due to the underperformance of existing titles like 'Love Live! School Idol Festival ALL STARS' amid increased market competition.
See it on page 6The company's cash and cash equivalents dropped by ¥4.19 billion to ¥3.82 billion, while total net assets decreased from ¥16.58 billion to ¥12.81 billion.
See it on page 6Profit margins in the core Game Business segment eroded by over 60%, falling to ¥2.57 billion.
See it on page 17Financial results were further impacted by ¥1.68 billion in extraordinary impairment losses on software assets.
See it on page 10Management has withheld 2022 earnings forecasts due to market volatility and uncertainty regarding the release schedule of a major collaborative project with Electronic Arts.
See it on page 7KLab Inc. experienced a significant financial downturn during the fiscal year ended December 31, 2021, characterized by a sharp transition from profitability to substantial losses. Revenue fell by 29.6% to ¥23.9 billion, down from ¥33.9 billion the previous year. This decline was primarily driven by the underperformance of existing titles, most notably Love Live! School Idol Festival ALL STARS, which faced intensified market competition. The company shifted from a ¥2.1 billion operating profit in 2020 to a ¥1.1 billion operating loss, while the net loss attributable to owners reached ¥3.47 billion. This volatility resulted in a net loss of ¥90.38 per share, a stark reversal from the ¥20.08 per share profit recorded in the prior fiscal year.
The core Game Business segment saw its profit margin erode by over 60%, ending at ¥2.57 billion. Financial stability was further impacted by ¥1.68 billion in extraordinary impairment losses on software assets and negative operating cash flows. Consequently, total net assets decreased from ¥16.58 billion to ¥12.81 billion, and cash and cash equivalents plummeted by ¥4.19 billion to end the period at ¥3.82 billion. These figures reflect both the high costs of intangible asset development and the diminishing returns from the current mobile gaming portfolio within the Japanese market.
Looking forward, the outlook remains cautious as earnings forecasts for 2022 have been withheld. This decision stems from high levels of market volatility and uncertainty regarding the release schedule of a major collaborative project with Electronic Arts. While the company continues to focus on its game business, the depletion of cash reserves and the significant drop in net assets per share highlight a period of contraction and strategic transition. Management remains focused on navigating these headwinds through upcoming pipeline developments, though the immediate financial impact of these initiatives remains difficult to quantify.