FinancialKLab
Summary of Financial Results for First Half of Fiscal Year Ending December 31, 2017
1 Aug 201713 pages~17 min full read
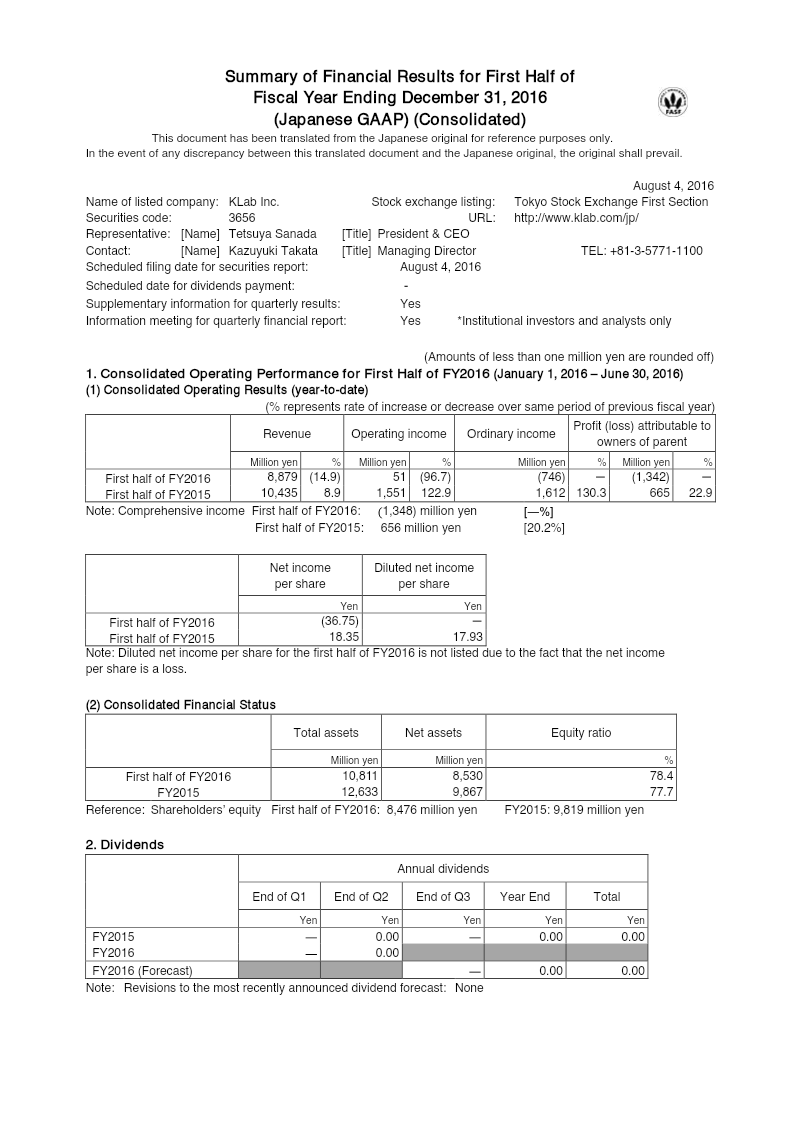
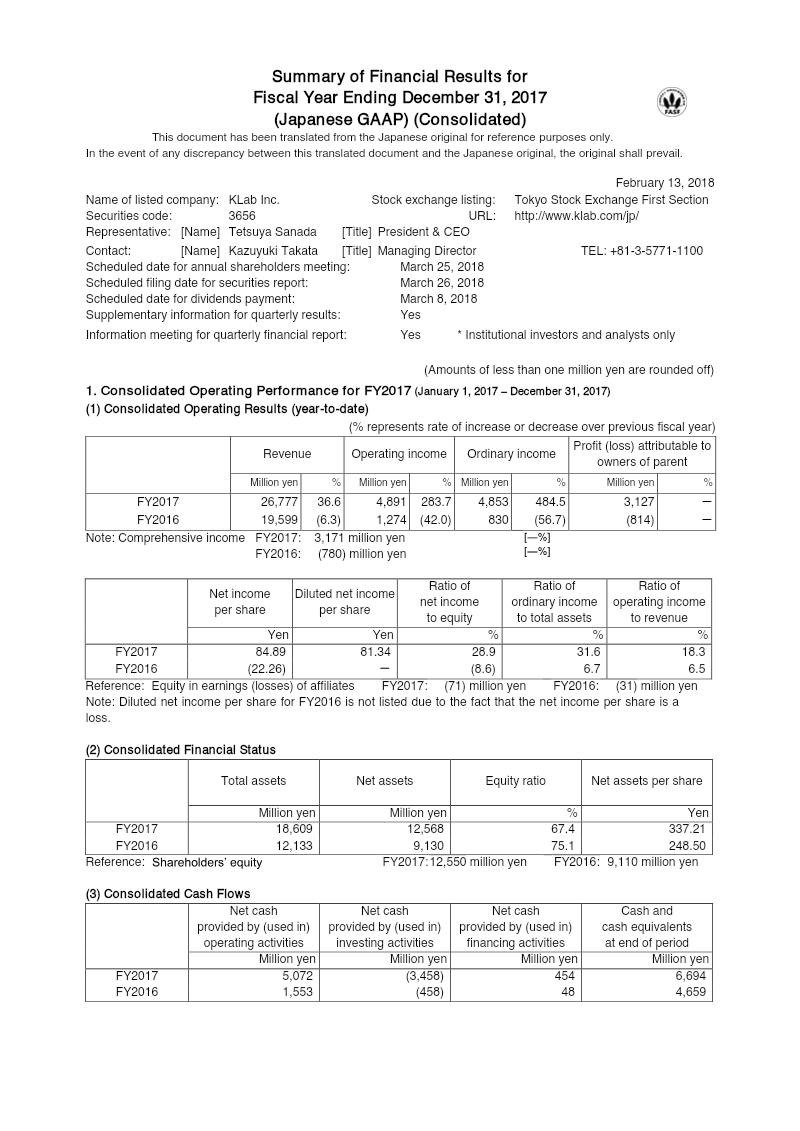
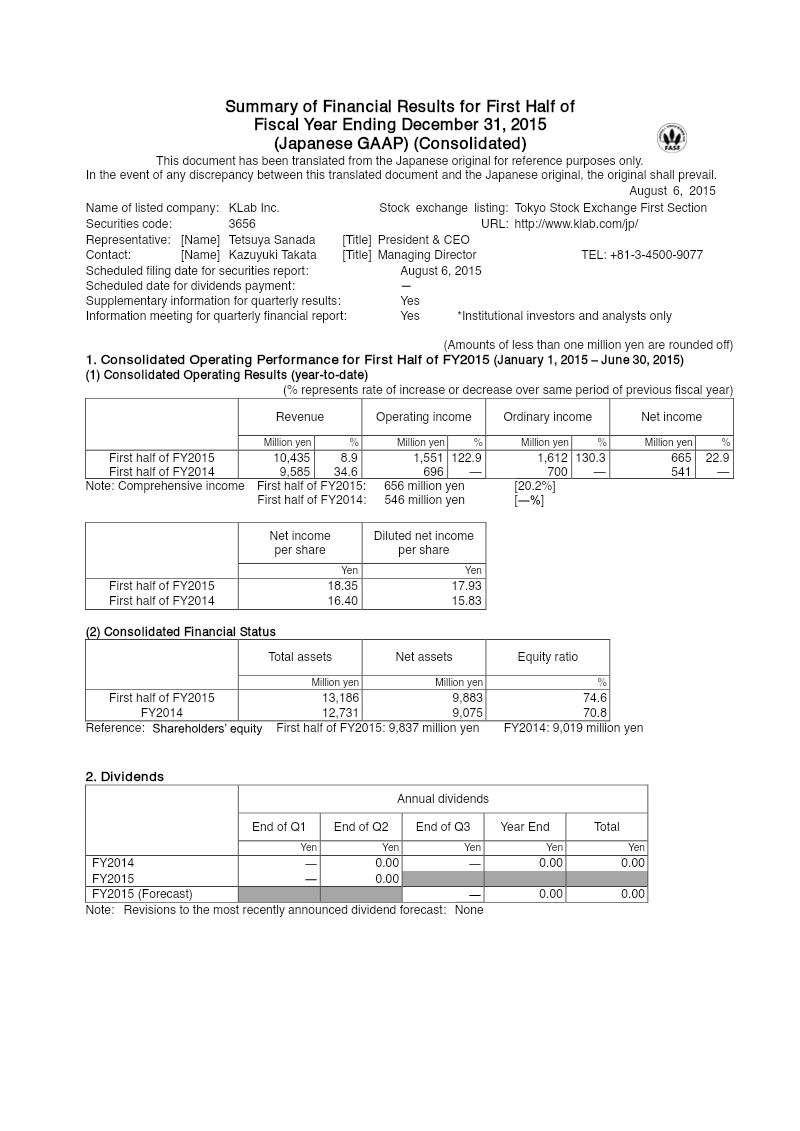
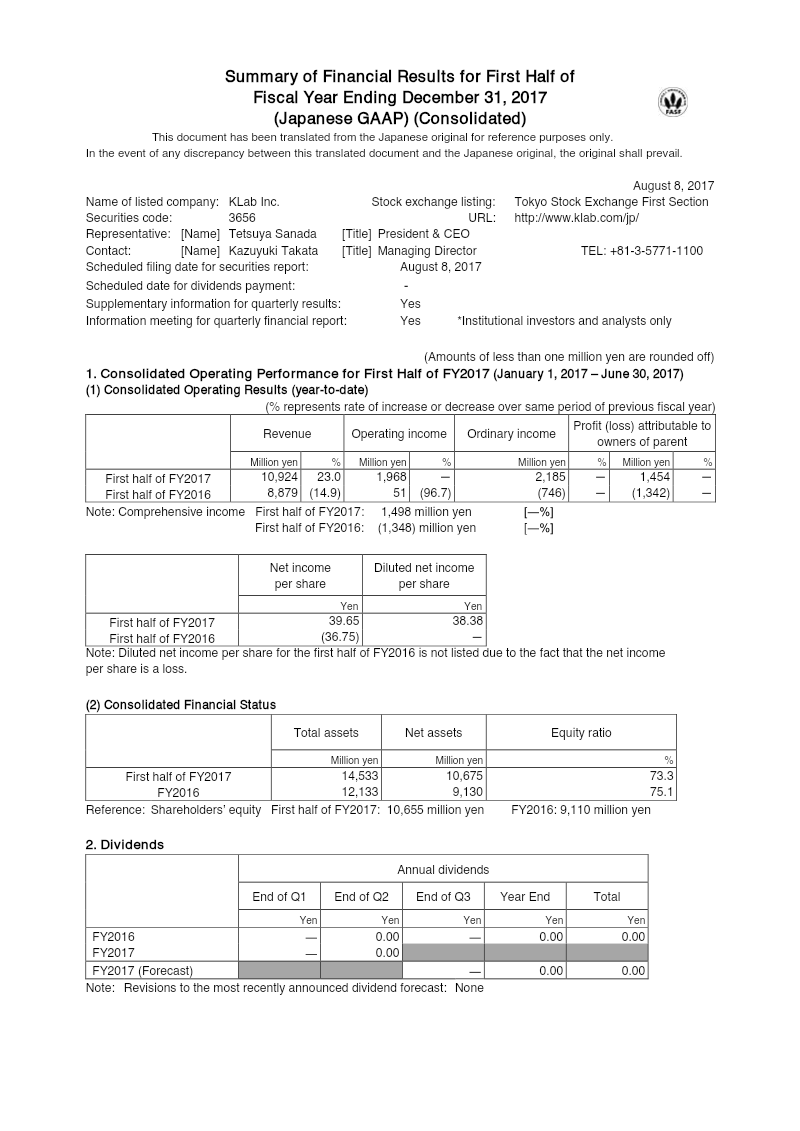
KLab Inc. achieved a significant financial turnaround in H1 2017, moving from a 1.3 billion yen net loss in 2016 to a 1.45 billion yen profit.
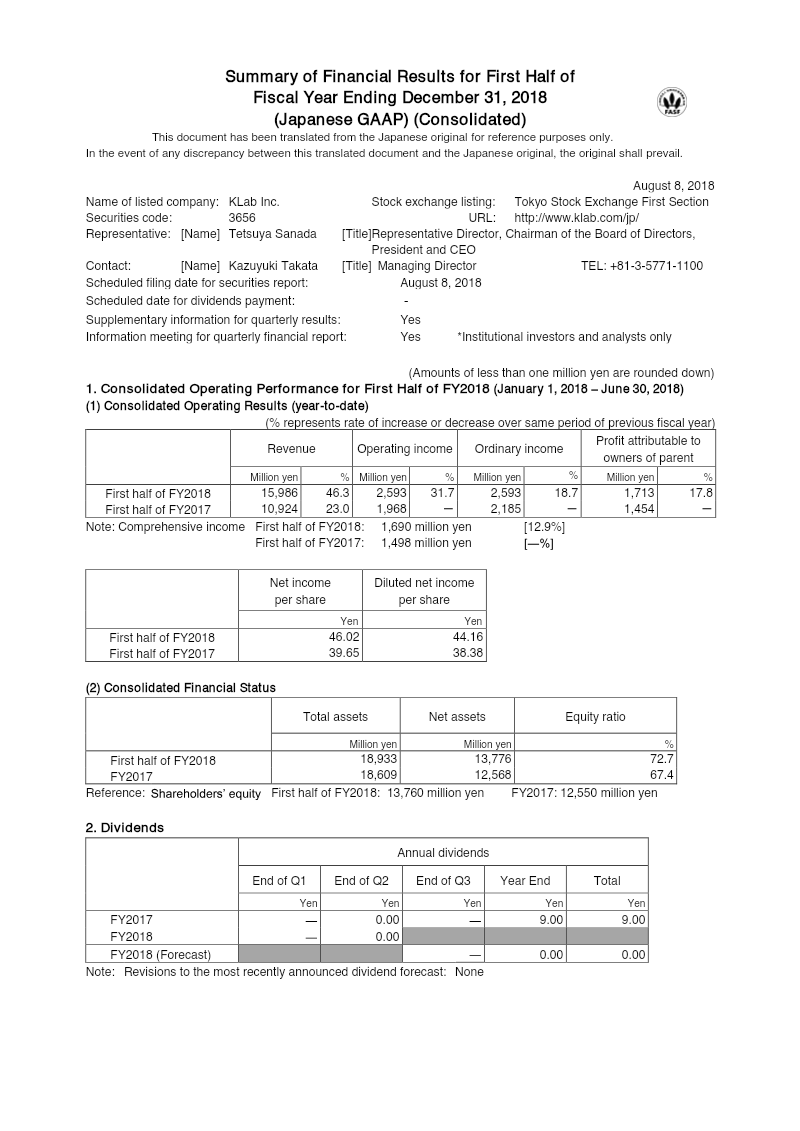
See it on page 4Revenue grew 23.0% year-over-year to 10.9 billion yen, bolstered by stable core title performance and the June 2017 launch of Captain Tsubasa: Tatakae Dream Team.
See it on page 4Operating income surged to 1.96 billion yen compared to 51 million yen in the same period of 2016, aided by a 6.6% reduction in selling, general, and administrative expenses.
See it on page 8Management revised full-year guidance upward, projecting revenue between 22.5 and 25.5 billion yen and ordinary income between 2.4 and 4.2 billion yen.
See it on page 2KLab acquired ABASEA Inc. and its subsidiary Spicemart Inc. for 1 billion yen in July 2017 to strengthen data analysis and consulting capabilities in the Japanese and Chinese mobile gaming markets.
See it on page 12The company maintains a strong financial position with total assets of 14.5 billion yen and an equity ratio of 73.3%.
See it on page 6This financial summary details the consolidated operating performance of KLab Inc. for the first half of the fiscal year ending December 31, 2017. Covering the period from January 1 to June 30, 2017, the findings reveal a significant financial turnaround compared to the same period in 2016. Revenue rose 23.0% to 10.9 billion yen, driven by the stable performance of core titles and the successful June launch of Captain Tsubasa: Tatakae Dream Team.
The transition from a net loss of 1.3 billion yen in the previous year to a profit of 1.45 billion yen highlights improved operational efficiency. Operating income reached 1.96 billion yen, a stark contrast to the 51 million yen reported in 2016. This growth was supported by a 6.6% reduction in selling, general, and administrative expenses—primarily through lower advertising and outsourcing costs—and a 175 million yen foreign exchange gain. The company’s financial position remains robust, with total assets increasing to 14.5 billion yen and an equity ratio of 73.3%.
Strategic developments noted include the July 2017 acquisition of ABASEA Inc. and its subsidiary Spicemart Inc. for 1 billion yen. This move aims to enhance KLab’s data analysis and consulting capabilities within the competitive mobile gaming markets of Japan and China. Methodologically, the report utilizes Japanese GAAP and introduces a range-based forecasting model for the full fiscal year. Management revised its annual guidance upward, projecting revenue between 22.5 and 25.5 billion yen and ordinary income between 2.4 and 4.2 billion yen, reflecting confidence in current market trends and the success rate of new game titles.