Related Documents

Financial
Q4 2025 Interim Report
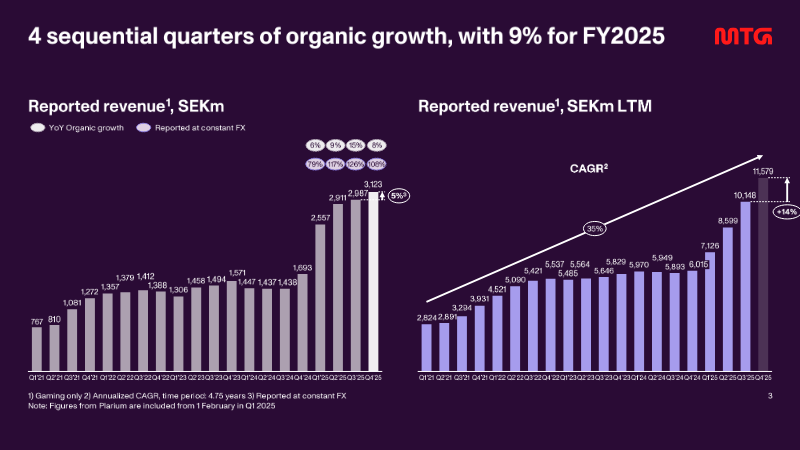
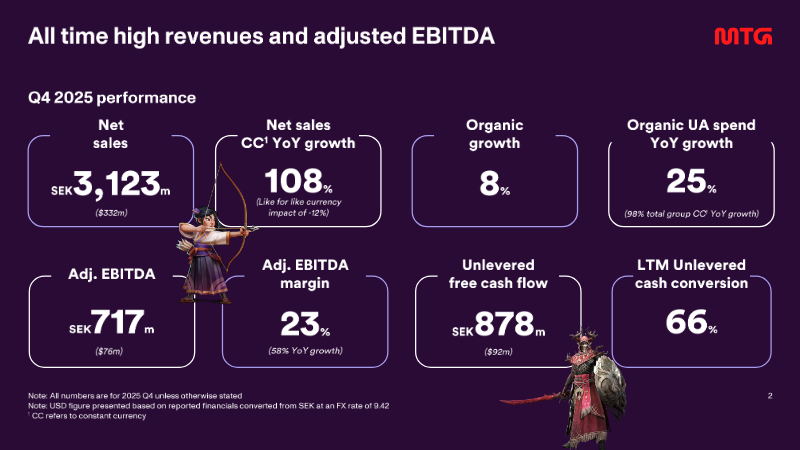
The interim filing presents the fourth‑quarter 2025 financial results for a midcore‑casual gaming group, emphasizing a record‑setting revenue run and the successful execution of a transformation agenda that includes the integration of the Plarium acquisition and the rollout of a new district structure in early 2026. Revenue reached SEK 3,123 million, reflecting 108 % organic growth year‑on‑year and a 25 % increase on a constant‑currency basis, while adjusted EBITDA rose to SEK 717 million, delivering a 23 % margin that matches the full‑year figure. Unlevered free cash flow amounted to SEK 878 million, with a cash‑conversion rate of 66 % and a leverage ratio of five times EBITDA, underscoring robust liquidity and disciplined capital management. User‑acquisition spending accelerated, representing 38 % of quarterly revenue—up from 37 % in the prior quarter—and grew 76 % on a reported basis, driven by heightened investment in original studios, new casual titles, and the racing franchise. The direct‑to‑consumer channel expanded by 600 basis points to 32 % of total revenue, reflecting a strategic shift toward higher‑margin in‑app purchases. Across the fiscal year, the company posted a 9 % organic revenue increase, with word‑games, racing, and RAID franchises delivering the strongest quarter‑end performance. Operating cash flow for the quarter stood at SEK 840 million, while adjusted net income was SEK 1,390 million, translating to an adjusted EPS of SEK 11.33. The financial outcomes exceed guidance and position the firm to meet its medium‑term outlook, with a pre‑IPO study for PlaySimple concluded and the midcore transformation progressing as planned.
Modern Times GroupFeb 2026
Report
2023 Casual Gaming Apps Report
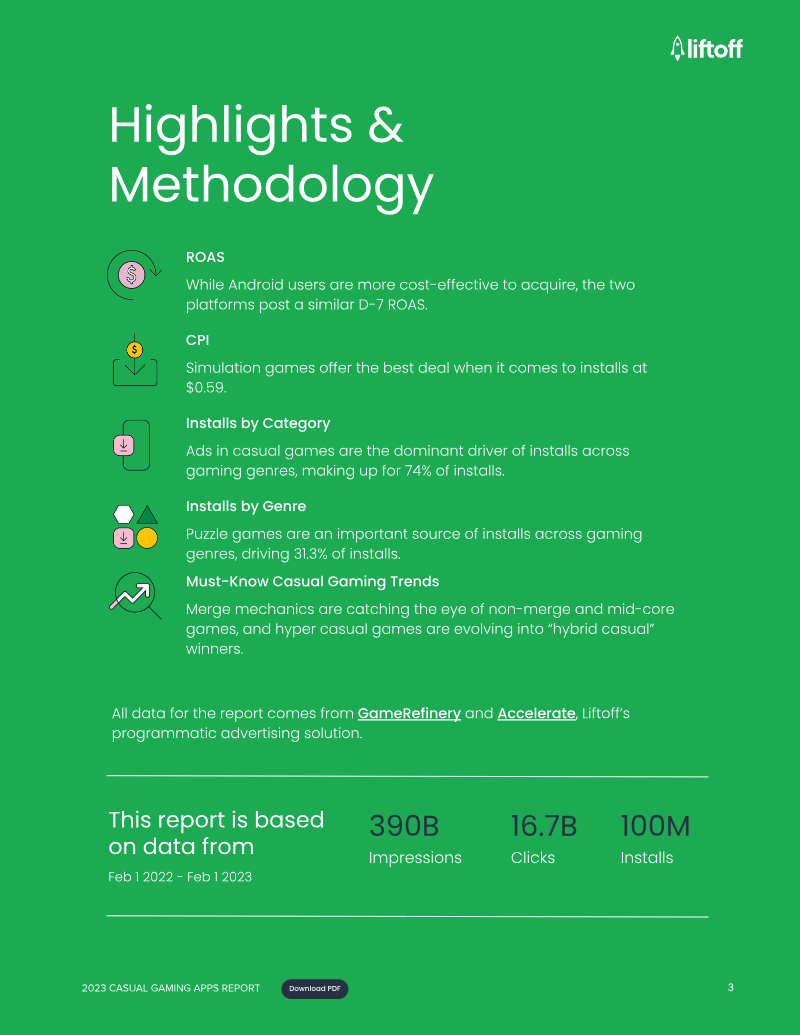
The casual gaming landscape in 2023 is defined by a strategic pivot from rapid user acquisition toward long-term profitability and sophisticated engagement models. While iOS acquisition costs significantly exceed those of Android at $2.23 compared to $0.63, both platforms achieve a comparable Day-7 return on ad spend of approximately 7.7%. North America remains the most expensive yet lucrative market, yielding an 8.1% return on ad spend despite a high $3.59 cost per install. Simulation games have emerged as a particularly efficient entry point for developers, maintaining the lowest acquisition costs at $0.59. Casual titles serve as the primary engine for the broader mobile ecosystem, driving 74% of installs across all gaming categories and nearly 75% of mid-core installs. Hyper-casual and puzzle games remain the dominant traffic sources, but the industry is increasingly embracing hybridization. This trend involves layering complex meta-elements, such as narrative progression and competitive social features, over simple core mechanics. By blending ad-based and in-app purchase monetization models, developers are successfully targeting crossover audiences and extending the lifecycle of traditionally short-lived genres. Engagement strategies now heavily rely on competitive mechanics and gameplay diversification. Approximately 90% of leading level-based titles utilize solo leaderboards, while over half incorporate team-based races, debunking the myth that casual players avoid competitive environments. Furthermore, nearly a quarter of top-grossing casual games integrate minigames, such as hidden object or board game mechanics, to refresh the user experience and lower acquisition barriers. These features collectively deepen player retention and monetization, signaling a shift toward more robust, feature-rich casual experiences that prioritize player depth over simple volume.
LiftoffJan 2023

Report
Enabling Growth: Cohort User Acquisition Financing
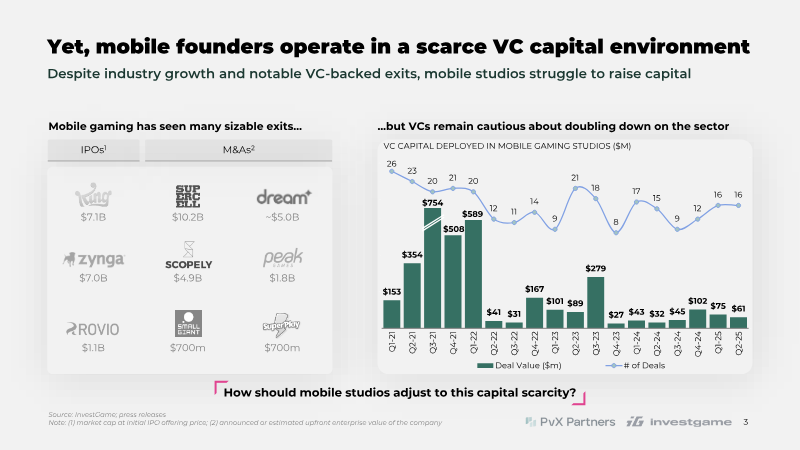
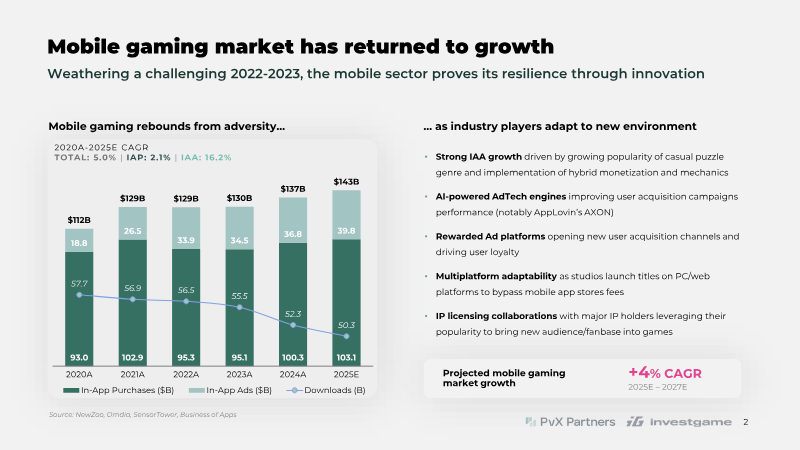
Mobile gaming has rebounded from the downturn of 2022‑23, with a projected compound annual growth rate of 5.0% from 2020 to 2025, driven largely by a 16.2% rise in in‑app advertising and the continued popularity of casual puzzle titles. The sector’s resilience is underpinned by AI‑powered ad tech, rewarded advertising platforms, multiplatform releases that bypass app‑store fees, and strategic IP licensing collaborations. Despite this growth, venture capital remains cautious; VC deployments in mobile studios have plateaued while high‑profile exits such as King, Zynga, and Playtika illustrate that capital is still scarce. Mature studios reinvest roughly one‑third of revenue into user acquisition (UA), yet only a minority secure the $30 million+ funding needed to sustain such spend, and smaller studios often allocate 70% or more of net revenue to marketing. PvX Partners’ cohort‑based UA financing addresses this gap by providing credit secured against future cohort revenues. The model offers up to 80% of monthly customer acquisition costs, recovers 80% of net revenues until repayment, and imposes a modest interest rate tied to Net Return on Ad Spend (ROAS). Case studies show that studios receiving this financing can increase monthly spend by 16–38% while boosting cash balances, achieving accelerated growth and faster exits—examples include Playtika’s acquisition of a $2 billion‑valued studio within 35 months. Overall, the analysis suggests that cohort‑based UA financing can unlock scalable growth for mobile studios that lack traditional VC backing, potentially expanding the market’s total UA spend from $143 billion to an additional $3.2 billion by 2027, while maintaining equity and IP control for founders.
HPvX Partners
Report
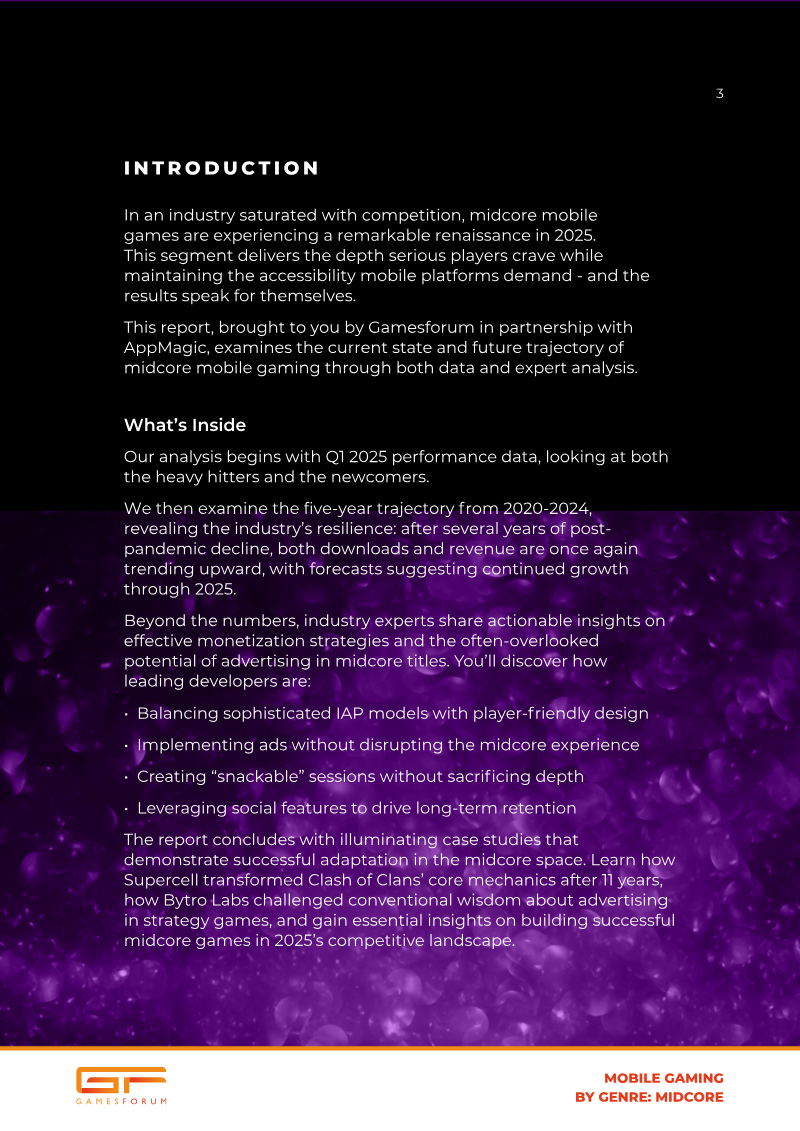
Mobile Gaming by Genre: Midcore
The analysis demonstrates that midcore mobile games—those offering depth while remaining accessible on handheld devices—are experiencing a post‑pandemic rebound, with Q1 2025 downloads and revenue surpassing 2024 levels. Five‑year data (2020‑2024) reveal a temporary decline during the pandemic, followed by a steady uptick in 2024 and forecasts that growth will continue into 2025. The primary thesis is that monetization success in this segment hinges on data‑driven ad integration and player‑centric design. Key findings show that midcore titles command higher eCPMs than casual games, yet player retention and in‑app purchase (IAP) conversion rates are sensitive to ad placement. A phased, A/B‑tested approach—beginning with limited rewarded videos and expanding based on performance metrics such as retention, playtime, and IAP conversions—maximizes revenue while preserving engagement. Case studies illustrate tangible benefits: Bytro Labs’ rewarded video strategy lifted average revenue per daily active user (ARPDAU) by 32.9 %, increased Day‑3 retention on iOS by 6.1 %, and achieved eCPMs of 23 (iOS) and 25 (Android). These results confirm that well‑timed ads can rival or complement IAP revenue when aligned with player incentives. The scope covers the global midcore mobile market, focusing on 2025 performance and projecting trends through 2026. It emphasizes long‑term player value, streamlined gameplay, social hooks, and frequent content updates as critical success factors. The conclusions underscore that responsive development cycles, continuous data analysis, and fair live‑service practices are essential for sustaining growth in the competitive midcore landscape.
InvestGame