Related Documents
Financial
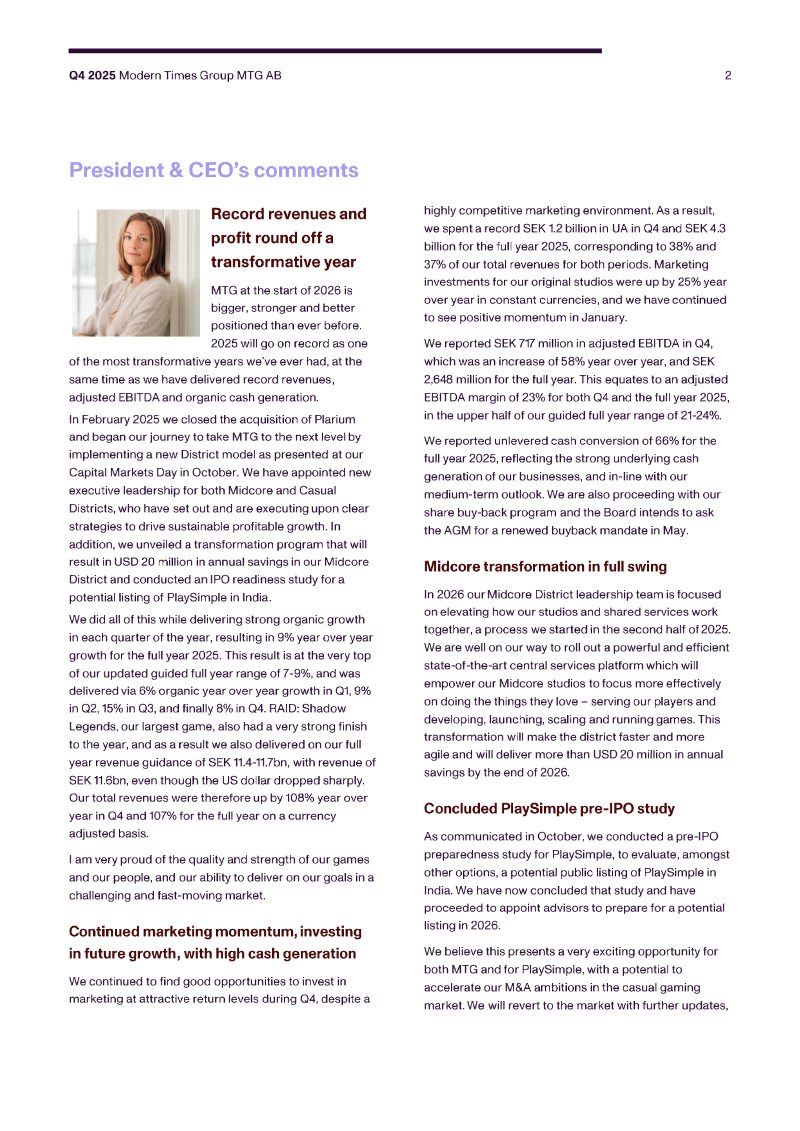
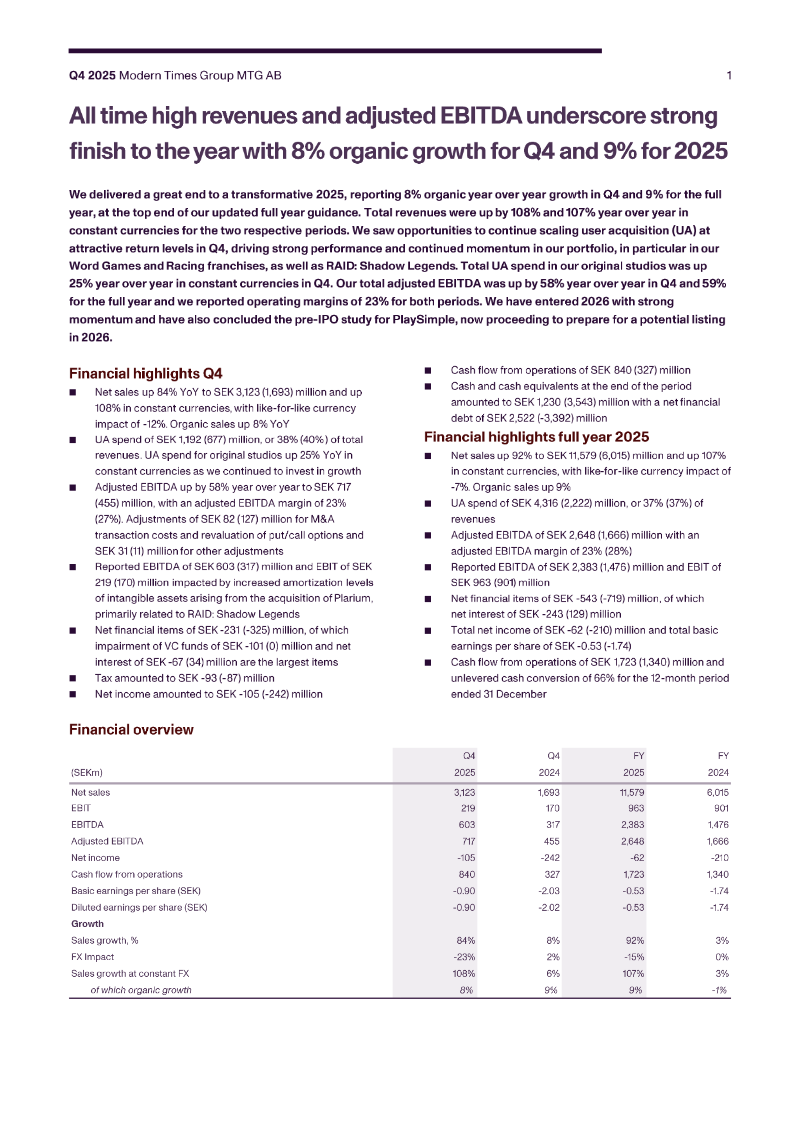
Q4 2025 Financial Report: Modern Times Group
Modern Times Group delivered a record‑setting performance for the fourth quarter of 2025, underscoring the company’s momentum in the digital entertainment sector. Organic revenue expanded by 8 percent, which translates to a 108 percent increase when measured in constant‑currency terms, and net sales reached SEK 3.1 billion. These figures reflect the strength of the group’s core portfolio and its ability to generate growth despite a volatile macro‑economic environment. A pivotal element of the results was the integration of Plarium, which was completed on 12 February 2025 and consolidated from 31 January. The acquisition contributed SEK 5,384 million in sales for the quarter and produced SEK 495 million of income before tax, after accounting for SEK 786 million of purchase‑price amortisation. When the acquisition is modelled as if it had been in place from the start of the year, total sales for 2025 would have risen to SEK 12,137 million, with pre‑tax income of SEK 398 million, albeit offset by SEK 1,269 million of amortisation. The combined impact of robust organic growth and the strategic addition of Plarium positions Modern Times Group as a leading player in the global gaming market. The financial outcomes demonstrate that the company’s acquisition strategy is delivering immediate scale and profitability, while its underlying business continues to expand at a pace that exceeds prior expectations. This performance suggests a durable growth trajectory for the remainder of the fiscal year and beyond.
Modern Times GroupFeb 2026
Financial
Press Release: Nacon Acknowledges Bigben Interactive Financial Situation
Nacon has issued a formal response to the financial instability of its majority shareholder, Bigben Interactive, following a critical liquidity failure. Bigben Interactive, which controls 56.72% of Nacon’s share capital and 65.79% of its voting rights, was unable to meet a scheduled €43 million partial bond repayment due on February 19, 2026. This default was triggered by an unexpected refusal from Bigben Interactive’s banking pool to honor a drawdown notice intended to fund the debt obligation. Consequently, the parent company is now exploring court-supervised debt restructuring procedures to address its insolvency. The scope of this announcement focuses on the immediate financial risks facing Nacon as a subsidiary within the broader European gaming market. While Nacon reported an IFRS revenue of €167.9 million and an operating profit of €1.1 million for the 2024/2025 fiscal year, the parent company’s inability to secure financing creates significant uncertainty regarding Nacon’s own operational funding and strategic stability. The company currently manages 16 development studios and a workforce of over 1,000 employees, maintaining a distribution network that spans 100 countries. Management is currently conducting a comprehensive assessment of how this shareholder-level debt crisis will impact Nacon’s internal activities and existing financing arrangements. As a publicly traded entity on the Euronext Paris, Nacon has committed to providing further market updates as the situation evolves. The primary objective of this communication is to maintain transparency with investors and stakeholders while the company evaluates the potential contagion effects of Bigben Interactive’s restructuring efforts on its publishing and peripheral manufacturing divisions.
NaconFeb 2026

Legal
Current Report ESPI No. 2/2026: Registration of Share Capital Increase and Statute Amendments
PlayWay S.A., a prominent Polish game developer and publisher, officially registered an increase in its share capital on February 17, 2026. This corporate action, finalized by the District Court for the Capital City of Warsaw, involved raising the share capital from 660,000.00 PLN to 666,600.00 PLN. The increase was achieved through the issuance of 66,000 Series J ordinary bearer shares, each carrying a nominal value of 0.10 PLN. This issuance effectively exhausts the company's remaining authorized capital, leaving the balance of target capital at zero. The capital expansion was executed under the framework of authorized capital previously established by the Management Board in August 2025. A critical component of this issuance was the total exclusion of pre-emptive rights for existing shareholders, a move intended to facilitate the dematerialization of the new shares and streamline the capital raising process. Following this registration, the total number of shares across all series—ranging from Series A through Series J—amounts to 6,666,000, with each share corresponding to one vote at the General Meeting. Beyond the financial adjustments, the registration necessitated formal amendments to the company’s Articles of Association, specifically regarding the wording of Paragraph 6 to reflect the new capital structure. This regulatory filing serves as a formal notification to the market and relevant financial authorities, ensuring transparency regarding the company’s equity structure and voting rights. The action concludes a process initiated in late 2025 and solidifies the company's current financial standing within the Polish capital market.
PlayWayFeb 2026


Financial
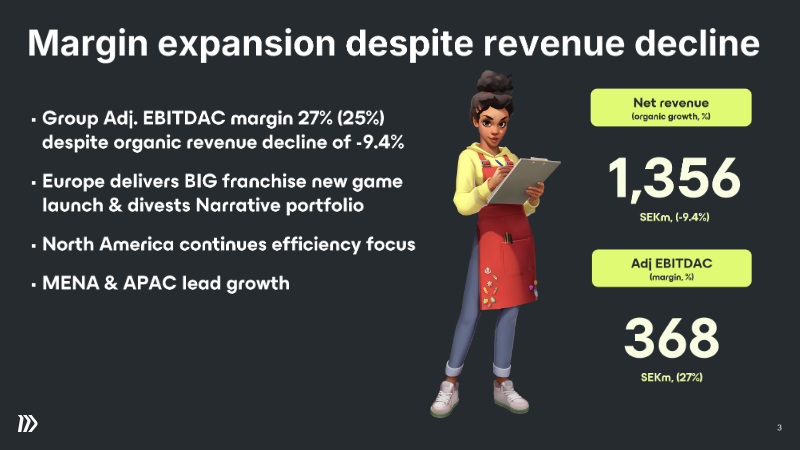
Stillfront Group: Q4 2025 Earnings Release
The release reports that Stillfront Group’s Q4 2025 performance achieved a 27 % adjusted EBITDAC margin, up from 25 % in the prior year, despite a 9.4 % decline in organic revenue to SEK 1,356 million. Europe drove the margin expansion through a new franchise launch and the divestiture of Narrative, while North America maintained an efficiency focus. MENA & APAC contributed to growth in both margin and revenue, with the SEKm portfolio delivering a 27 % margin. Key franchises such as Supremacy, Home Design, and Jawaker remained central to the group’s strategy. The company highlighted a shift from three operating segments to a single segment structure, consolidating Europe, North America, and MENA & APAC under one umbrella to streamline reporting. This reorganisation also reduced the number of key franchises from 5 to 2 in Europe, 2 in North America, and 3 in MENA & APAC. Free cash flow for Q4 2025 was SEK 922 million, down from SEK 1,050 million in Q4 2024, driven by a lower cash flow from operations (SEKm) and higher acquisition costs. Net debt stood at SEK 6,125 million with a leverage ratio of 2.2x against adjusted pro‑forma LTM EBITDA, indicating a moderate debt burden. The group’s forward‑looking priorities include continued margin improvements, disciplined investment in key franchises, maintaining healthy cash flows, and ongoing strategic reviews. These initiatives aim to sustain profitability while supporting growth across its global portfolio.
Stillfront GroupFeb 2026