Related Documents
Whitepaper
2026 Global Mobile App Marketing Trends White Paper
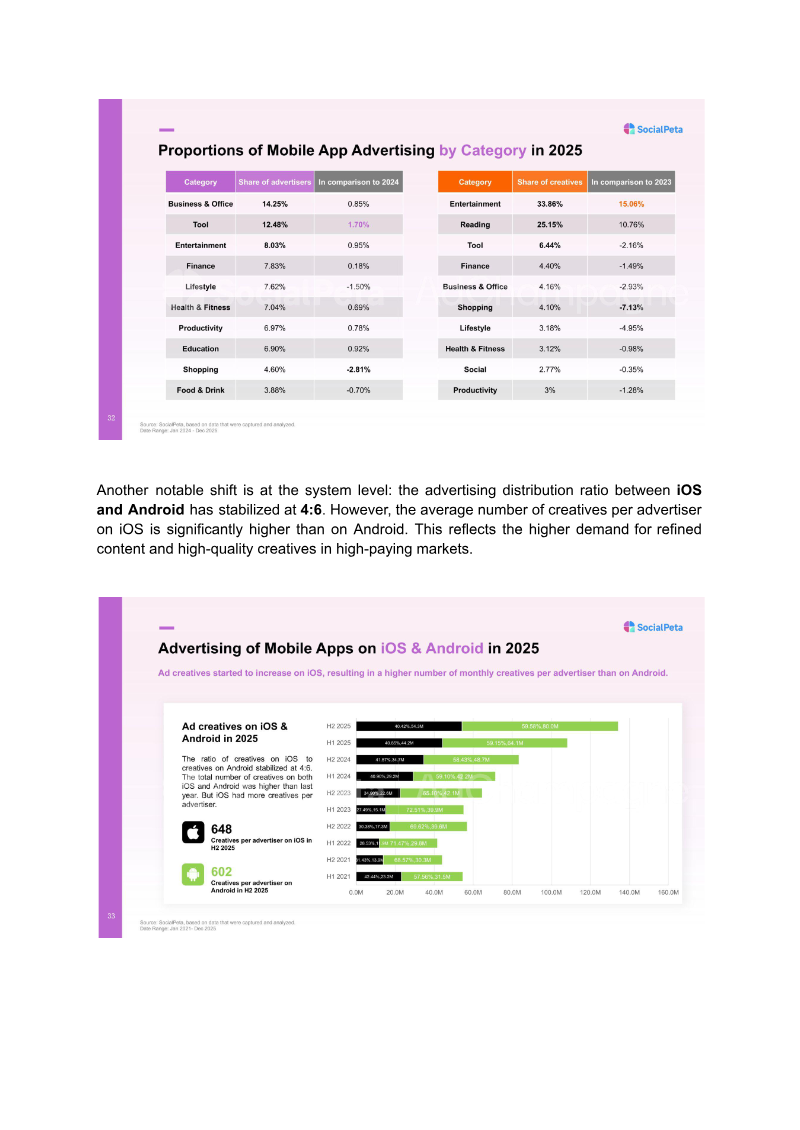
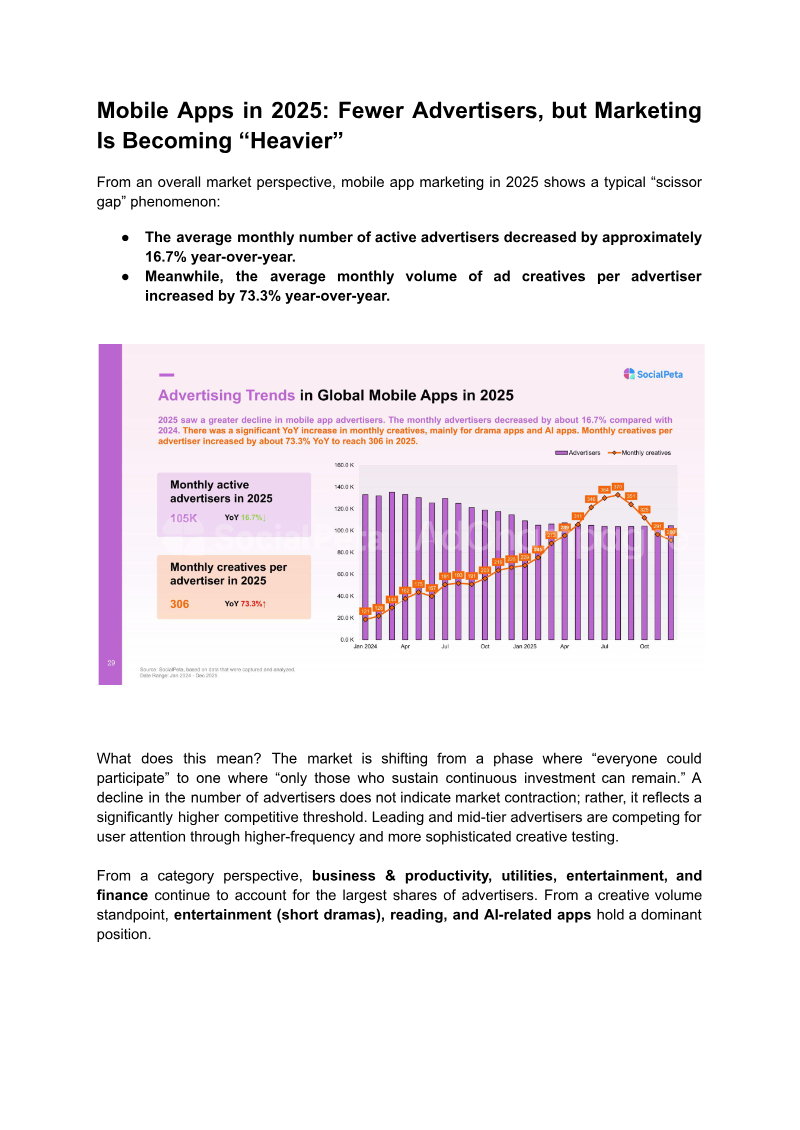
The white paper argues that the 2025 mobile app market has shifted from volume‑driven traffic growth to value‑centric, technology‑enabled optimization. It identifies a “scissor gap” where the number of active advertisers fell 16.7 % YoY while creatives per advertiser rose 73.3 %, indicating higher competitive thresholds and a focus on creative quality. Market share remains strongest in business & productivity, utilities, entertainment, and finance, but creative volume is dominated by short‑drama, reading, and AI apps. iOS and Android advertising ratios stabilized at 4:6, with iOS advertisers producing more creatives due to higher monetization expectations. User acquisition spend reached $78 billion, a 13 % YoY increase driven almost entirely by iOS, with e‑commerce, fintech, and betting leading non‑gaming verticals. Video remains the dominant ad format (≈70 % of social inventory), while static and playable ads serve testing, Android traffic, and engagement signals. AI has moved from a marketing tool to a core capability; leading AI apps scale through volume and quality, while many smaller entrants exit due to weak monetization. Finance apps maintain steady growth focused on user quality, lifetime value, and compliance, contrasting with AI’s rapid scaling. North America remains the most selective market, demanding high content quality and long‑term trust; success here signals scalability elsewhere. The paper concludes that sustainable growth now hinges on creative capability, system efficiency, AI integration, and long‑term value creation rather than sheer traffic volume.
SocialPetaApr 2026


Report
Insight into Global Micro Drama App Marketing for 2026
SocialPeta’s analytics platform aggregates data from more than 90,000 micro‑drama advertisers and 80 million ad creatives across over 55 countries, positioning itself as a key resource for launching and scaling micro‑drama apps worldwide. The platform projects the global micro‑drama market to reach $6 billion by 2026, emphasizing its capacity to deliver actionable insights into advertising strategies, creative formulas, and regional audience preferences. In 2025 the ecosystem expanded sharply: active advertisers rose by 63.6 % to over 700, while each advertiser produced a 144.9 % increase in creatives, largely thanks to AI‑powered production tools. Southeast Asia dominated genre preferences for “reversal of fortune” and “rebirth” dramas, whereas North America’s high‑paying users gravitated toward premium romance content. Europe remained the largest source of creative volume, underscoring a sustained upward trend in both advertiser participation and output across the globe. A case study of “Evil Bride vs. The CEO’s Secret Mom” illustrates high‑impact marketing: 44 K creatives generated an estimated 2.7 B impressions in key markets such as the USA, UK, Canada, Australia, and Germany. AI‑driven tools—DSV restructuring and automated cover/clip generation—reduced production time, enabling rapid localization. Short, cliffhanger‑style ads with intense conflict and strong visual hooks outperformed longer formats, driving downloads and engagement in North America, Southeast Asia, Latin America, and the Middle East. By late 2024 vertical micro‑dramas had matured into a stable ecosystem, with regional preferences—“reversal of fortune” in Southeast Asia and conflict‑driven stories in Latin America—fueling audience engagement. Production scaled to 55 vertical dramas in 2025 through standardized pipelines and AI‑enhanced marketing, allowing faster creative validation, lower volatility, and continuous data‑driven optimization. The analysis stresses that audience‑first IP development—testing concepts in short form before scaling—and multi‑platform, AI‑supported workflows are essential for reducing creative risk and converting IP into long‑term company capital.
SocialPetaApr 2026


Financial
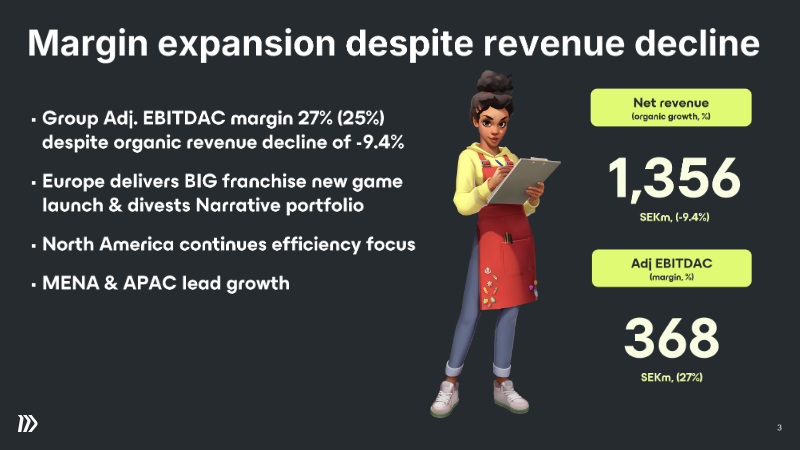
Stillfront Group: Q4 2025 Earnings Release
The release reports that Stillfront Group’s Q4 2025 performance achieved a 27 % adjusted EBITDAC margin, up from 25 % in the prior year, despite a 9.4 % decline in organic revenue to SEK 1,356 million. Europe drove the margin expansion through a new franchise launch and the divestiture of Narrative, while North America maintained an efficiency focus. MENA & APAC contributed to growth in both margin and revenue, with the SEKm portfolio delivering a 27 % margin. Key franchises such as Supremacy, Home Design, and Jawaker remained central to the group’s strategy. The company highlighted a shift from three operating segments to a single segment structure, consolidating Europe, North America, and MENA & APAC under one umbrella to streamline reporting. This reorganisation also reduced the number of key franchises from 5 to 2 in Europe, 2 in North America, and 3 in MENA & APAC. Free cash flow for Q4 2025 was SEK 922 million, down from SEK 1,050 million in Q4 2024, driven by a lower cash flow from operations (SEKm) and higher acquisition costs. Net debt stood at SEK 6,125 million with a leverage ratio of 2.2x against adjusted pro‑forma LTM EBITDA, indicating a moderate debt burden. The group’s forward‑looking priorities include continued margin improvements, disciplined investment in key franchises, maintaining healthy cash flows, and ongoing strategic reviews. These initiatives aim to sustain profitability while supporting growth across its global portfolio.
Stillfront GroupFeb 2026

Report
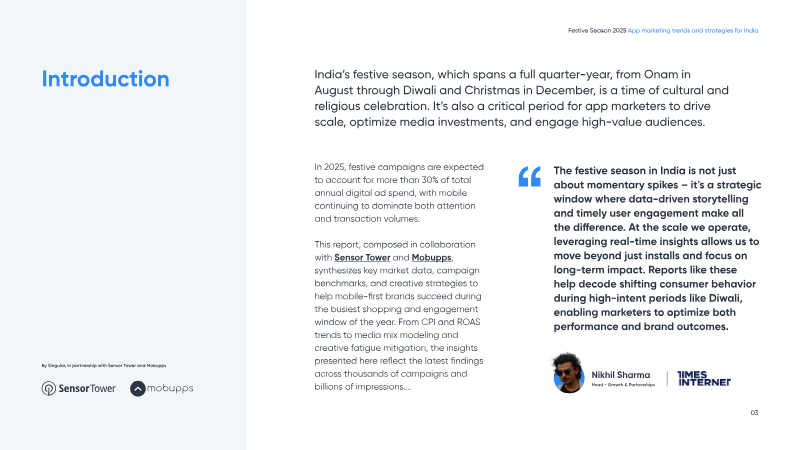
Festive Season 2025: App Marketing Trends and Strategies for India
India’s festive season—from Onam in August through Diwali and Christmas in December—drives more than 30 % of the country’s annual digital advertising spend, making it a pivotal period for app marketers. In 2024, mobile games alone attracted over 3.2 billion downloads and generated $151 million in‑app purchase revenue, while non‑gaming verticals such as shopping, food delivery and OTT experienced sharp install spikes during key festivals. The data reveal a 53 % rise in mobile ad spend from Q1‑Q2 to Q3‑Q4, with installs up 36 % and re‑engagements soaring 69 % during the peak festive window, underscoring the season’s high‑value user acquisition and monetisation potential. User‑acquisition efficiency improved markedly, with CPI falling by approximately 12 % while CPA remained stable. Video and playable ads delivered the highest ROAS—up to 4.2× in fintech and 3.8× in e‑commerce—and programmatic/OEM placements on Xiaomi and Samsung yielded significant conversion lifts, particularly in Tier‑2 and Tier‑3 cities. Creatives that refreshed weekly, incorporated localized language, and employed urgency cues such as countdowns outperformed static ads, highlighting the need for agile, culturally relevant creative and a diversified media mix that extends beyond Meta and Google into programmatic and OEM channels. Marketers are increasingly leveraging data‑driven platforms—Singular, MobuppsX, Sensor Tower, Pathmatics and others—to optimise acquisition, retention and media spend. By integrating MAFO, iRTB, advanced fraud prevention and audience‑retention analytics, brands can reduce wasted spend, improve advertising ROI and accelerate growth across web, social and mobile channels. A unified data‑house approach enables faster campaign optimisation, measurable engagement gains and stronger competitive positioning during India’s lucrative festive period.
InvestGameJan 2026