Related Documents
Financial
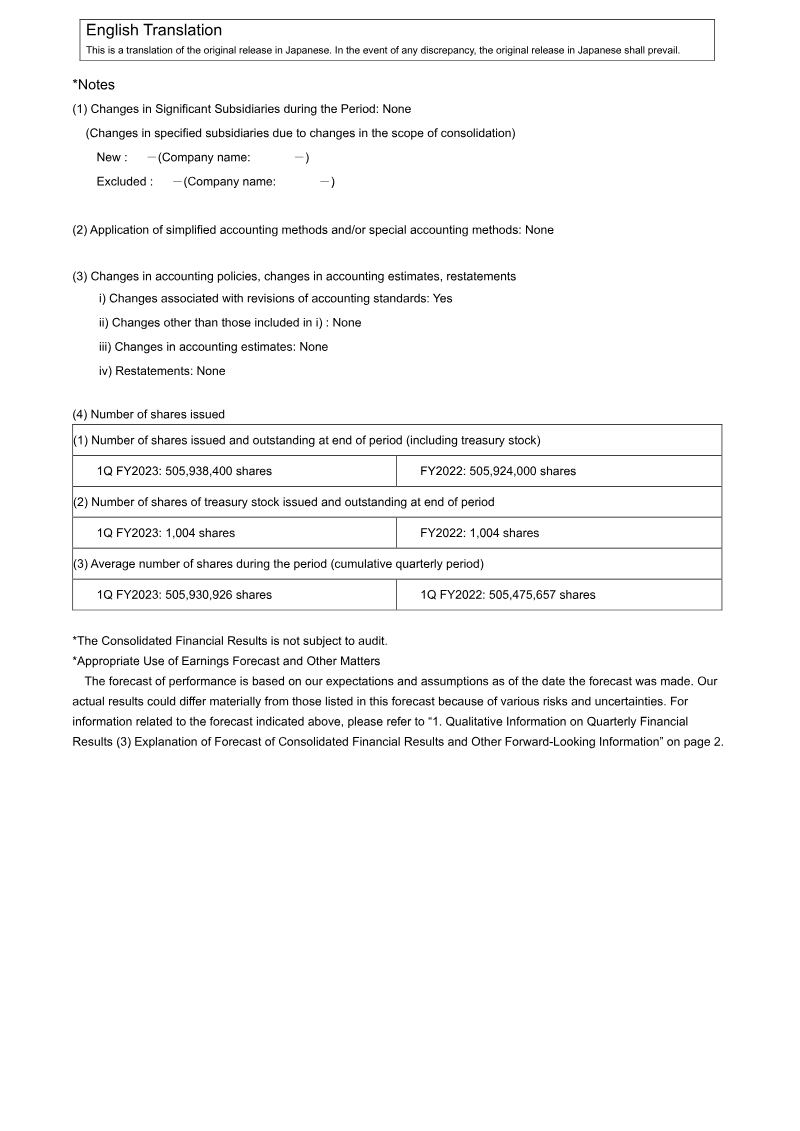
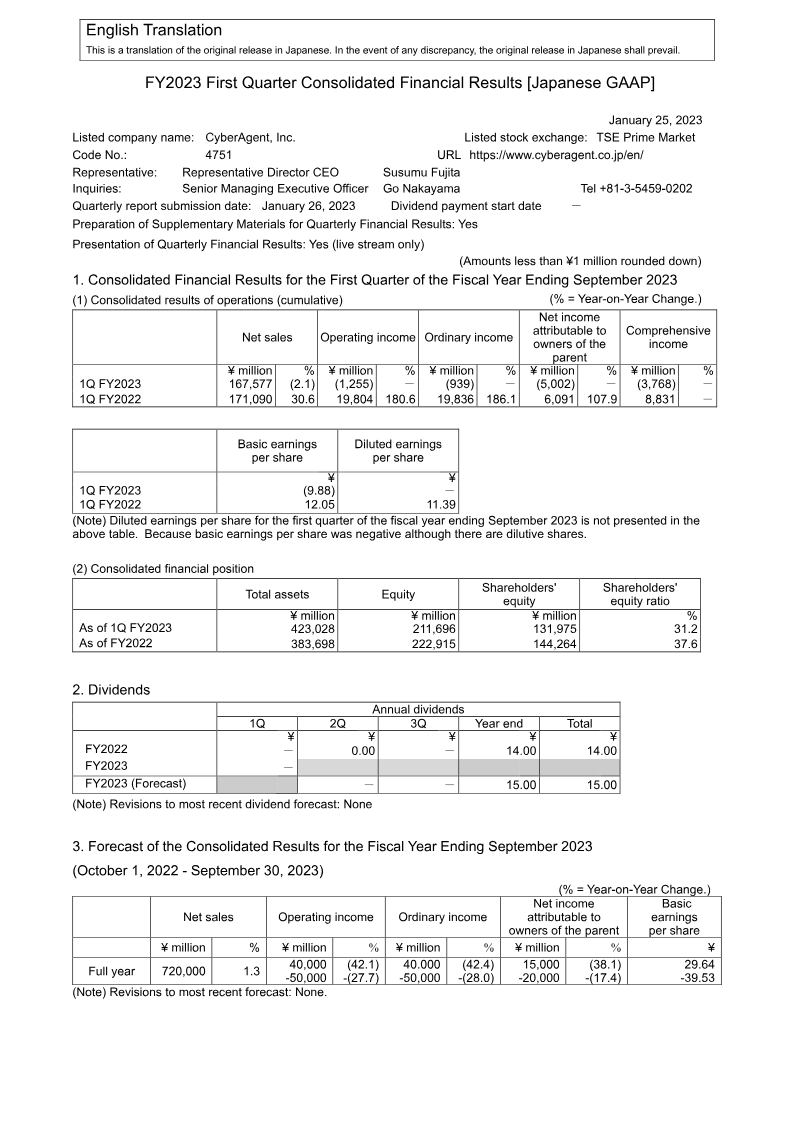
FY2023 First Quarter Consolidated Financial Results [Japanese GAAP]
CyberAgent’s consolidated financial results for the first quarter of the fiscal year ending September 30, 2023, reveal a period of strategic investment and market fluctuation. Covering the period from October 1, 2022, to December 31, 2022, the data shows a slight year-on-year decline in net sales of 2.1%, totaling ¥167,577 million. The company shifted from a significant operating income of ¥19,804 million in the previous year to an operating loss of ¥1,255 million. This downturn resulted in a net loss attributable to owners of the parent of ¥5,002 million, compared to a ¥6,091 million profit in the same quarter of the prior year. Performance varied significantly across business segments. The Media Business, which includes ABEMA and Ameba, saw a 34% increase in net sales to ¥33,485 million, driven largely by the distribution of the FIFA World Cup Qatar 2022. However, high content and distribution costs led to an expanded operating loss of ¥9,356 million for the segment. The Internet Advertisement Business remained a stable core, growing sales by 8.9% to ¥95,639 million, though operating income dipped 13% due to economic conditions. Conversely, the Game Business experienced a sharp decline, with sales falling 29.9% to ¥40,916 million and operating income dropping 69.6% to ¥5,212 million as major titles moved away from their anniversary peaks. The consolidated financial position shows total assets increased to ¥423,028 million, primarily due to the issuance of convertible bonds, which also contributed to a rise in total liabilities to ¥211,331 million. Despite the quarterly loss, the company maintained its full-year forecast, projecting net sales of ¥720,000 million and operating income between ¥40,000 and ¥50,000 million. The report, prepared under Japanese GAAP, indicates that while short-term profitability was impacted by heavy media investments and game cycle volatility, the company continues to focus on the medium-to-long-term growth of its smartphone-based services.
CyberAgentJan 2023
Financial
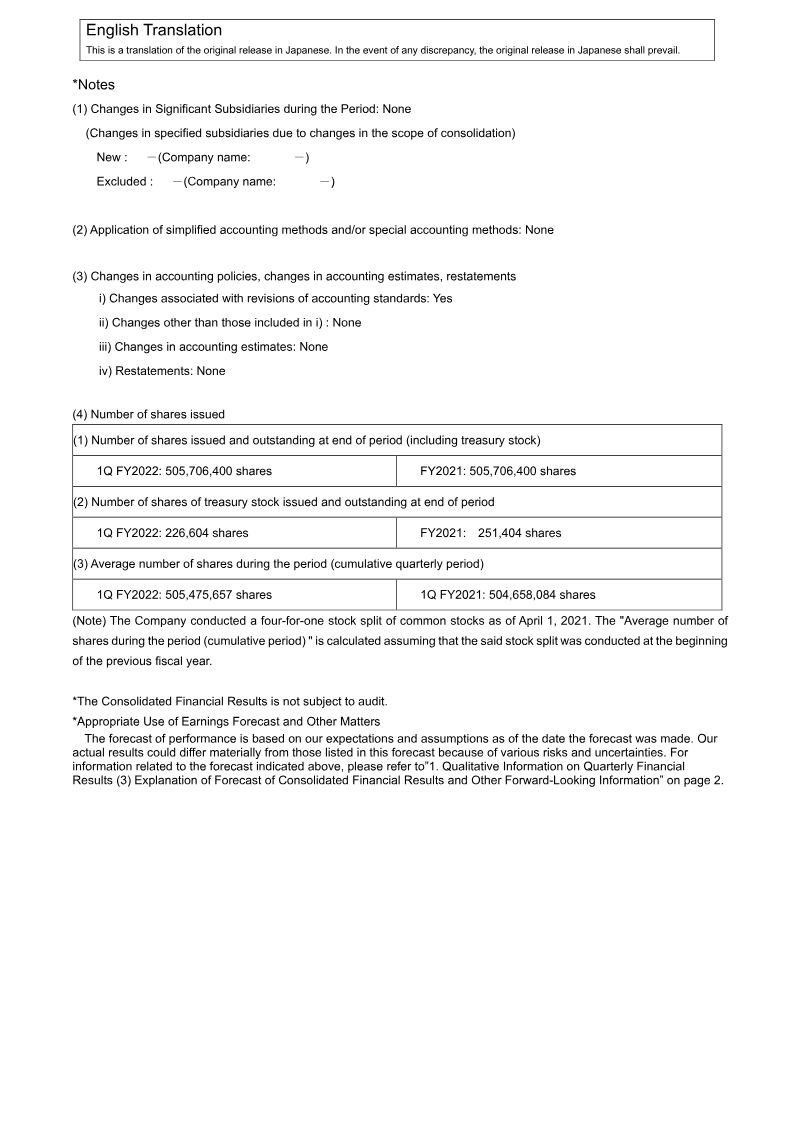
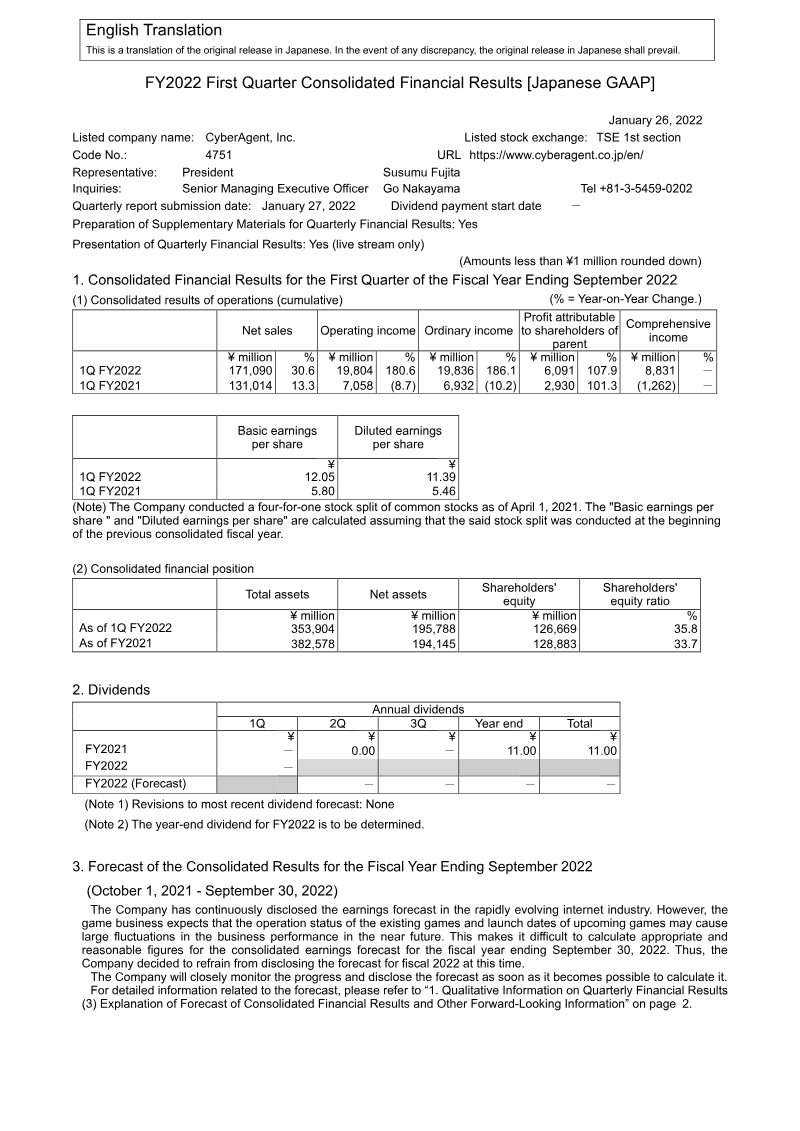
FY2022 First Quarter Consolidated Financial Results (Japanese GAAP)
CyberAgent’s consolidated financial results for the first quarter of the fiscal year ending September 2022 reveal a period of significant growth, primarily driven by a surge in the game business. For the three-month period ending December 31, 2021, net sales reached ¥171,090 million, a 30.6% increase year-on-year. Operating income saw a substantial rise of 180.6% to ¥19,804 million, while profit attributable to shareholders of the parent grew by 107.9% to ¥6,091 million. The game business was the primary catalyst for this performance, reporting a 94.7% increase in net sales to ¥58,329 million and a 1,405.7% increase in operating income to ¥17,130 million, largely due to a successful title launched in early 2021. The internet advertisement business also achieved record-high net sales of ¥87,831 million. Conversely, the media business, which includes ABEMA, reported an operating loss of ¥3,840 million as the company continues to invest in the platform for long-term growth. The investment development business experienced a decline, with operating income falling 57.5% year-on-year. Geographically focused on the Japanese market, the report notes a change in accounting policies following the adoption of the Accounting Standard for Revenue Recognition. This shift affects how in-game currency and item charges are recorded, though the immediate impact on profit and loss is described as minor. Despite the strong quarterly performance, CyberAgent has refrained from providing a full-year consolidated earnings forecast for fiscal 2022. This decision is attributed to the inherent volatility of the game business, where performance is highly dependent on the timing of new launches and the operational status of existing titles, making reasonable calculations difficult at this stage.
CyberAgentJan 2022
Financial
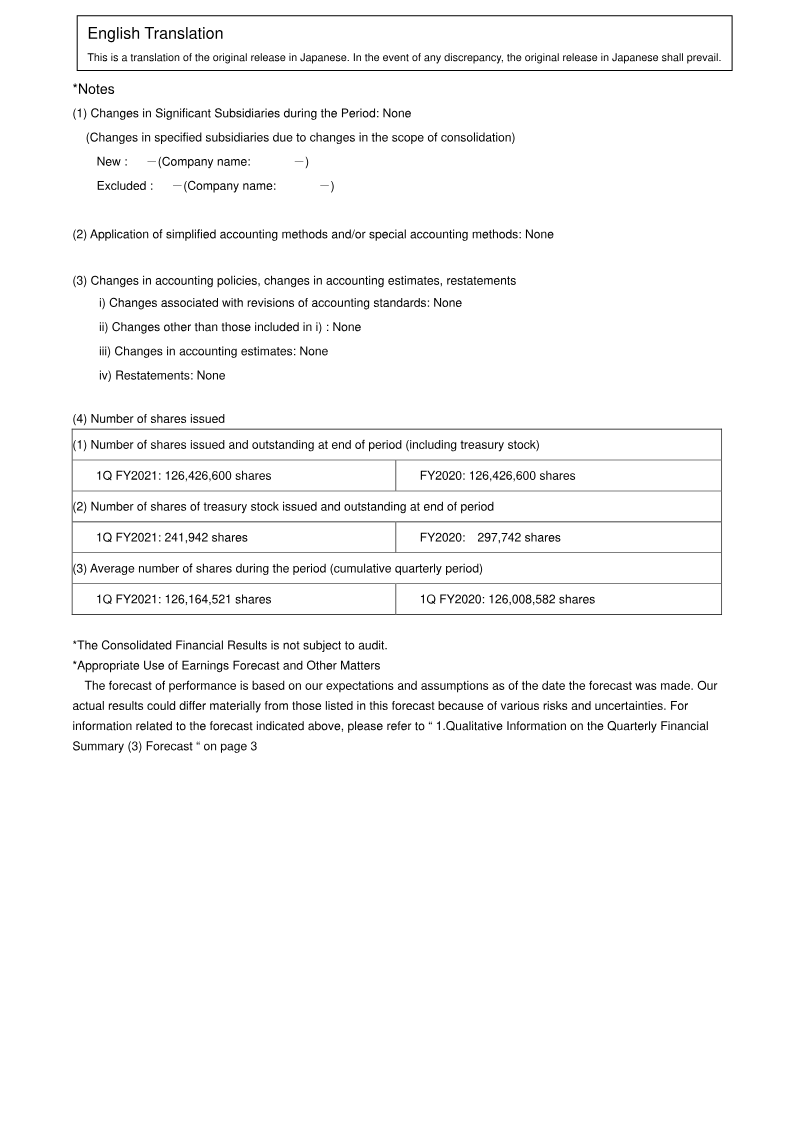
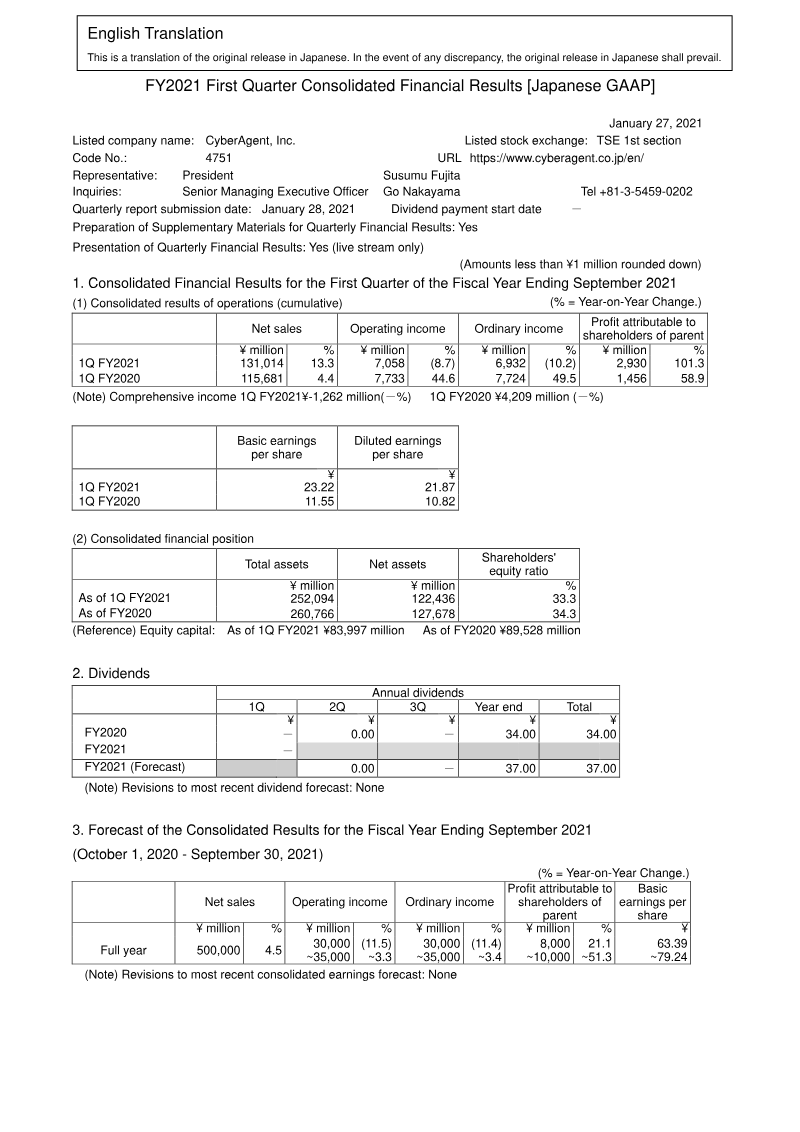
FY2021 First Quarter Consolidated Financial Results [Japanese GAAP]
CyberAgent’s consolidated financial results for the first quarter of the fiscal year ending September 2021 reveal a period of significant revenue growth alongside shifting profitability across its diverse business segments. Covering the period from October 1, 2020, to December 31, 2020, the data shows net sales increased by 13.3% year-on-year to ¥131,014 million. While operating income saw a moderate decline of 8.7% to ¥7,058 million, profit attributable to shareholders of the parent surged by 101.3% to ¥2,930 million. The Media Business, which includes the ABEMA streaming platform, reported a substantial 67% increase in net sales to ¥20,428 million. Although this segment remains in an investment phase, its operating loss narrowed from ¥5,050 million to ¥3,926 million. The Internet Advertisement Business achieved record-high net sales of ¥76,587 million, up 13.8%, maintaining its position as the primary revenue driver. Conversely, the Game Business experienced a downturn, with net sales falling 15% to ¥29,954 million and operating income dropping 77.8% to ¥1,137 million, attributed to seasonal factors affecting major existing titles. The Investment Development Business provided a significant boost, with operating income rising 74% to ¥4,636 million. The financial position remains stable despite a slight decrease in total assets to ¥252,094 million, primarily due to corporate tax and dividend payments. CyberAgent maintained its full-year forecast, projecting net sales of ¥500,000 million and operating income between ¥30,000 million and ¥35,000 million. These results, prepared under Japanese GAAP, reflect the company's strategic focus on scaling its media and advertising operations to offset fluctuations in the hit-driven gaming market during the ongoing global pandemic.
CyberAgentJan 2021
Financial
FY03/2026 1Q Consolidated Financial Results: Japan
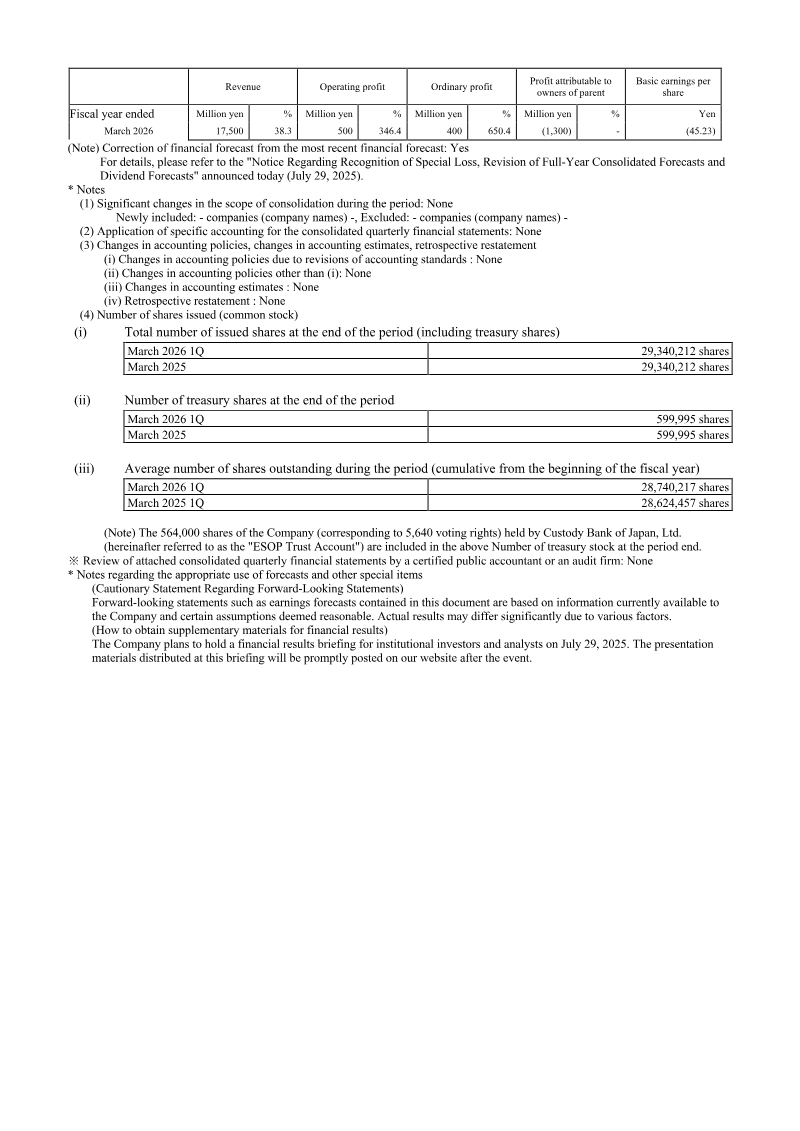
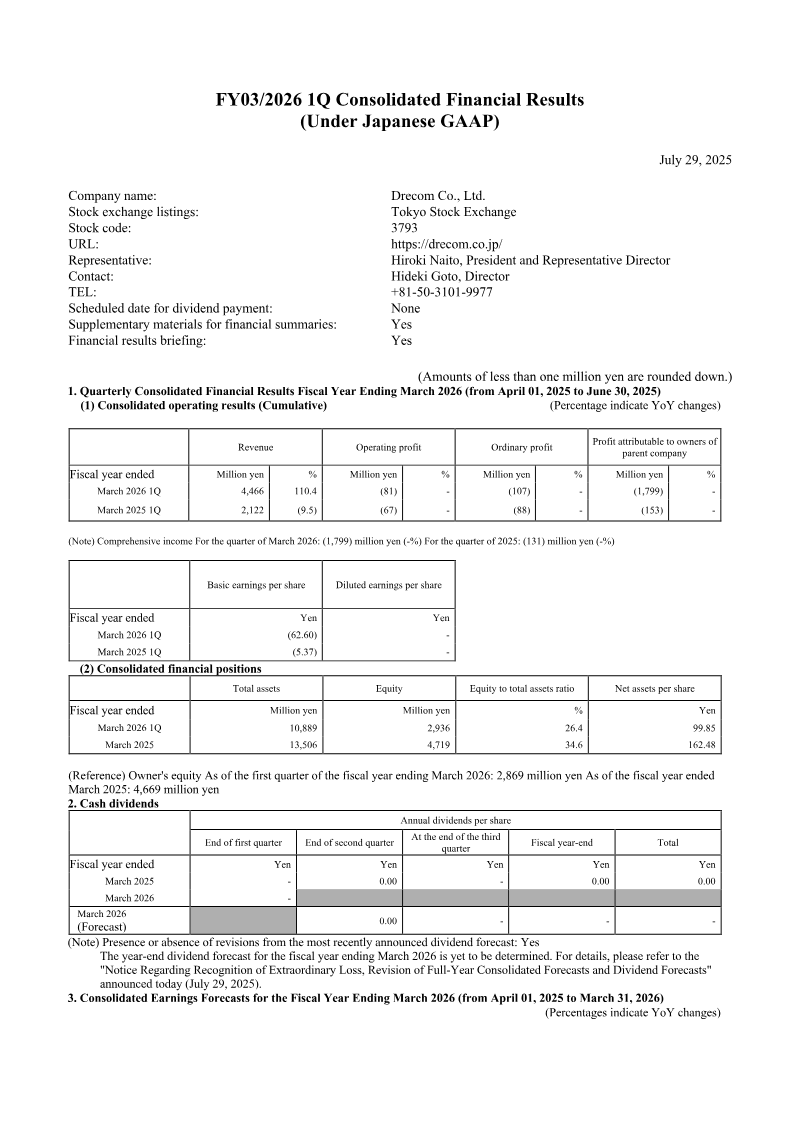
Drecom Co., Ltd. reported its consolidated financial results for the first quarter of the fiscal year ending March 2026, covering the period from April 1, 2025, to June 30, 2025. The company’s primary mission centers on global entertainment expansion through the integration of intellectual property and technology. The financial results reflect a period of significant revenue growth offset by substantial impairment losses, leading to a net loss for the quarter. Total revenue for the first quarter reached 4,466 million yen, representing a 110.4% increase compared to the same period in the previous year. This growth was largely driven by the performance of the mobile game title Wizardry Variants Daphne. Despite this revenue surge, the company recorded an operating loss of 81 million yen and an ordinary loss of 107 million yen. A major factor in the quarterly performance was an extraordinary impairment loss of 1,563 million yen, attributed to the reassessment of future earnings for a mobile game title released in the previous fiscal year that performed below expectations. Consequently, the quarterly net loss attributable to owners of the parent company totaled 1,799 million yen. The company operates across two primary segments: the Game Business and the Content Business. The Game Business generated 4,327 million yen in sales, though segment profit declined by 51.6% due to increased variable and fixed costs associated with new title releases. The Content Business, which focuses on publishing and merchandise, saw revenue rise to 155 million yen, with a reduced segment loss of 204 million yen as the company continues to invest in new business areas. Following these results, the company has revised its full-year consolidated earnings forecasts for the fiscal year ending March 2026.
Drecom Co.Jul 2025