FinancialCyberAgent
FY2025 First Half Consolidated Financial Results: Japan
10 pages~18 min full read
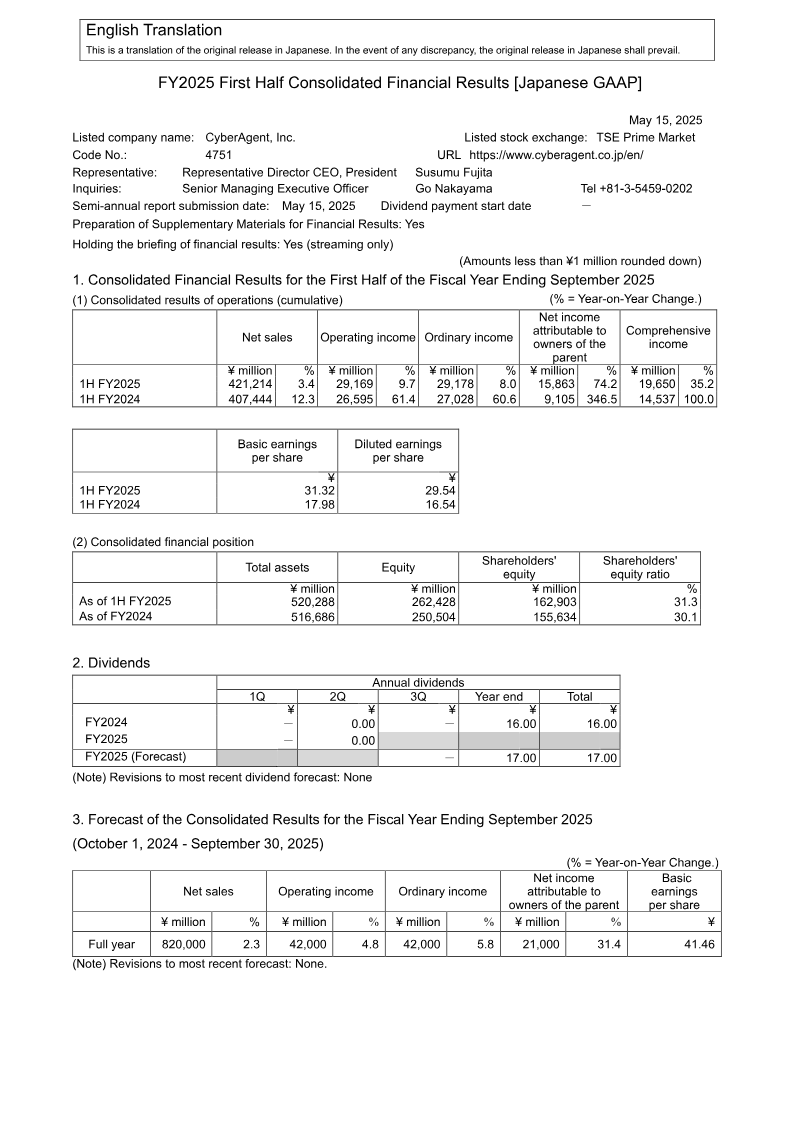
CyberAgent reported a 74.2% surge in net income attributable to the parent to ¥15,863 million for the first half of FY2025, alongside a 3.4% increase in net sales to ¥421,214 million.
See it on page 1The Media & IP Business segment achieved a significant turnaround, recording ¥112,721 million in sales (up 12.4% YoY) and shifting from an operating loss to a profit of ¥4,729 million.
See it on page 10The Internet Advertisement segment remains a primary growth driver, with sales rising 11.1% to ¥235,356 million and operating income increasing 11.6%.
See it on page 4The Game Business segment experienced a contraction, with sales falling 20.1% to ¥89,713 million and operating income declining 13.9%.
See it on page 4The company's financial position strengthened with an improved equity ratio of 31.3% and total assets reaching ¥520,288 million.
See it on page 4Cash and cash equivalents decreased by ¥10,734 million to ¥200,400 million, primarily due to the ¥20,000 million redemption of convertible bonds.
See it on page 4Full-year forecasts remain steady, with projected net sales of ¥820,000 million and an unchanged dividend forecast of ¥17 per share.
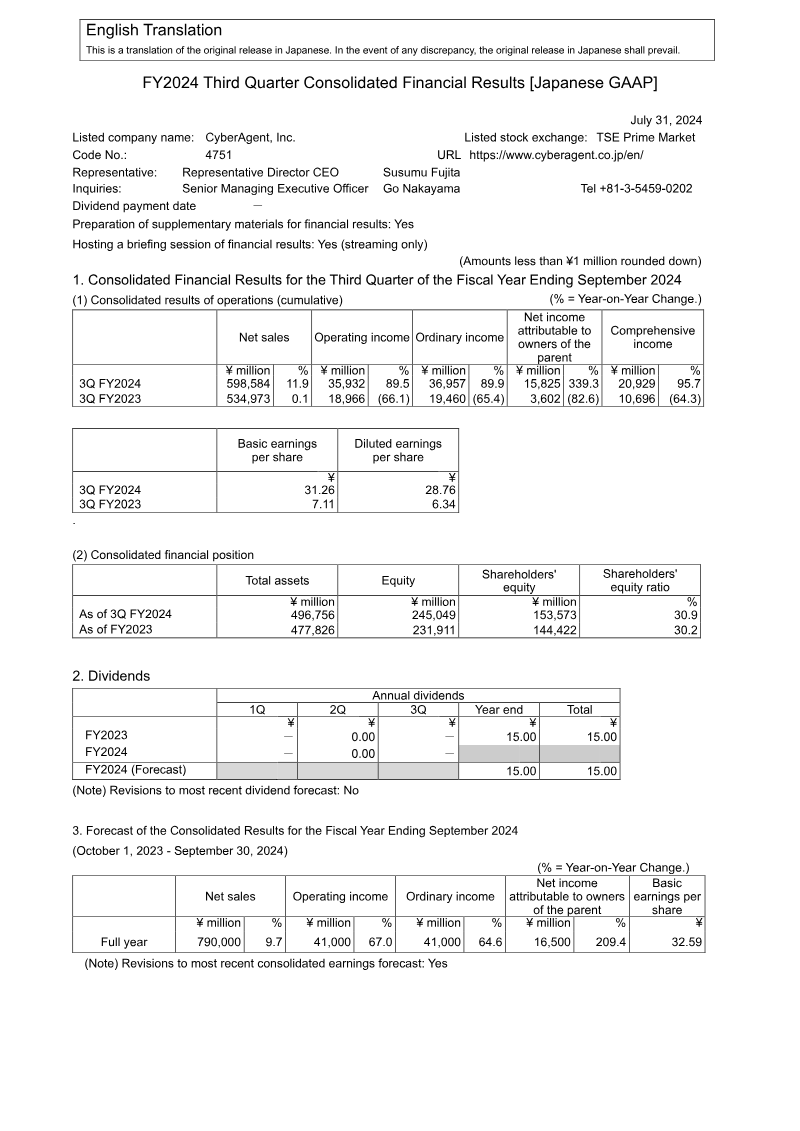
See it on page 1CyberAgent, Inc. reported first‑half FY2025 consolidated results under Japanese GAAP, showing a 3.4 % rise in net sales to ¥421,214 million and operating income up 9.7 % to ¥29,169 million. Ordinary income attributable to owners increased 8.0 % to ¥29,178 million, while net income attributable to the parent surged 74.2 % to ¥15,863 million, driven by a strong performance in the newly defined Media & IP Business and Internet Advertisement segments. The Media & IP segment recorded ¥112,721 million in sales (12.4 % YoY) and a shift from an operating loss to a profit of ¥4,729 million. Internet Advertisement sales rose 11.1 % to ¥235,356 million with operating income up 11.6 %. Game Business sales fell 20.1 % to ¥89,713 million, though operating income decreased only 13.9 %. Investment Development sales declined 28.6 % to ¥628 million, with an operating loss of ¥749 million.
Total assets increased to ¥520,288 million, equity rose to ¥262,428 million, and the equity ratio improved to 31.3 %. Cash and cash equivalents fell by ¥10,734 million to ¥200,400 million, largely due to operating cash inflows offset by investing and financing outflows, including a ¥20,000 million redemption of convertible bonds. Net income for the full year is forecast at ¥820,000 million, up 2.3 % YoY, with operating income projected at ¥42,000 million (4.8 %) and ordinary income at ¥42,000 million (5.8 %). The company maintains its dividend policy with a forecast of ¥17 million per share for FY2025, unchanged from prior guidance.