Updated Mar 17, 2026 by GREE
What can I help with?
AI-powered answers with citations from the library.
What can I help with?
AI-powered answers with citations from the library.
Financial · April 26, 2019
Published by GREE
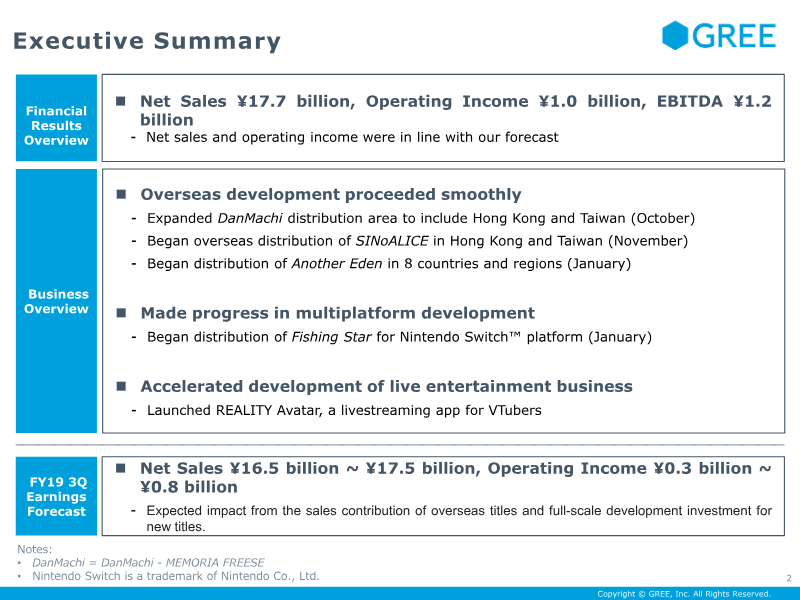
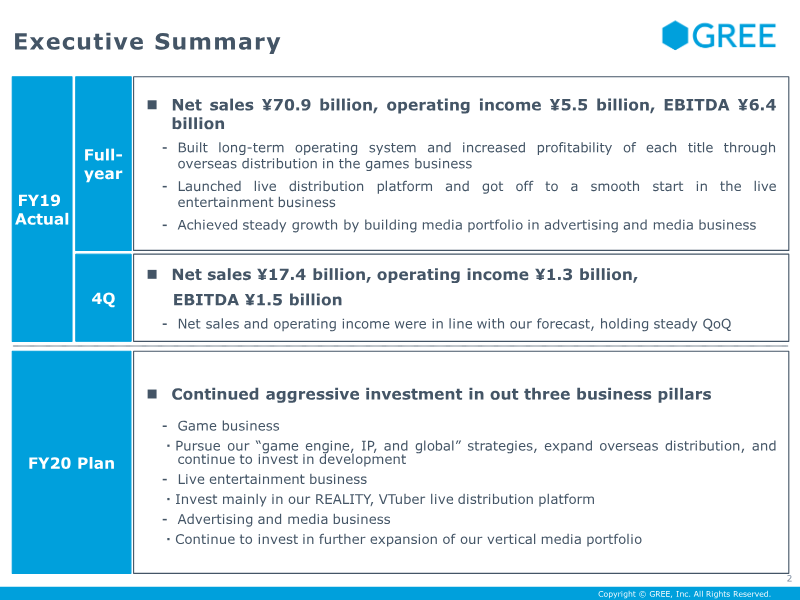
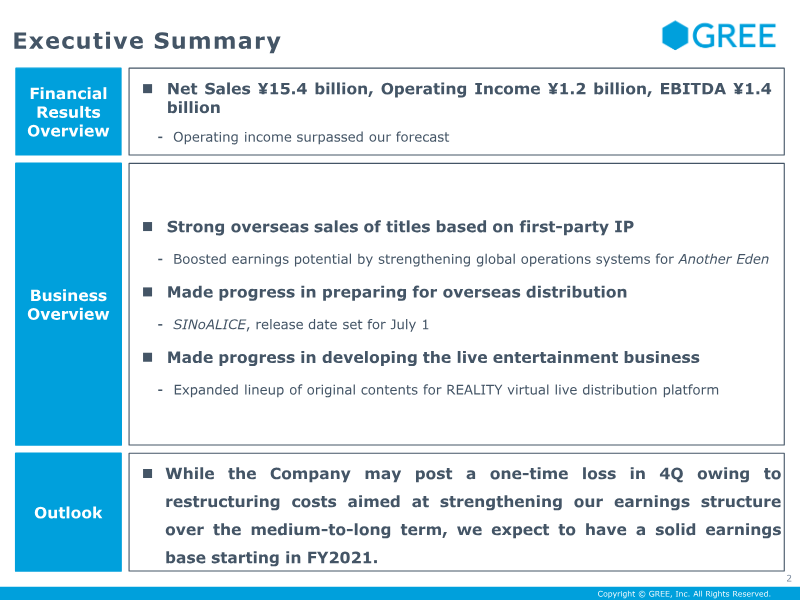
GREE’s financial results for the third quarter of fiscal year 2019 reflect a period of strategic transition, characterized by a shift toward overseas self-distribution and improved operational efficiency. The company reported net sales of ¥17.6 billion and an operating income of ¥1.6 billion, which surpassed internal forecasts. While overall net sales saw a slight year-over-year decline, operating income grew significantly compared to the previous quarter. This profitability was driven by a reduction in fixed costs, specifically through the streamlining of outsourcing and operational expenses, which offset a decline in legacy web-based games. The geographic scope of the results highlights a successful push into international markets. The self-distribution of first-party intellectual property, notably Another Eden, saw a strong start in eight countries and regions. Additionally, global simultaneous collaboration events for DanMachi contributed to increased daily active users and revenue. The company’s mobile game segment remains the primary revenue driver, accounting for ¥13.65 billion of total sales, while the advertising and media segment contributed ¥3.99 billion. Looking ahead to the fourth quarter of FY2019, the company forecasts net sales between ¥17.0 billion and ¥18.0 billion. This outlook is supported by a development pipeline of five mobile titles and the planned launch of AFTERLOST in the Shoumetsu Toshi series. Beyond gaming, the company is expanding its live entertainment ecosystem through the REALITY VTuber app and strengthening its media potential via its LIMIA and ARINE platforms. As of March 31, 2019, the company maintains a strong balance sheet with ¥86.3 billion in cash and equivalents and a consolidated headcount of 1,693 employees.
Executive Summary Financial & Net Sales ¥17 .6 billion, Operating Income ¥1. 6 billion, EBITDA ¥1. 8 Results billion Overview ⁃ Net sales were in line with our forecast and operating income surpassed our forecast & Overseas distribution proceeded smoothly ⁃ Overseas self-distribution of first-party IP for Another Eden off to a strong start ⁃ Collaboration on DanMachi simultaneously held globally was smooth and successful Business & Made progress on development of titles based on first-party IP Overview ⁃ Began pre-registration for AFTERLOST, the latest title in the Shoumetsu Toshi series & Made progress on development of live entertainment business ⁃ Expanded lineup of original programs on our REALITY VTuber viewing app & Net Sales ¥17 .0 billion ~ ¥18 .0 billion, Operating Income ¥1. 0 billion ~ FY19 4Q ¥1. 5 billion Earnings Forecast ⁃ Expected impact from anniversary events for mainstay titles, overseas distribution, and new titles Notes:
1. Financial Results Overview (Consolidated) FY19 3Q Financial Results Overview Net Sales ¥17.6 billion, Operating Income ¥1.6 billion and EBITDA ¥1.8 billion Billions of yen FY19 FY19 FY19 3Q QoQ YoY 2Q 3Q Net sales 17.64 -0.09 -0.23 17.73 17.87 Operating income 1.55 0.59 -1.23 0.97 2.78 Ordinary income 1.45 0.66 -1.24 0.79 2.69 Net income 1.21 1.06 -0.68 0.15 1.89 EBITDA 1.80 0.60 -1.35 1.20 3.15 Notes: • Due to one-off events occurring in 3Q, the Company posted net sales of ¥390 million and operating income of ¥460 million in 3Q. Without impact from these factors, 3Q net sales were ¥17.25 billion and operating income was ¥1.09 billion. • Certain variable cost transactions conducted in 2Q FY19 and earlier have been revised, resulting in the posting of ¥160 million in costs in 2Q. Without the revision, 2Q operating income is ¥1.13 billion. • Breakdown of FY19 3Q net sales: Paid service sales ¥13.65 billion; Other sales (ad, CS, license, VR, etc.) ¥3.99 billion
1. Financial Results Overview (Consolidated) Net Sales, Operating Income, and EBITDA Strong earnings on contribution from overseas distribution and improved cost efficiency on operation of existing titles Billions of yen 22.0 25.0% 17.9 19.0 18.2 17.7 17.6 15.6% 11.0 8.5% 8.9% 8.8% 12.5% 5.4% 2.8 3.2 1.6 1.9 1.6 1.9 1.0 1.2 1.6 1.8 0.0 0.0% 3Q 4Q 1Q 2Q 3Q FY18 FY19 Net Sales Operating income EBITDA Operating Income margin Notes: • Due to one-off events occurring in 3Q, the Company posted net sales of ¥390 million and operating income of ¥460 million in 3Q. Without impact from these factors, 3Q net sales were ¥17.25 billion and operating income was ¥1.09 billion. • Certain variable cost transactions conducted in 2Q FY19 and earlier have been revised, resulting in the posting of ¥160 million in costs in 2Q. Without the revision, 2Q operating income is ¥1.13 billion.
1. Financial Results Overview (Consolidated) Operating Income Analysis A decline in web games was offset by growth in mobile games Fixed costs improved considerably owing to the streamlining of operations Billions of yen ¥0.59<sub>bn</sub> increase +0.66 1.55 0.97 -0.09 +0.02 Operating Decrease in Decrease in Decrease in Operating Income net sales variable costs fixed costs Income FY19 2Q FY19 3Q Notes: • Due to one-off events occurring in 3Q, the Company posted net sales of ¥390 million and operating income of ¥460 million in 3Q. Without impact from these factors, 3Q net sales were ¥17.25 billion and operating income was ¥1.09 billion. • Certain variable cost transactions conducted in 2Q FY19 and earlier have been revised, resulting in the posting of ¥160 million in costs in 2Q. Without the revision, 2Q operating income is ¥1.13 billion.
1. Financial Results Overview (Consolidated) FY19 3Q Cost Structure Total costs down ¥700 million QoQ, to ¥16.1 billion Billions of yen FY19 Factors in change(QoQ) FY19 FY18 3Q QoQ YoY 2Q 3Q Advertising 1.12 0.23 0.29 Increase from overseas development (FY19 2Q 5.0% → FY19 0.89 0.83 3Q 6.3%) Commission 5.18 -0.27 -0.30 Decrease due to sales decline 5.46 5.48 Fees Other 0.95 0.03 0.35 - 0.92 0.60 Total 7.25 -0.02 0.34 7.27 6.91 variable costs Labor costs 3.54 0.20 0.55 Increase in consolidated headcount, provision for bonuses 3.34 2.99 Rental costs 0.63 -0.07 -0.02 - 0.70 0.65
7.27 6.91 variable costs Labor costs 3.54 0.20 0.55 Increase in consolidated headcount, provision for bonuses 3.34 2.99 Rental costs 0.63 -0.07 -0.02 - 0.70 0.65 Depreciation 0.18 0.01 0.01 - 0.17 0.16 Goodwill 0.07 -0.00 -0.14 - 0.07 0.21 amortization Other 4.41 -0.80 0.24 Reduced outsourcing costs in the operation business 5.22 4.17 Total fixed 8.83 -0.66 0.65 9.50 8.18 costs Total costs 16.09 -0.68 0.99 16.76 15.09 Note: