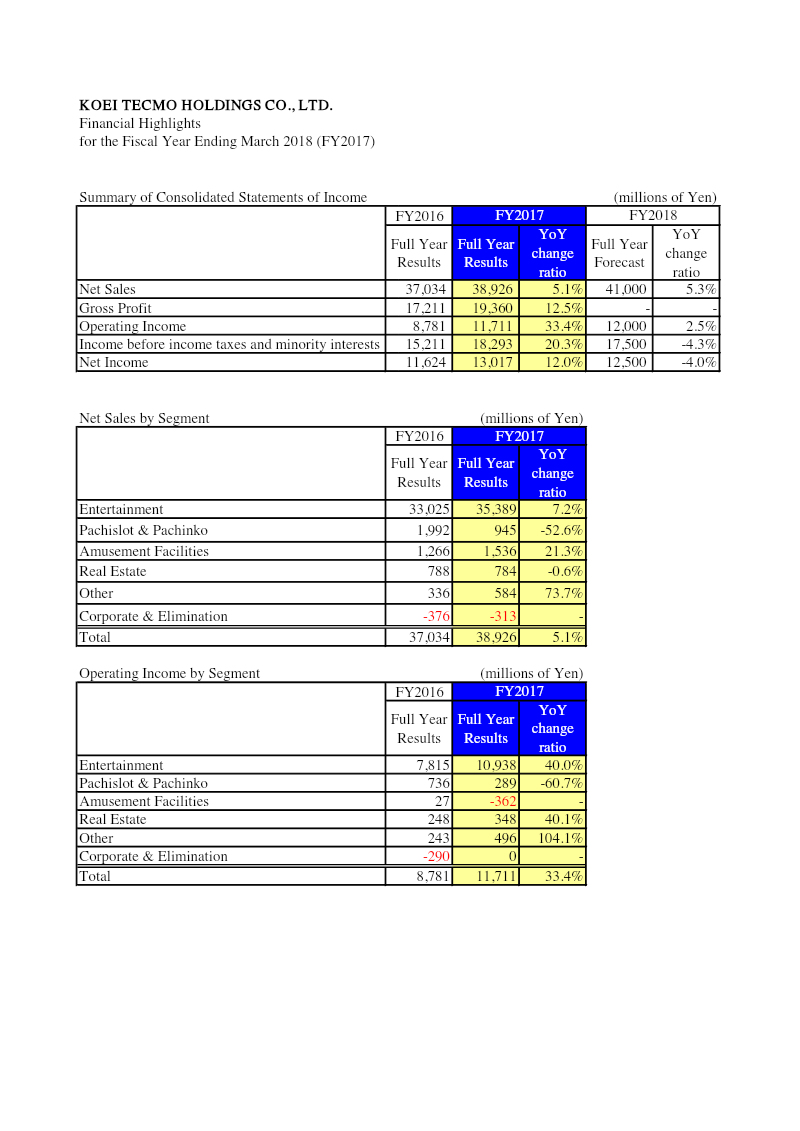
Net sales for FY2017 rose 5.1% to ¥38,926 million, while operating income saw a significant 33.4% increase to ¥11,711 million.
See it on page 1The entertainment segment drove growth with a 7.2% rise in sales and a 40% increase in operating income, while the pachislot & pachinko division suffered a 52.6% decline in sales.
See it on page 1Net income grew 12.0% to ¥13,017 million, though the company projects a 4.0% decline for the upcoming FY2018.
See it on page 1Total assets increased to ¥129,367 million, primarily fueled by a rise in investment securities from ¥65,484 million to ¥78,938 million.
See it on page 2Liquidity decreased as current assets fell 26%, with cash and deposits dropping from ¥11,868 million to ¥6,626 million.
See it on page 2Shareholders’ equity strengthened to ¥113,178 million, supported by gains in retained earnings and capital surplus.
See it on page 2Financial highlights for the fiscal year ending March 2018 (FY2017) show a 5.1 % increase in net sales to ¥38,926 million, driven largely by a 7.2 % rise in the entertainment segment and a 73.7 % jump in other activities, while pachislot & pachinko sales fell 52.6 %. Operating income grew 33.4 % to ¥11,711 million, with entertainment contributing a 40 % rise and other activities doubling. Gross profit expanded 12.5 % to ¥19,360 million, and net income rose 12.0 % to ¥13,017 million, though the company forecast a slight decline of 4.0 % for FY2018.
Total assets increased from ¥119,461 million to ¥129,367 million, largely due to higher investment securities (¥65,484 → ¥78,938 million) and fixed‑asset growth. Current assets fell 26 % as cash and deposits dropped from ¥11,868 million to ¥6,626 million. Liabilities rose modestly, with long‑term liabilities increasing from ¥1,484 million to ¥2,096 million. Shareholders’ equity grew from ¥105,639 million to ¥113,178 million, supported by retained earnings and capital surplus gains.
The company’s geographic focus remains Japan‑centric, with revenue streams from entertainment venues, pachislot & pachinko operations, amusement facilities, real estate, and ancillary services. The financial data derive from consolidated statements covering the fiscal year ending March 2018, with comparative figures for FY2016 and FY2017. Methodological details are limited to standard accounting disclosures; no survey or external data sources are cited.