ReportKoei Tecmo
Financial Highlights: 3rd Quarter of the Fiscal Year Ending March 2017
2 pages~3 min full read
Key insights
7 takeaways · ~3 min read- 01
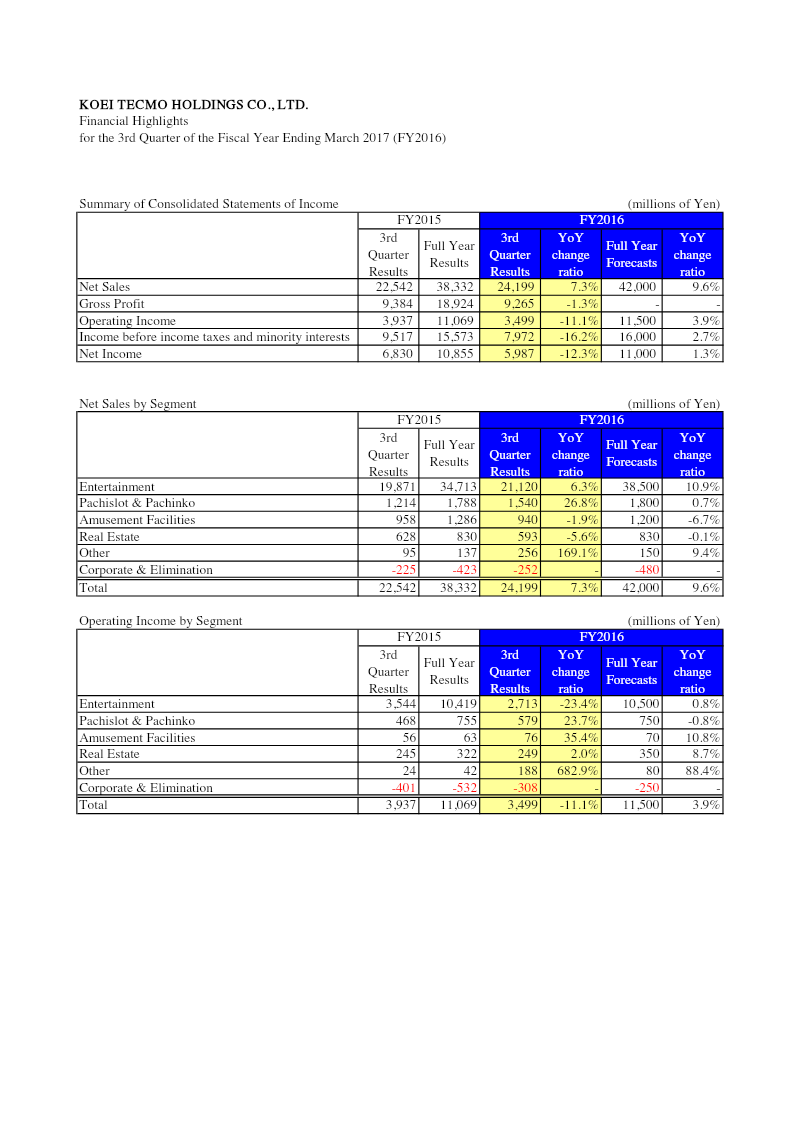
KOEI TECMO Holdings reported a significant revenue increase to ¥38.3 billion for the third quarter of fiscal 2016, up from ¥22.5 billion in the same period of the previous year.
See it on page 1 - 02
Operating income rose 11.1% to ¥11.1 billion, while net income grew 12.3% to ¥10.9 billion, tracking closely toward the company's full-year forecast of ¥11 billion.
See it on page 1 - 03
The entertainment segment remains the primary driver of financial performance, generating ¥34.7 billion in sales and contributing ¥10.4 billion to the total operating income.
See it on page 1 - 04
Pachislot and pachinko revenue experienced a notable 26.8% year-over-year increase, reaching ¥1.79 billion.
See it on page 1 - 05
The company improved its liquidity position as current liabilities dropped to ¥5.1 billion, while shareholders’ equity increased to ¥99.7 billion.
See it on page 2 - 06
Amusement facilities and real-estate segments saw minor declines of 1.9% and 5.6% respectively, while the 'Other' segment grew by 169% to ¥137 million.
See it on page 1 - 07
Total assets contracted slightly from ¥110.9 billion to ¥108.5 billion, despite an increase in cash and marketable securities.
See it on page 2