FinancialKoei Tecmo
Financial Highlights for the 3rd Quarter of the Fiscal Year Ending March 2014 (FY2013)
1 Jan 20142 pages~4 min full read
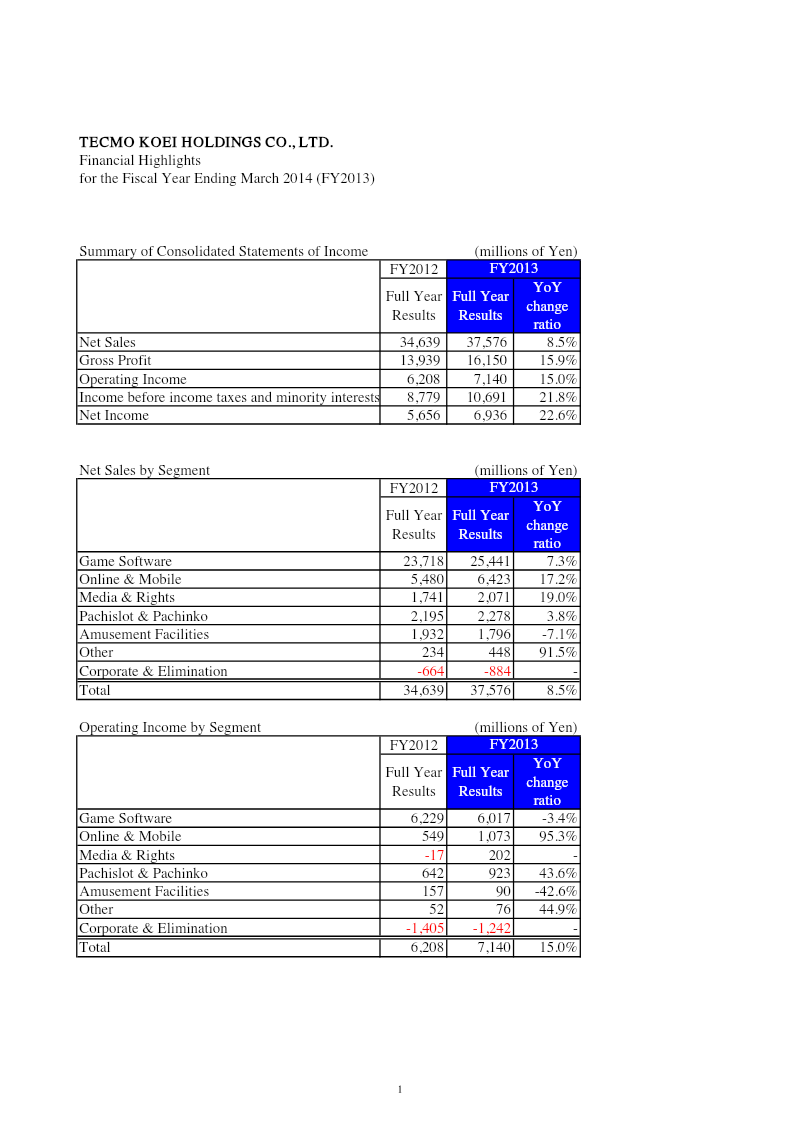
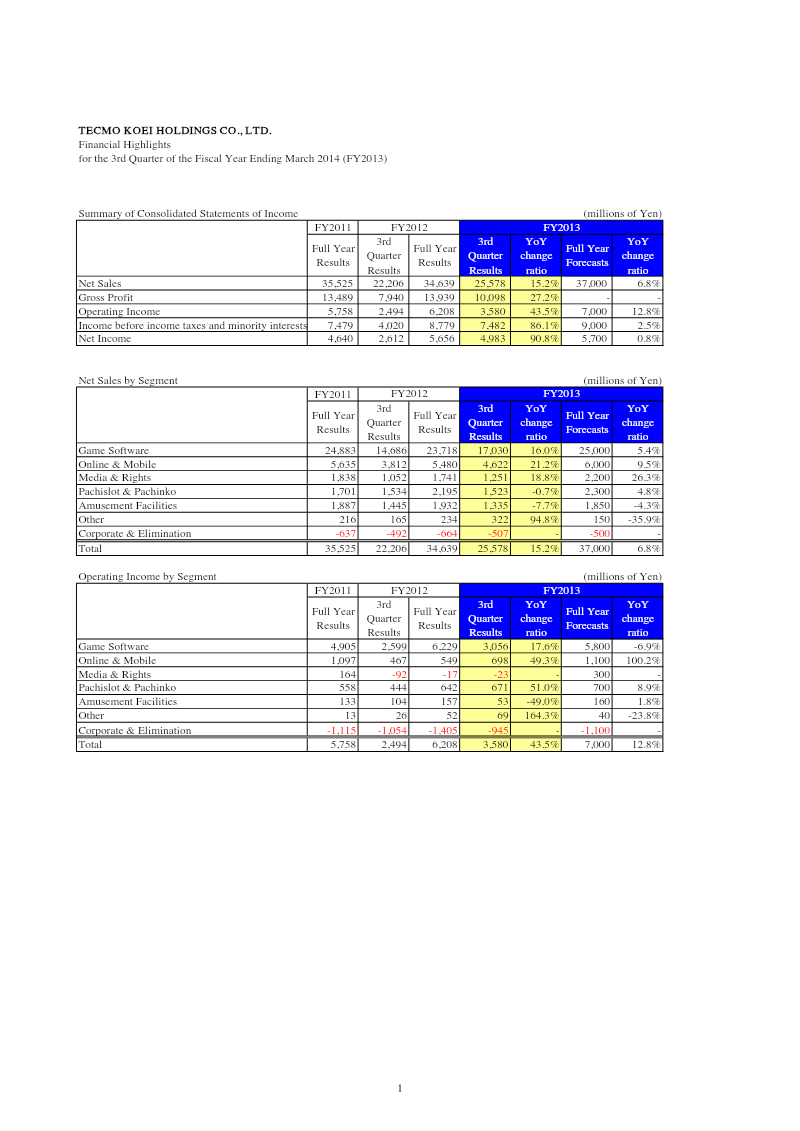
Tecmo Koei Holdings achieved strong growth in the first nine months of FY2013, with net sales rising 15.2% to 25.58 billion yen and net income nearly doubling by 90.8% to 4.98 billion yen.
Operating income for the period grew by 43.5% to 3.58 billion yen, reflecting improved operational efficiency and a successful product mix.
The Game Software segment remains the primary revenue driver with 17.03 billion yen in sales, while the Online & Mobile segment demonstrated the highest profit momentum with a 49.3% increase in operating income to 698 million yen.
The company shifted its asset strategy by increasing investment securities from 45.34 billion yen to 56.26 billion yen while reducing cash and time deposits.
Management projects a positive full-year outlook with forecasted annual sales of 37 billion yen and net income of 5.7 billion yen.
Total net assets reached 86.88 billion yen by December 2013, bolstered by unrealized gains on securities and favorable foreign currency translation adjustments.
While most divisions saw gains, the Amusement Facilities segment underperformed, experiencing declines in both sales and operating income.
Tecmo Koei Holdings reported significant financial growth for the third quarter of the fiscal year ending March 2014, demonstrating a strong upward trend in profitability and revenue compared to the same period in the previous year. Net sales for the nine-month period reached 25.58 billion yen, a 15.2% increase year-over-year. This growth was accompanied by a substantial rise in earnings, with operating income climbing 43.5% to 3.58 billion yen and net income nearly doubling with a 90.8% increase to 4.98 billion yen. These results indicate high operational efficiency and a successful product mix during the reporting period.
The Game Software segment remained the primary driver of revenue, contributing 17.03 billion yen in sales, a 16% increase. However, the Online & Mobile segment showed the most significant momentum in profitability, with operating income rising 49.3% to 698 million yen. Other segments, such as Media & Rights and Pachislot & Pachinko, also saw revenue gains, while the Amusement Facilities division experienced a decline in both sales and operating income. The company’s balance sheet reflects a strategic shift in asset allocation, characterized by a decrease in cash and time deposits and a notable increase in investment securities, which rose from 45.34 billion yen to 56.26 billion yen.
Geographically focused on the Japanese market with broader international implications, the data suggests a positive outlook for the full fiscal year. Management forecasted total annual sales of 37 billion yen and a net income of 5.7 billion yen. The financial position remains robust, with total net assets increasing to 86.88 billion yen by the end of December 2013. This stability is supported by a significant rise in accumulated other comprehensive income, driven largely by unrealized gains on securities and favorable foreign currency translation adjustments.