FinancialKLab
Summary of Financial Results for Fiscal Year Ending December 31, 2015: Japan
21 pages~30 min full read
Key insights
5 takeaways · ~2 min read- 01
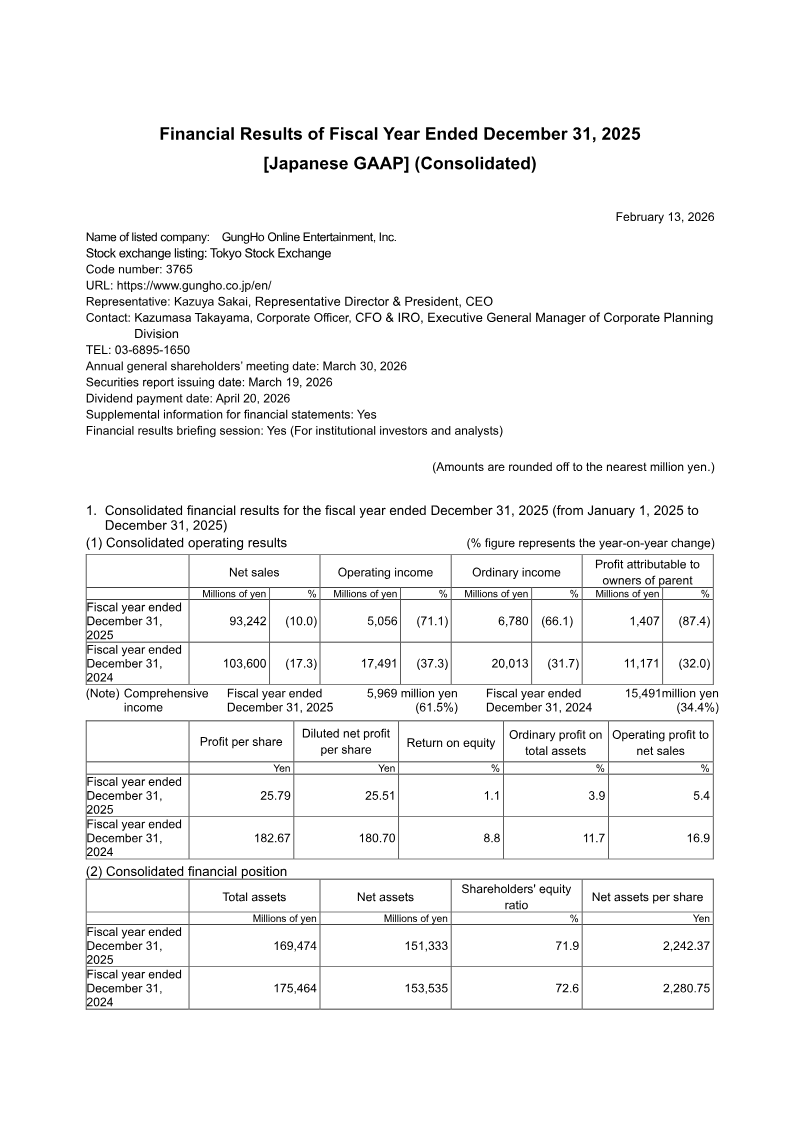
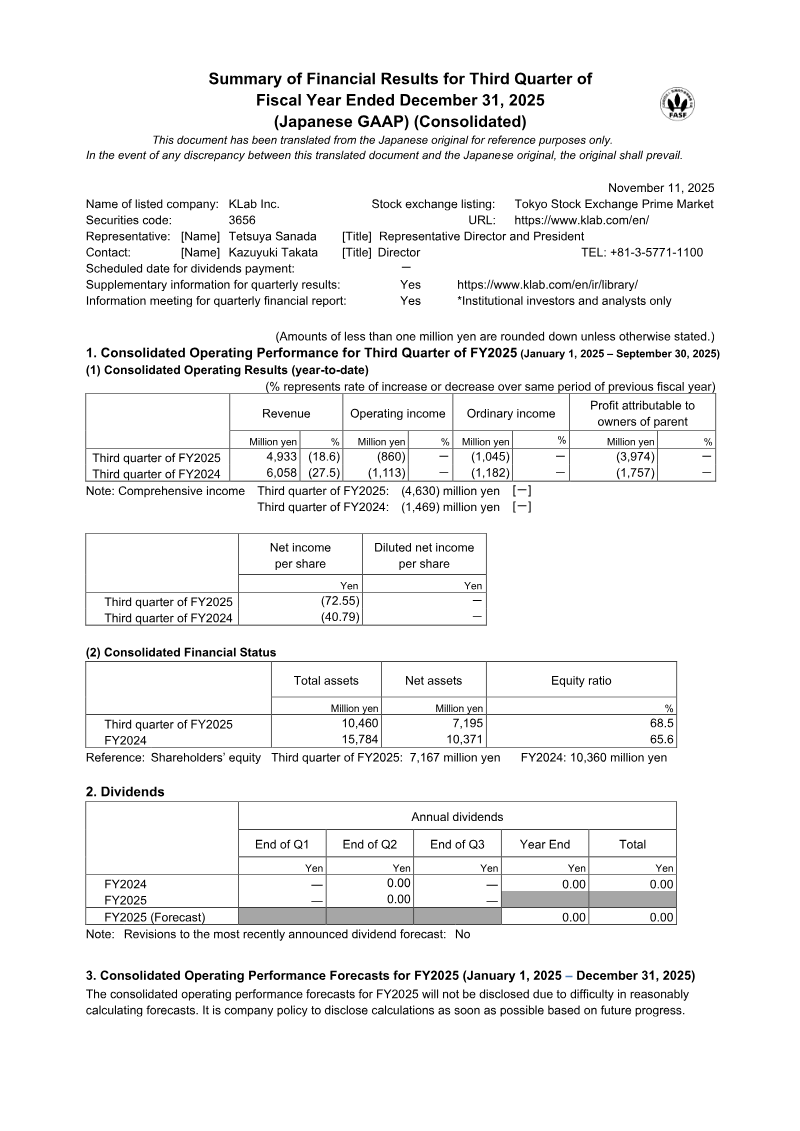
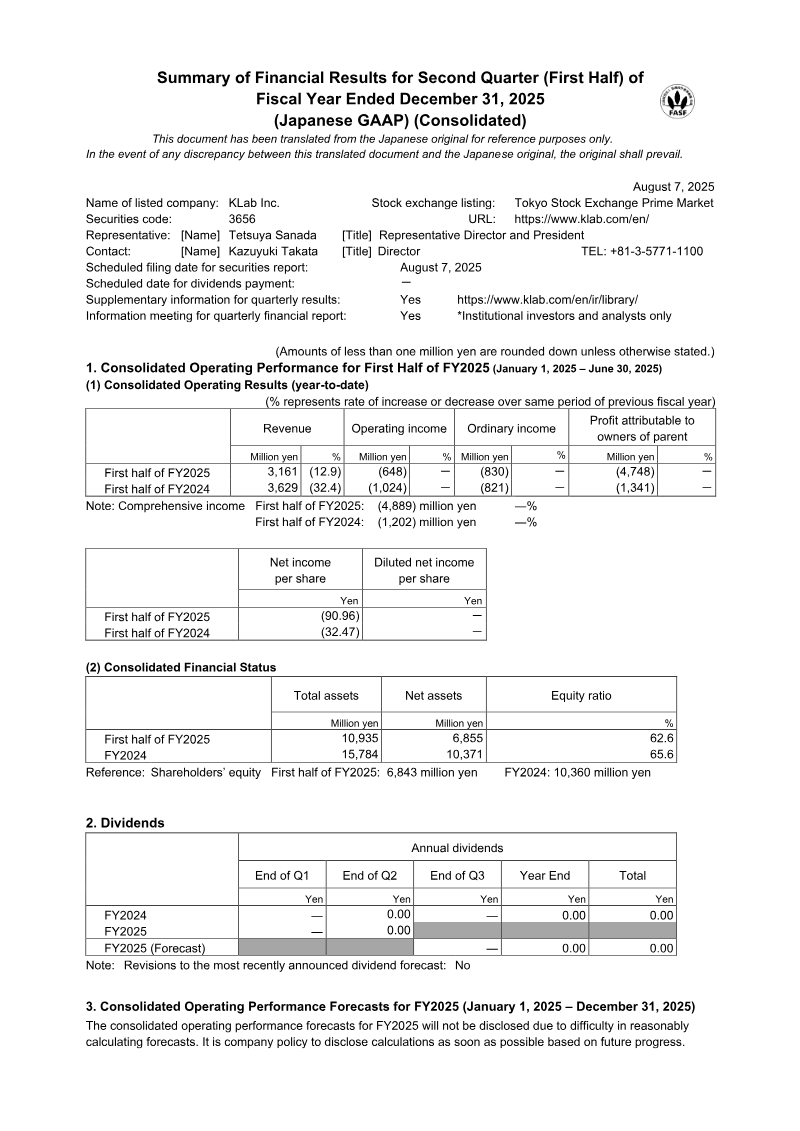
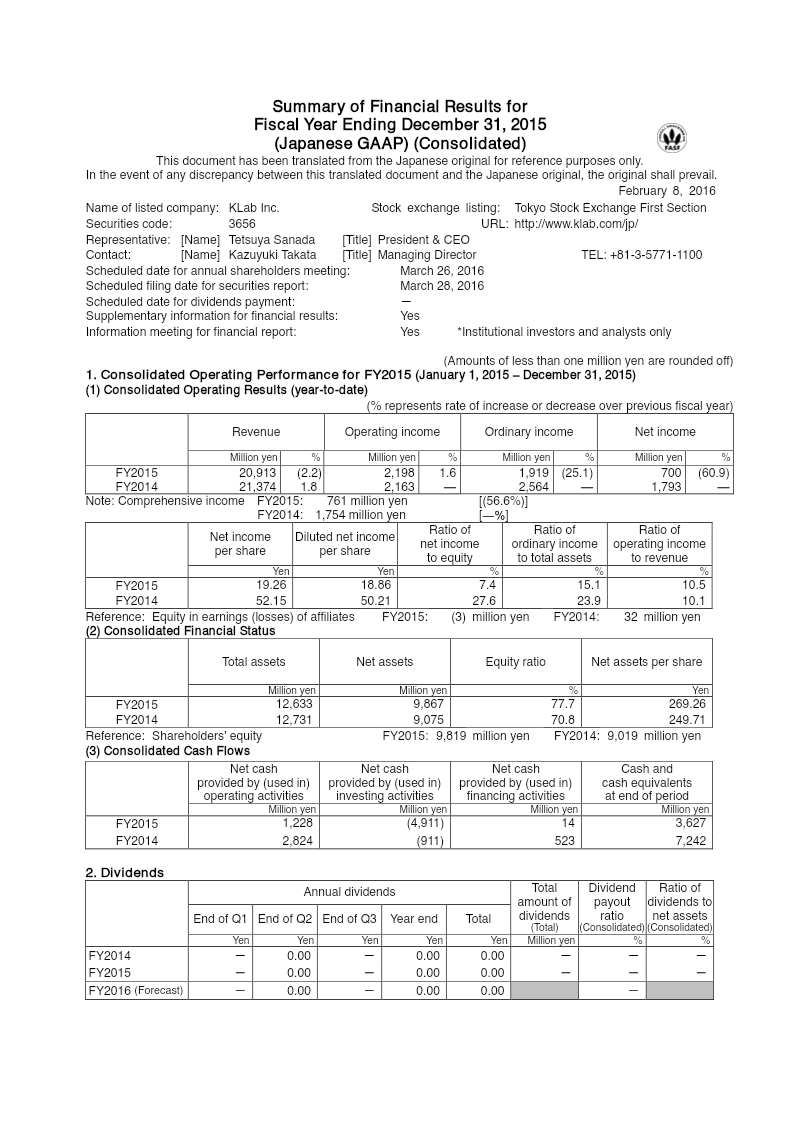
KLab Inc. released its consolidated financial results for the fiscal year ending December 31, 2015, prepared in accordance with Japanese GAAP.
See it on page 1 - 02
The provided document serves as a reference translation of the original Japanese financial report for the 2015 fiscal period.
See it on page 1 - 03
The report confirms KLab Inc. as the specific listed company subject to these financial disclosures.
See it on page 1 - 04
The financial reporting covers the full fiscal year concluding on December 31, 2015.
See it on page 1 - 05
The document establishes that in the event of any discrepancies between the translated version and the Japanese original, the Japanese original text takes precedence.
See it on page 4