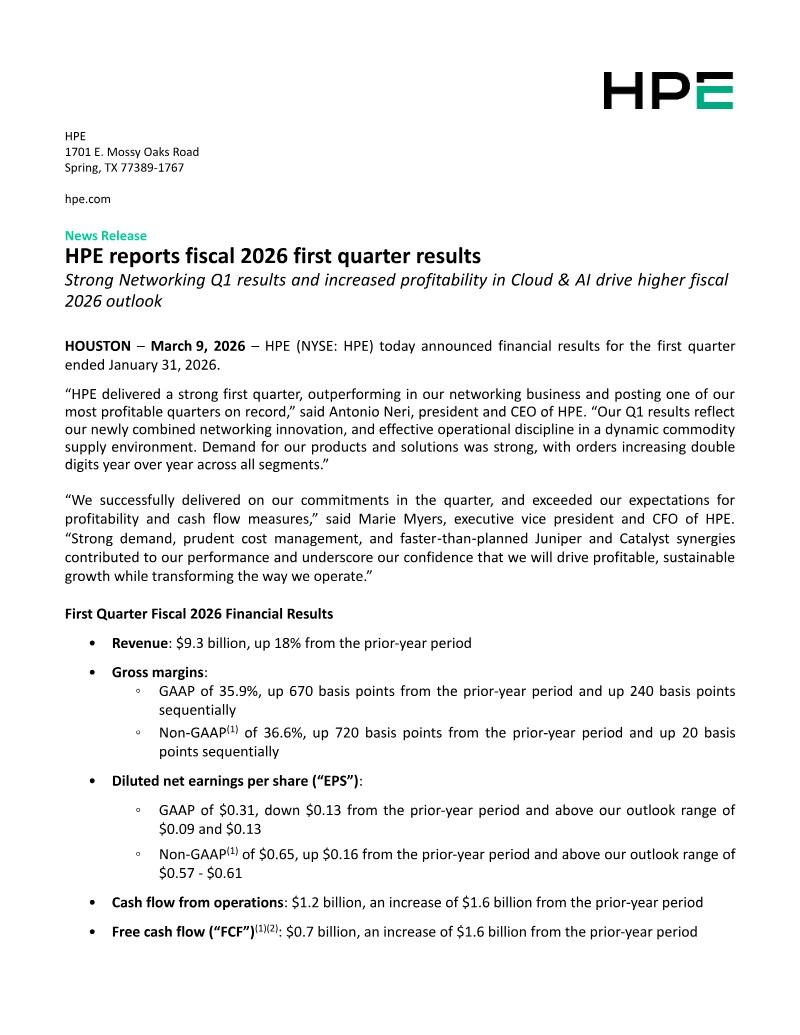
Updated Mar 21, 2026 by Hewlett Packard Enterprise
Report
Published by Hewlett Packard Enterprise
HPE reports fiscal 2026 first quarter results Strong Networking Q1 results and increased profitability in Cloud & AI drive higher fiscal HOUSTON – March 9, 2026 – HPE (NYSE: HPE) today announced financial results for the first quarter “HPE delivered a strong first quarter, outperforming in our networking business and posting one of our most profitable quarters on record,” said Antonio Neri, president and CEO of HPE.
HPE 1701 E. Mossy Oaks Road Spring, TX 77389-1767 hpe.com News Release HPE reports fiscal 2026 first quarter results Strong Networking Q1 results and increased profitability in Cloud & AI drive higher fiscal 2026 outlook HOUSTON – March 9, 2026 – HPE (NYSE: HPE) today announced financial results for the first quarter ended January 31, 2026. “HPE delivered a strong first quarter, outperforming in our networking business and posting one of our most profitable quarters on record,” said Antonio Neri, president and CEO of HPE. “Our Q1 results reflect our newly combined networking innovation, and effective operational discipline in a dynamic commodity supply environment. Demand for our products and solutions was strong, with orders increasing double digits year over year across all segments.” “We successfully delivered on our commitments in the quarter, and exceeded our expectations for profitability and cash flow measures,” said Marie Myers, executive vice president and CFO of HPE. “Strong demand, prudent cost management, and faster‑than‑planned Juniper and Catalyst synergies contributed to our performance and underscore our confidence that we will drive profitable, sustainable growth while transforming the way we operate.”
rie Myers, executive vice president and CFO of HPE. “Strong demand, prudent cost management, and faster‑than‑planned Juniper and Catalyst synergies contributed to our performance and underscore our confidence that we will drive profitable, sustainable growth while transforming the way we operate.” First Quarter Fiscal 2026 Financial Results • Revenue: $9.3 billion, up 18% from the prior-year period • Gross margins: ◦ GAAP of 35.9%, up 670 basis points from the prior-year period and up 240 basis points sequentially ◦ Non-GAAP<sup>(1)</sup> of 36.6%, up 720 basis points from the prior-year period and up 20 basis points sequentially • Diluted net earnings per share (“EPS”): ◦ GAAP of 0.31, down 0.13 from the prior-year period and above our outlook range of 0.09 and 0.13 ◦ Non-GAAP<sup>(1)</sup> of 0.65, up 0.16 from the prior-year period and above our outlook range of 0.57 - 0.61 • Cash flow from operations: 1.2 billion, an increase of 1.6 billion from the prior-year period • Free cash flow (“FCF”)<sup>(1)(2)</sup>: 0.7 billion, an increase of 1.6 billion from the prior-year period
• Capital returns to common shareholders: $348 million in the form of dividends and share repurchases First Quarter Fiscal 2026 Segment Results • Networking revenue was $2.7 billion, up 151.5% from the prior-year period, with 23.7% operating profit margin, compared to 29.7% from the prior-year period. This segment incorporates our former Intelligent Edge segment and Juniper Networks. ◦ Within Networking, revenue from: ▪ Campus & Branch was $1.2 billion, up 42.0% from the prior-year period. ▪ Data Center Networking was $444 million, up 382.6% from the prior-year period. ▪ Security was $255 million, up 114.3% from the prior-year period. ▪ Routing was 780 million, compared to 1 million in the prior-year period. • Cloud & AI revenue was $6.3 billion, down 2.7% from the prior-year period, with 10.2% operating profit margin, compared to 8.4% from the prior-year period. This segment consolidates HPE’s server, storage, and financial services businesses, representing a new financial segment for FY26. ◦ Within Cloud & AI, revenue from: ▪ Server was $4.2 billion, down 2.7% from the prior-year period. ▪ Storage was $1.1 billion, up 0.6% from the prior-year period. ▪ Financial Services was $0.9 billion, up 0.3% from the prior-year period. • Corporate Investments and Other revenue was $261 million, down 2.2% from the prior-year period, with -4.6% of operating profit margin, compared to -3.0% from the prior-year period.
lion, up 0.6% from the prior-year period. ▪ Financial Services was $0.9 billion, up 0.3% from the prior-year period. • Corporate Investments and Other revenue was $261 million, down 2.2% from the prior-year period, with -4.6% of operating profit margin, compared to -3.0% from the prior-year period. This segment includes the Advisory and Professional Services business and Hewlett Packard Labs; the Telco and Instant On businesses have been incorporated into this segment, a change for FY26. Dividend The HPE Board of Directors declared a regular cash dividend of $0.1425 per share on the company’s common stock, payable on or about April 23, 2026, to stockholders of record as of the close of business on March 24, 2026. Fiscal 2026 Second Quarter Outlook HPE estimates revenue to be in the range of 9.6 billion to 10.0 billion. HPE estimates GAAP diluted net EPS to be in the range of 0.09 to 0.13 and non-GAAP diluted net EPS<sup>(1)</sup> to be in the range of $0.51 to $0.55. Fiscal 2026 second quarter non-GAAP diluted net EPS estimate excludes net after-tax adjustments of approximately $0.42 per diluted share, primarily related to amortization of intangible assets, stockbased compensation expense, acquisition, disposition and other charges, and cost reduction program. Fiscal 2026 Full Year Outlook HPE is reaffirming its FY26 revenue growth outlook range of 17% to 22%, as previously provided at our Securities Analyst Meeting. HPE is raising revenue growth expectations for the Networking segment to 68% to 73%. HPE estimates GAAP operating profit growth to be 490% to 550% and non-GAAP operating profit growth between 32% to 40%<sup>(1)(3)</sup>.
ange of 17% to 22%, as previously provided at our Securities Analyst Meeting. HPE is raising revenue growth expectations for the Networking segment to 68% to 73%. HPE estimates GAAP operating profit growth to be 490% to 550% and non-GAAP operating profit growth between 32% to 40%<sup>(1)(3)</sup>. HPE is raising both GAAP diluted net EPS to be in the range of 1.02 to 1.22 and non-GAAP diluted net EPS<sup>(1)(4)</sup> to be in the range of 2.30 to 2.50. Fiscal 2026 full year non-GAAP diluted net EPS estimate excludes net after-tax adjustments of approximately $1.28 per diluted share, primarily related to amortization of intangible assets, stock-based compensation expense, acquisition, disposition and other
charges, cost reduction program, and adjustments related to the sale of H3C. HPE is also raising its free cash flow<sup>(1)(2)(4)</sup> guidance and now expects free cash flow to be at least $2.0 billion. 1 A description of HPE’s use of non-GAAP financial information is provided below under “Use of non- GAAP financial information and key performance metrics.” 2 Free cash flow represents cash flow from operations, less net capital expenditures (investments in property, plant & equipment (“PP&E”) and software assets less proceeds from the sale of PP&E), and adjusted for the effect of exchange rate fluctuations on cash, cash equivalents, and restricted cash. 3 FY26 non-GAAP operating profit excludes costs of approximately $2.7 billion primarily related to amortization of intangible assets, stock-based compensation expense, acquisition, disposition and other charges, and cost reduction program. 4 Hewlett Packard Enterprise provides certain guidance on a non-GAAP basis. In reliance on the exception provided by Item 10(e)(1)(i)(B) of Regulation S-K, Hewlett Packard Enterprise is unable to provide a reconciliation to the most directly comparable GAAP financial measure without unreasonable efforts, as the Company cannot predict some elements that are included in such directly comparable GAAP financial measure. These elements could have a material impact on the Company’s reported GAAP results for the guidance period. Refer to the discussion of non-GAAP financial measures below for more information.
• 2024 market size: $188bn (+2.1% YoY) Total gamers in 2024 by region (millions): • Public markets: leading public gaming ETFs up 22- • 36% YTD (vs S&P 500 = 21%) Middle East & Africa Venture funding in Q3‘ 24: $517m across 92 deals 559 (funding +1% QoQ, number of deals -14% QoQ) (16%) • Epic sidesteps Apple in the EU, sues Google Europe (454 3,422m • Discord launches Activities ...
The analysis tracks venture‑capital financing of AI‑driven gaming startups from 2020 through 2024, quantifying how artificial‑intelligence tools have reshaped investment patterns across three verticals: in‑game content generation, development‑infrastructure platforms, and ancillary AI applications such as marketing, analytics and community management. By filtering for companies that received external VC funding and excluding studios that merely use AI internally, the study aggregates deal counts and monetary values from public financing announcements, creating a comprehensive view of market dynamics over a five‑year horizon. Across the period, investors allocated roughly $1.8 billion to AI‑focused gaming ventures, with $1.2 billion directed toward content‑generation tools, $0.4 billion to infrastructure solutions, and $0.2 billion to other AI‑enabled services. Deal activity accelerated markedly, rising from 35 transactions in 2020 to 73 in 2024, and the total deal value expanded at an estimated compound annual growth rate of 35 percent between 2022 and 2024. By the end of 2024, AI‑centric startups accounted for about 65 percent of all gaming‑related VC deals, indicating a strategic shift from broad platform bets toward specialized, scalable AI tooling. The largest financing rounds highlight the sector’s appetite for high‑impact content generators: stability.ai secured a $101 million seed round in October 2022, Parametrix.ai raised $100 million in a Series B the following month, and Pika closed an $80 million Series B in June 2024. Andreessen Horowitz emerged as the most active investor, participating in 20 deals worth $233 million, followed by BITKRAFT with 12 deals totaling $177 million and Y Combinator with eight deals for $23 million. Early‑stage rounds dominate the landscape; although the average check size tripled from 2020 to 2024, the majority of investments—124 deals—
The gaming industry experienced a resilient start to 2023, with a projected global market size of $201 billion, representing a 9% year-over-year increase. Public markets showed strength, with gaming-focused exchange-traded funds (ETFs) recording gains between 10% and 23% year-to-date. While private market venture funding saw a total of $761 million across 109 deals in the first quarter, activity remains concentrated in early-stage investments, as late-stage funding has slowed significantly compared to the peak levels of 2021. Geographically, Asia led global venture funding in the first quarter, followed by North America and Europe. Emerging markets such as Africa and South America saw sporadic but notable deal activity, highlighting a broader global interest in gaming infrastructure and content. Major industry players currently hold approximately $48 billion in cash and equivalents, suggesting a stable environment for potential future mergers and acquisitions despite ongoing regulatory scrutiny regarding large-scale consolidation. Key industry trends in early 2023 include the integration of artificial intelligence for asset generation and conversational tools, alongside a strategic shift by major tech firms toward cloud-based gaming infrastructure. Competitive dynamics are evolving as Epic Games introduces self-publishing tools to challenge Steam’s market dominance and integrates user-generated content into its Fortnite ecosystem. Furthermore, platforms like Roblox are successfully expanding their reach by aging up their user demographic. These developments, supported by a robust schedule of global industry conferences, indicate a focus on platform scalability, content diversification, and the optimization of developer tools to sustain long-term growth.
The analysis presents a comprehensive snapshot of the global gaming industry in the second quarter of 2023, emphasizing the sector’s continued expansion and shifting investment dynamics. The market is projected to reach $201 billion in 2023, reflecting a 9 % year‑over‑year increase, while public gaming ETFs have risen between 10 % and 30 % since the start of the year, underscoring strong investor confidence. Cash reserves across leading public gaming firms total roughly $45 billion, supporting a robust merger‑and‑acquisition environment. Venture capital activity shows a pronounced contraction, with total gaming VC funding falling to $1.23 billion in Q2 2023—a 38 % decline quarter‑on‑quarter—driven primarily by a 60 % drop in growth‑stage investments. The number of deals fell 22 % to 194, with early‑stage financing in North America down about 60 % and Europe remaining essentially flat. Asia remains the most active region, accounting for the majority of growth‑stage capital, while South America’s activity is concentrated in Brazil and Africa recorded no deals during the period. Data are drawn from CB Insights, Newzoo, public market filings and company disclosures, covering all VC rounds from pre‑seed through late‑stage across 2019‑2023. Strategic developments highlighted include Apple’s launch of the Vision Pro spatial computer, Embracer Group’s restructuring toward first‑party IP, and the near‑completion of Microsoft’s acquisition of Activision Blizzard pending regulatory clearance in the UK, EU and US. Emerging trends point to a new era for user‑generated content, where popular IP will drive platform growth, and the expanding role of generative AI in asset creation, map design and NPC behavior. The report also outlines the 2023 conference calendar and provides a brief profile of Konvoy’s investment focus, assets under management and recent activity in frontier gaming technologies.