EG7 reported a solid Q2 2025 performance, with net revenue rising 7.4 % year‑over‑year to MSEK 379 and adjusted EBITDA increasing 12.1 % to MSEK 38, maintaining a margin of 9.9 %. Excluding foreign‑exchange effects, revenue growth reached 17 %, and organic growth stood at 6.7 %. The group’s cash position remained healthy, with a net cash balance of MSEK 102.5 after debt and short‑term earnouts.
Key drivers included the launch of Palia on PlayStation 5, Xbox Series X/S and PC in May, which achieved 215 k peak daily active users (DAU) and 1.2 m monthly active users (MAU), tripling pre‑release figures, and a 3× increase in average daily revenue. The first DLC for MechWarrior 5: Clans was released, with a second DLC slated for September 2025. Other projects such as Cold Iron and Fireshine continued to progress, while M&A activity remained selective due to market volatility.
Geographically the revenue mix was dominated by Daybreak (50 %) and Big Blue Bubble (16 %), with the rest of the group contributing 34 %. Adjusted EBITDA contributions were largely from Big Blue Bubble (66 %) and the rest of the group (27 %). FX fluctuations, particularly USD/SEK and GBP/SEK, impacted revenue but were offset by strong domestic performance.
Looking forward, EG7 anticipates a stable quarter with continued growth from Palia releases and MechWarrior DLCs, underpinned by robust cash flows and a lean operating model that supports disciplined M&A pursuits.
Ubisoft · 2026
Capcom · 2026
Aream & Co · 2026
Konvoy · 2024
DDM · 2024
Nintendo · 2024
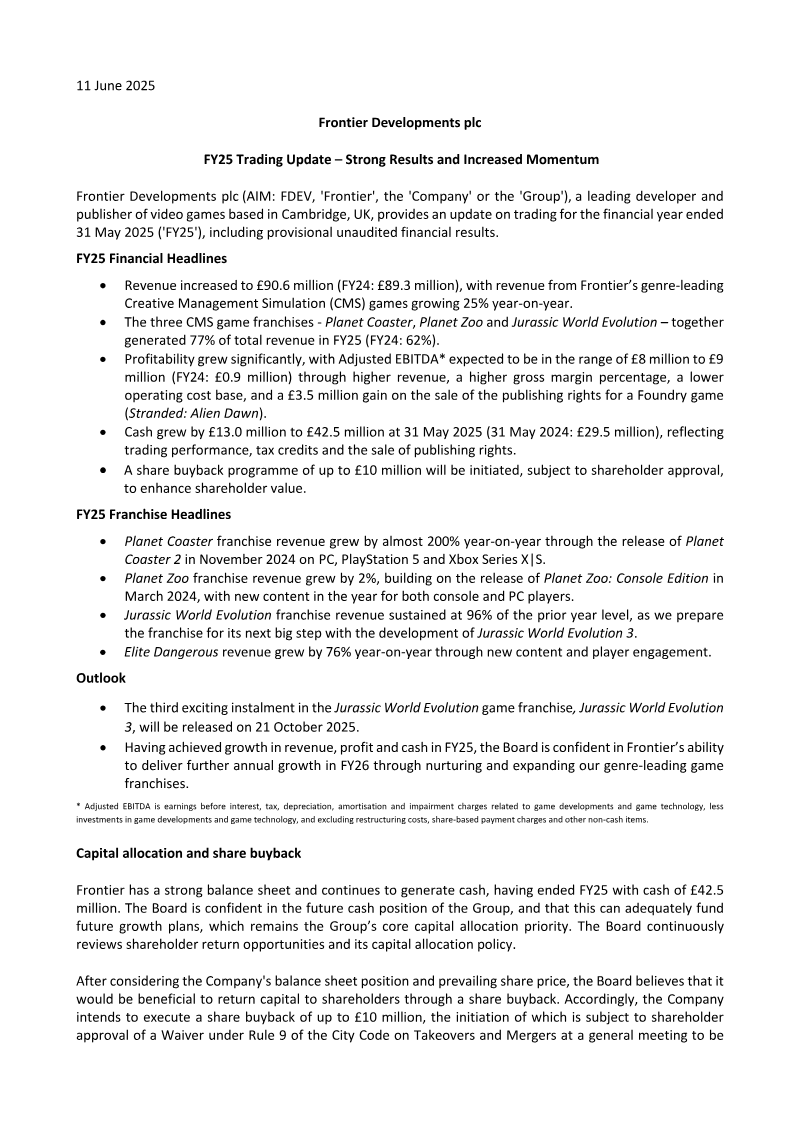
Frontier Developments
PCF Group
11 bit studios
PCF Group

Capcom
PCF Group
