FinancialMarvelous
Marvelous Consolidated Financial Results H1 FY2026 (Six Months Ended September 30, 2025)
1 Oct 20259 pages~13 min full read
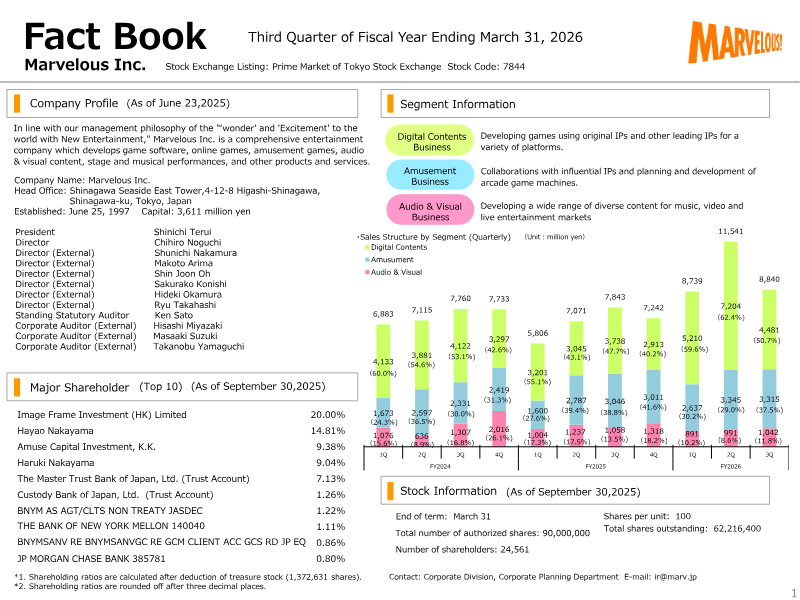
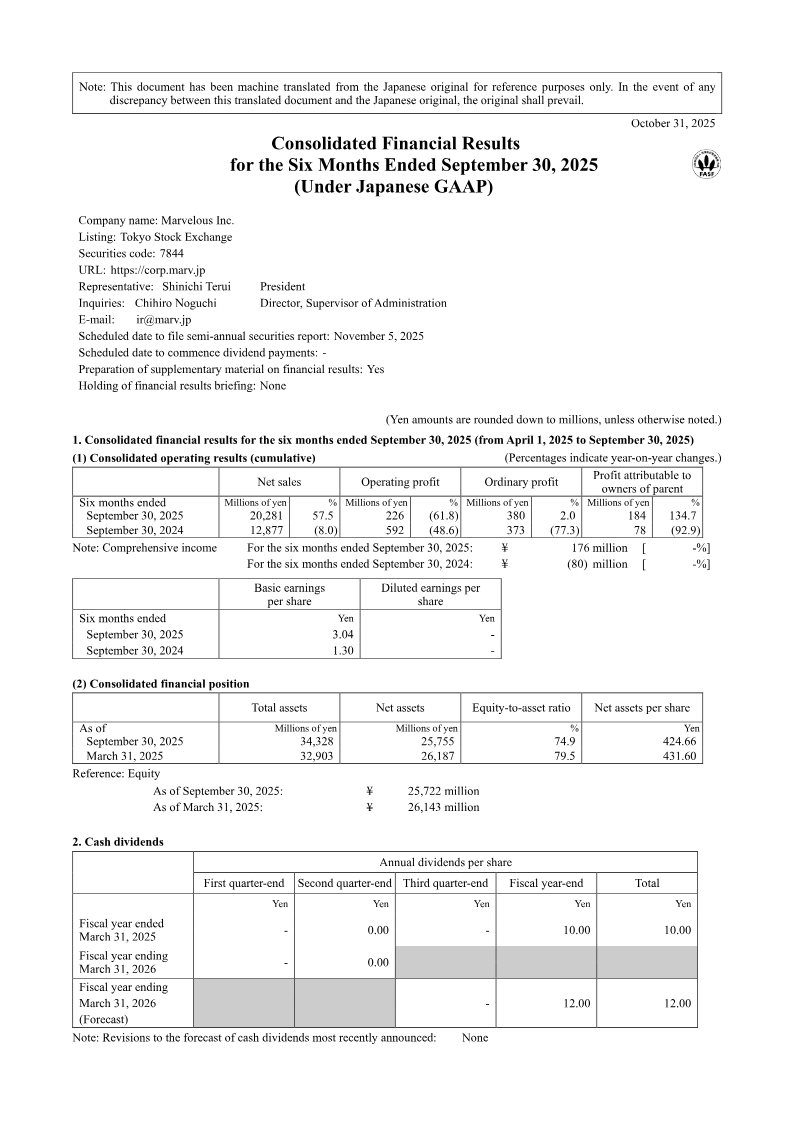
Marvelous Inc. reported a 57.5% year-on-year increase in net sales to 20,281 million yen for H1 FY2026, driven by a doubling of revenue in the Digital Contents Business.
Operating profit plummeted 61.8% to 226 million yen, primarily due to a 1,070 million yen segment loss within the Digital Contents division.
Profitability was supported by the Amusement and Audio & Visual segments, which generated segment profits of 1,702 million yen and 483 million yen, respectively.
Cash flow from operating activities improved to a 5,822 million yen surplus, largely due to a significant reduction in inventory levels.
Profit attributable to owners of the parent rose 134.7% to 184 million yen, bolstered by a reduction in non-operating expenses compared to the previous year's foreign exchange losses.
The company maintained its full-year forecast of 35,000 million yen in net sales and 2,000 million yen in operating profit, signaling a reliance on H2 performance to recover margins.
Marvelous Inc. increased its annual dividend from 10 yen to 12 yen per share, citing confidence in long-term financial health despite current margin compression.
Marvelous Inc. reported consolidated financial results for the first half of the fiscal year ending March 31, 2026, covering the period from April 1, 2025, to September 30, 2025. The data reveals a significant divergence between top-line growth and operational profitability. Net sales rose sharply by 57.5% year-on-year to 20,281 million yen, driven primarily by the Digital Contents Business, which saw revenues nearly double. Despite this revenue surge, operating profit fell by 61.8% to 226 million yen. This decline was largely due to a segment loss of 1,070 million yen in the Digital Contents division, contrasting with the previous year’s profit. Conversely, the Amusement and Audio & Visual segments showed improved profitability, contributing 1,702 million yen and 483 million yen in segment profit, respectively.
The financial position remains stable with total assets of 34,328 million yen and an equity-to-asset ratio of 74.9%. Cash flows from operating activities improved dramatically, shifting from a deficit in the prior year to a surplus of 5,822 million yen, aided by a substantial decrease in inventories. Profit attributable to owners of the parent rose 134.7% to 184 million yen, supported by reduced non-operating expenses compared to the previous year’s foreign exchange losses.
Looking ahead, the full-year forecast remains unchanged, projecting net sales of 35,000 million yen and an operating profit of 2,000 million yen. This outlook suggests a heavy reliance on second-half performance to recover the current margin compression. The company plans to increase its annual dividend from 10 yen to 12 yen per share, reflecting confidence in its long-term financial health despite the immediate pressure on operating margins.