Updated Mar 23, 2026 by Hibiya Engineering
Financial · November 1, 2017
Published by Hibiya Engineering
The consolidated financial results for Hibiya Engineering, Ltd. for the second quarter of the fiscal year ending March 31, 2018, reflect a period of mixed operational performance against a backdrop of moderate economic recovery in Japan. While the company experienced a decline in core profitability, significant gains from the sale of investment securities bolstered the bottom line. The report covers the six-month period from April 1, 2017, to September 30, 2017, and adheres to Japanese GAAP accounting standards. Operational data indicates that net sales decreased by 6.4% year-on-year to 27,705 million yen, and operating profit fell by 54.1% to 708 million yen. Ordinary profit also saw a decline of 37.8% to 918 million yen. Despite these operational contractions, profit attributable to owners of the parent surged by 454.8% to 5,006 million yen, primarily driven by 4,523 million yen in extraordinary income generated from the sale of investment securities. Orders received during the period showed resilience, increasing by 3.6% to 35,654 million yen, supported by steady demand in the construction sector for redevelopment and productivity-enhancing capital expenditures. The company’s financial position remains stable, with total assets of 82,615 million yen and an equity ratio of 80.5% as of September 30, 2017. Total liabilities decreased significantly to 14,302 million yen, largely due to a reduction in notes and accounts payable. Management has maintained its full-year forecast for the fiscal year ending March 2018, projecting net sales of 75,000 million yen and an operating profit of 4,000 million yen. No changes were reported regarding accounting principles, significant subsidiaries, or going concern assumptions during this reporting period.
November 7, 2017 Summary of Consolidated Financial Results For the Second Quarter of Fiscal Year Ending March 31, 2018 [Japan GAAP] Company: Hibiya Engineering, Ltd. Stock exchange listing: Tokyo Stock Exchange (First Section) Stock code: 1982 URL: http://www.hibiya-eng.co.jp/English Representative Director: Yoshiharu Nishimura, President Contact: Hiroshi Ikeji, Senior Executive Officer, Manager of IR and PR Office, Administration Division Tel: 03-3454-2720 Date of filing of quarterly securities report: November 8, 2017 (tentative) Date of commencement of dividend payment: December 4, 2017 (tentative) Supplementary explanatory documents: No Earnings presentation: Yes (For institutional investors and analysts) (Yen in millions, rounded down, figures in parentheses indicate negative amounts or percentages) 1. Financial results for the first half of the fiscal year ending March 2018 (April 1, 2017 – September 30, 2017) (1) Result of operations (Consolidated, year-to-date) (Percentage figures represent year on year changes) Net sales Operating profit Ordinary profit Profit attributable to owners of parent Million yen % Million yen % Million yen % Million yen % First half ended September 2017 27,705 (6.4) 708 (54.1) 918 (37.8) 5,006 454.8 First half ended September 2016 29,586 8.6 1,543 - 1,475 - 902 - Note: Comprehensive income: First half of FY3/2018: 6,198 million yen [-%], First half of FY3/2017: 489 million yen [-%] Earnings per share Earnings per share fully diluted Yen Yen First half ended September 2017 172.87 172.00 First half ended September 2016 30.81 30.64
8.6 1,543 - 1,475 - 902 - Note: Comprehensive income: First half of FY3/2018: 6,198 million yen [-%], First half of FY3/2017: 489 million yen [-%] Earnings per share Earnings per share fully diluted Yen Yen First half ended September 2017 172.87 172.00 First half ended September 2016 30.81 30.64 (2) Financial Position (Consolidated) Total assets Net assets Equity ratio Net assets per share Million yen Million yen % Yen As of September 30, 2017 82,615 68,312 80.5 2,302.36 As of March 31, 2017 93,661 63,719 65.4 2,117.40 Reference: Shareholders’ equity As of September 30, 2017: 66,503 million yen As of March 31, 2017: 61,251 million yen 2. Dividends Dividend per share End of 1Q End of 2Q End of 3Q End of FY Full year Yen Yen Yen Yen Yen Fiscal year ended March 2017 - 25.00 - 25.00 50.00 Fiscal year ending March 2018 - 30.00 Fiscal year ending March 2018 (estimate) - 30.00 60.00 Note 1: Change in the estimation of dividend from the latest announcement: No 2: FY3/17 dividends include 40.00 yen ordinary dividend and 10.00 yen commemorative dividend. 3. Forecast for the fiscal year ending March 2018 (Consolidated, April 1, 2017 to March 31, 2018) (Percentage figures represent year on year changes)
timation of dividend from the latest announcement: No 2: FY3/17 dividends include 40.00 yen ordinary dividend and 10.00 yen commemorative dividend. 3. Forecast for the fiscal year ending March 2018 (Consolidated, April 1, 2017 to March 31, 2018) (Percentage figures represent year on year changes) Net sales Operating profit Ordinary profit Profit attributable Earnings to owners of per share parent Million yen % Million yen % Million yen % Million yen % Yen Full year 75,000 (4.3) 4,000 (28.7) 5,000 (28.3) 7,300 40.2 252.35 Note: Change in the forecast from the latest announcement: No
* Notes (1) Changes in significant subsidiaries (Changes in specific subsidiaries accompanied by changes in the scope of consolidation): No (2) Use of of accounting methods specifically for the preparation of the quarterly consolidated financial statements: No (3) Changes in accounting principles and estimates, and retrospective restatement (a) Changes due to revision of accounting standards: No (b) Changes other than in (a): No (c) Changes in accounting estimates: No (d) Retrospective restatement: No (4) Number of shares outstanding (common shares) (a) Shares outstanding (including treasury shares) As of September 30, 2017: 31,000,309 As of March 31, 2017: 31,000,309 (b) Treasury shares As of September 30, 2017: 2,115,382 As of March 31, 2017: 2,072,671 (c) Average number of shares (quarterly consolidated cumulative period) Period ended September 30, 2017: 28,962,968 Period ended September 30, 2016: 29,290,476 * This report is exempt from the audit procedure Forward-looking statements, important notes, etc. These materials contain forward-looking statements that are based on information available to management as of the date of this report. Actual results may be materially different from these forecasts for a number of reasons. This is an English translation of the captioned report. This translation is prepared and provided for the purpose of the reader’s convenience.
information available to management as of the date of this report. Actual results may be materially different from these forecasts for a number of reasons. This is an English translation of the captioned report. This translation is prepared and provided for the purpose of the reader’s convenience. All readers are recommended to refer to the original version in Japanese of the report for complete information.
Index for Supplementary Information 1. Results of Operations ............................................................................................................................................. 2 (1) Overview on consolidated business performance......................................................................................... 2 (2) Overview of financial condition ..................................................................................................................... 2 (3) Forecast for fiscal year ending in March 2018 .............................................................................................. 2 2. Quarterly Consolidated Financial Statements and Important Notes ....................................................................... 3 (1) Quarterly consolidated balance sheet........................................................................................................... 3 (2) Quarterly consolidated statements of income and consolidated statements of comprehensive income....... 5 (Quarterly consolidated statements of income)............................................................................................. 5 (For the first half) .......................................................................................................................................... 5 (Quarterly consolidated statements of comprehensive income) ................................................................... 6 (For the first half) ..........................................................................................................................................
France Bed Holdings Co., Ltd. released its consolidated financial results for the six-month period ending September 30, 2025, prepared in accordance with Japanese GAAP. The report details the company’s operating performance, financial position, and cash flow status, while maintaining its previously announced earnings forecasts for the full fiscal year ending March 31, 2026. During the first half of the fiscal year, the company reported net sales of 29,259 million yen, remaining essentially flat compared to the same period in the previous year. However, profitability metrics experienced a decline, with operating profit falling 16.0% to 1,782 million yen and ordinary profit decreasing 17.7% to 1,765 million yen. 
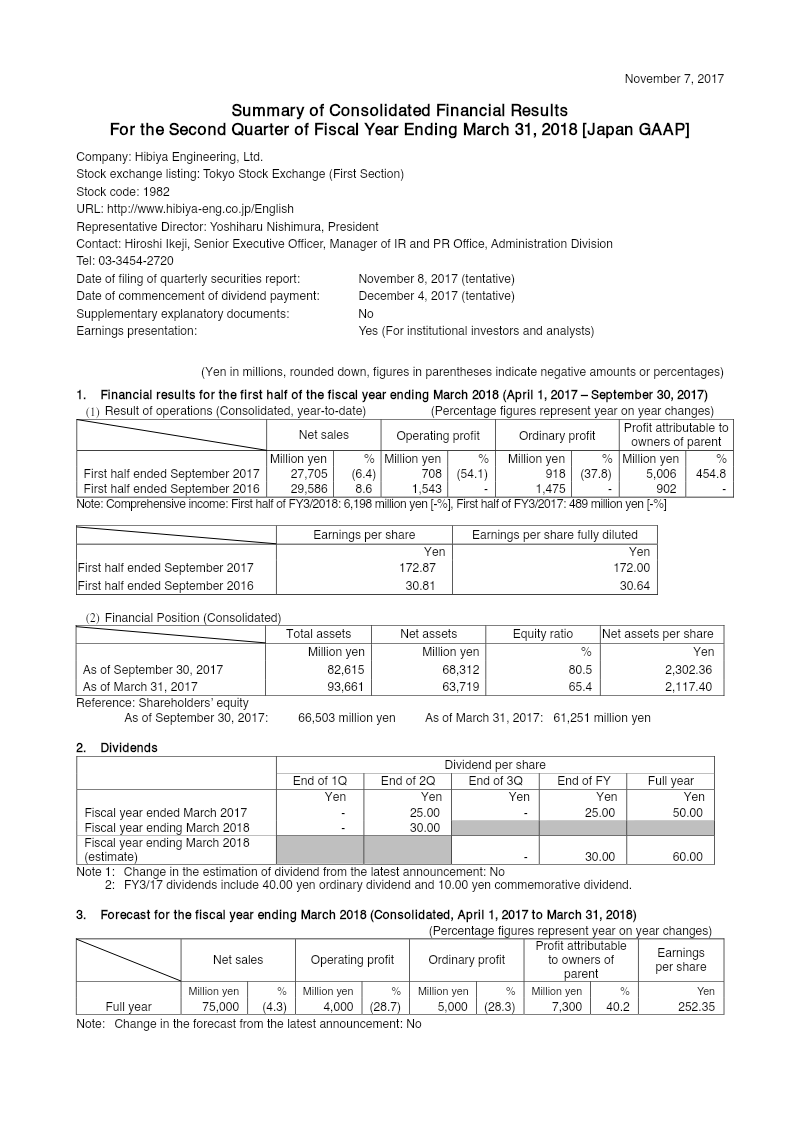
Profit attributable to owners of the parent reached 1,047 million yen, representing a 20.9% year-on-year decline. Basic earnings per share for the period were 31.20 yen, down from 38.36 yen in the prior year. The company’s financial position as of September 30, 2025, shows total assets of 67,084 million yen and net assets of 39,158 million yen, resulting in an equity-to-asset ratio of 58.3%. Cash flows from operating activities provided 2,541 million yen, while investing and financing activities reflected ongoing capital allocation, including the purchase of treasury shares and continued investment in property, plant, and equipment. Looking ahead to the full fiscal year ending March 31, 2026, the company maintains its forecast of 62,300 million yen in net sales and 4,750 million yen in operating profit. These projections reflect a modest growth expectation of 2.8% in sales and 1.1% in operating profit compared to the previous fiscal year. The company continues to operate under stable accounting policies with no significant changes in the scope of consolidation.
TOWA Corporation’s consolidated financial results for the nine months ended December 31, 2025, reflect a challenging period characterized by a year-on-year decline in both revenue and profitability. Net sales reached 36,930 million yen, representing a 5.9% decrease compared to the same period in the previous year. Operating profit fell significantly by 43.5% to 3,685 million yen, while profit attributable to owners of the parent declined by 49.0% to 2,627 million yen. These results were primarily driven by a shift in product mix, increased development costs, and the adverse impacts of U.S. tariff policies and sluggish demand within the automotive semiconductor sector. The company operates across three primary segments: Semiconductor Manufacturing Equipment, Medical Device, and Laser Processing Machine. The Semiconductor Manufacturing Equipment business, which constitutes the majority of total sales, saw a 6.0% decline in revenue to 33,940 million yen. While the Medical Device segment experienced a modest revenue increase of 7.8%, the Laser Processing Machine business faced a 20.0% decline in sales and an operating loss of 86 million yen. Despite these headwinds, the company reported a strong order environment, particularly for AI and data center-related memory applications, with third-quarter orders reaching their second-highest level on record. As of December 31, 2025, the company’s financial position remains stable with total assets of 101,357 million yen and an equity-to-asset ratio of 66.6%. Looking ahead, the company has revised its full-year forecasts downward due to delayed revenue recognition from mass production investments and higher costs associated with initial shipments. However, management anticipates a recovery trend, supported by a robust order backlog and expected improvements in product mix as demand for compression equipment grows.
TOWA CORPORATION’s consolidated financial results for the six months ended September 30, 2025, reflect a period of significant year-on-year decline in both revenue and profitability. The company reported net sales of 23,449 million yen, a 14.4% decrease compared to the same period in the previous fiscal year. Operating profit fell by 52.6% to 2,493 million yen, while profit attributable to owners of the parent dropped 51.7% to 1,849 million yen. These results were primarily driven by a slowdown in orders that began in the second half of the previous fiscal year, stemming from weak demand in consumer and memory semiconductor markets and the impact of international tariff policies. The semiconductor manufacturing equipment business, which represents the company’s primary segment, saw net sales decline by 14.7% to 21,585 million yen, with operating profit falling 53.6%. The laser processing machine business also struggled, reporting an operating loss of 82 million yen. Conversely, the medical device business showed resilience, achieving an 8.4% increase in net sales to 1,224 million yen. Despite the overall downturn, the company noted a gradual recovery in capital investment during the second quarter, particularly in China, Taiwan, and other Asian markets, which helped profits exceed initial internal expectations. As of September 30, 2025, the company maintained a solid financial position with total assets of 91,013 million yen and an equity-to-asset ratio of 70.1%. Given the ongoing market uncertainties and fluctuating customer investment trends, the company has opted to maintain its previously announced full-year earnings forecast for the fiscal year ending March 31, 2026, which projects net sales of 56,000 million yen and an operating profit of 9,800 million yen.
TOWA CORPORATION’s consolidated financial results for the first quarter ended June 30, 2025, reflect a period of significant contraction compared to the same period in the previous fiscal year. The company reported net sales of 8,080 million yen, representing a 39.0% year-on-year decline. Profitability metrics also shifted into negative territory, with an operating loss of 581 million yen, an ordinary loss of 732 million yen, and a loss attributable to owners of the parent of 528 million yen. This performance stands in stark contrast to the first quarter of 2024, which saw an operating profit of 2,212 million yen. The primary driver of this downturn was the semiconductor manufacturing equipment business, which experienced a 41.2% decrease in net sales, resulting in an operating loss of 607 million yen. Management attributes this decline to heightened uncertainty regarding U.S. tariff policies, which prompted customers to adopt a cautious approach to capital investment and led to the rescheduling of equipment deliveries. While the medical device business maintained steady performance with a 4.3% increase in net sales, the laser processing machine business also saw a decline, with net sales falling 33.2% year-on-year. Despite these results, the company maintains a neutral outlook for the remainder of the fiscal year. Management reports that the order environment is showing signs of recovery, particularly in China, and notes that the customer base for its generative AI-related molding equipment is expanding. Consequently, the company has not revised its previously announced consolidated earnings forecasts for the second quarter or the full fiscal year, anticipating a return to profitability as capital investment and demand recover across key Asian markets.