FinancialHibiya Engineering
Summary of Consolidated Financial Results: Second Quarter Fiscal Year Ending March 31, 2016
9 pages~12 min full read
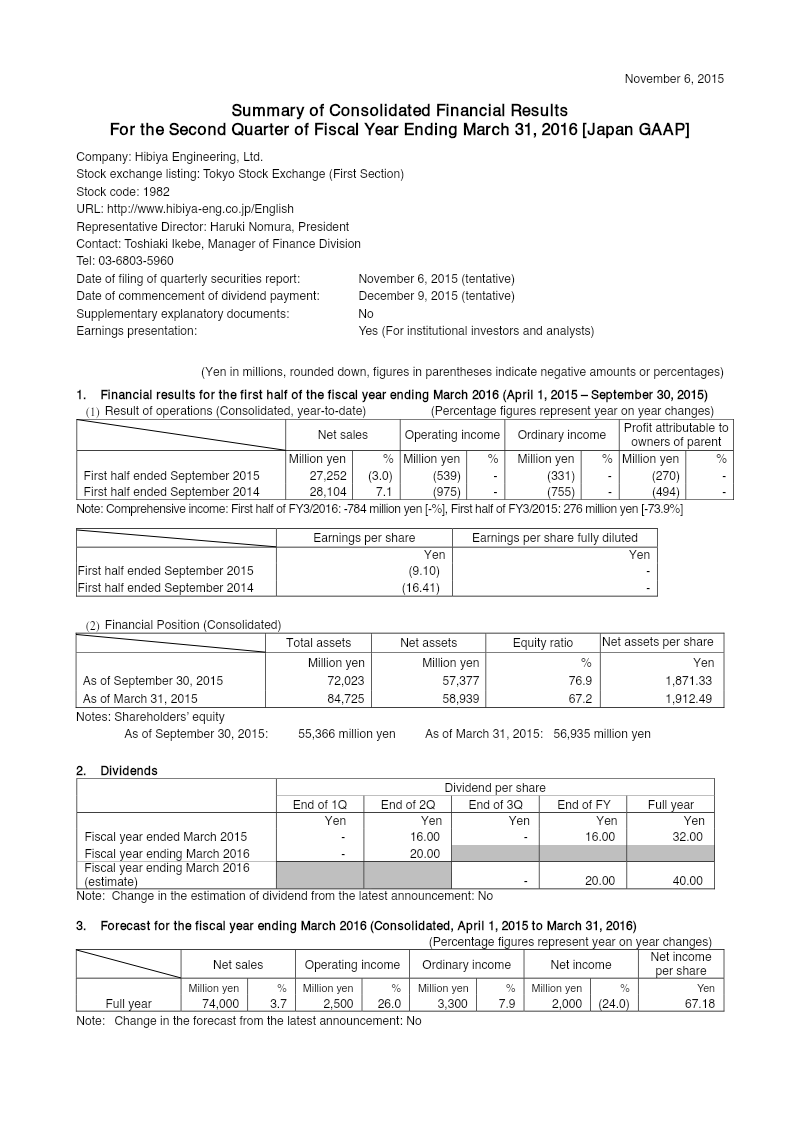
Hibiya Engineering reported an operating loss of 539 million yen for the first half of the fiscal year ending September 30, 2015, which represents an improvement over the 975 million yen loss recorded in the same period of the previous year.
See it on page 1Net sales declined 3.0% year-on-year to 27,252 million yen, while orders received fell 5.3% to 35,863 million yen due to rising material and labor costs in the Japanese construction sector.
See it on page 4The company narrowed its ordinary loss to 331 million yen from 755 million yen and reduced the loss attributable to owners of the parent to 270 million yen from 494 million yen.
See it on page 4Management maintains its full-year forecast for the fiscal year ending March 31, 2016, projecting net sales of 74,000 million yen and an operating income of 2,500 million yen.
See it on page 1Total assets decreased to 72,023 million yen, driven primarily by a reduction in accounts receivable from completed construction contracts.
See it on page 4Total liabilities fell to 14,646 million yen, largely due to a decrease in accounts payable.
See it on page 6The adoption of new accounting standards for business combinations and consolidated financial statements in the first quarter had no material impact on the company's earnings.
See it on page 4The consolidated financial results for Hibiya Engineering, Ltd. for the first half of the fiscal year ending March 31, 2016, detail a period of challenging operating conditions within the Japanese construction sector. Despite a broader economic recovery supported by government stimulus, the company faced significant pressure from rising material and labor costs. The primary objective of the report is to provide a transparent account of the company’s financial performance and operational status during the six-month period ending September 30, 2015.
Financial performance metrics indicate a contraction in business volume, with net sales declining 3.0% year-on-year to 27,252 million yen and orders received falling 5.3% to 35,863 million yen. While the company continued to implement cost-reduction measures, it reported an operating loss of 539 million yen, an improvement over the 975 million yen loss recorded in the same period of the previous year. Similarly, the ordinary loss narrowed to 331 million yen from 755 million yen, and the loss attributable to owners of the parent decreased to 270 million yen from 494 million yen.
The company’s financial position reflects a reduction in total assets to 72,023 million yen, largely driven by a significant decrease in accounts receivable from completed construction contracts. Total liabilities also saw a substantial decline to 14,646 million yen, primarily due to lower accounts payable. Regarding accounting methodology, the company adopted new standards concerning business combinations and consolidated financial statements starting in the first quarter of the fiscal year. These changes, which include updated terminology for non-controlling interests and revised allocation procedures for acquisition expenses, had no material impact on earnings. Management maintains its previously announced full-year forecast, projecting net sales of 74,000 million yen and an operating income of 2,500 million yen.