FinancialKadokawa Corporation
Consolidated Financial Results: Q3 Fiscal Year Ending March 2026
15 pages~6 min full read
Key insights
7 takeaways · ~3 min read- 01
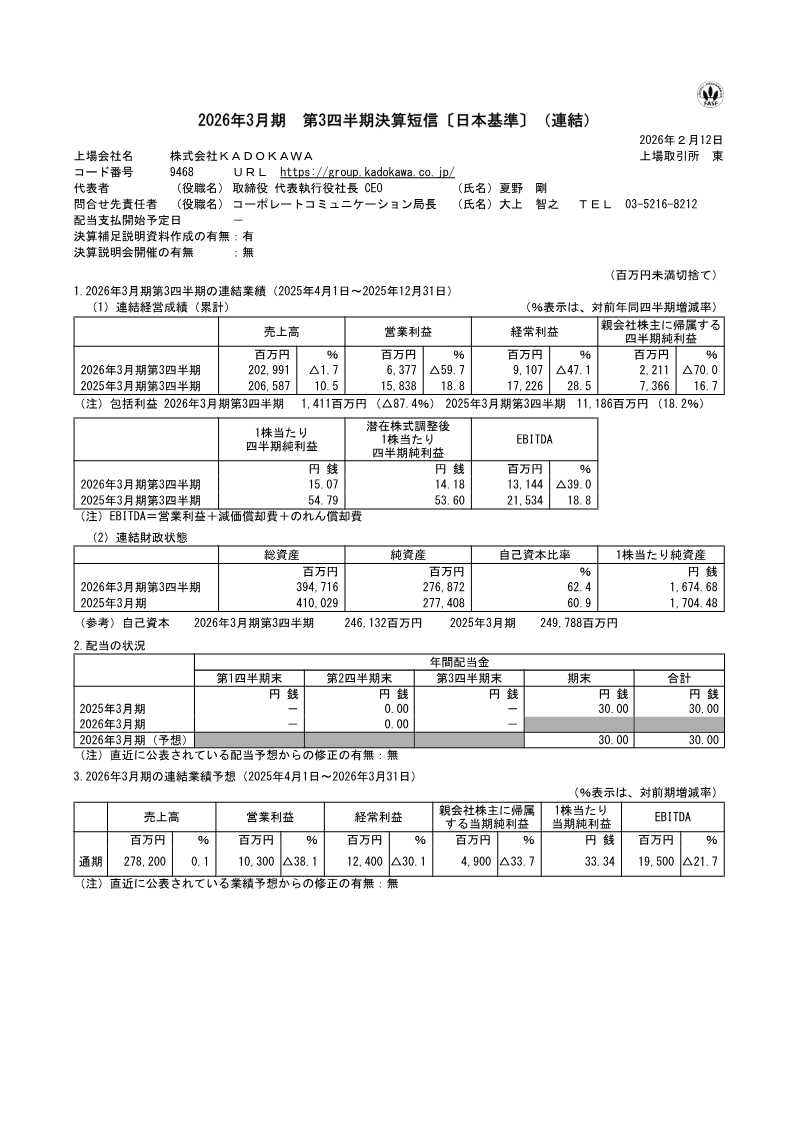
Kadokawa Corporation reported a net loss of ¥221 million for Q3 of the fiscal year ending March 2026, driven by a 59.7% decline in operating profit to ¥637 million.
See it on page 1 - 02
A cyberattack on the Niconico service resulted in a ¥2,338 million special loss, significantly impacting the company's bottom line.
See it on page 12 - 03
The publishing/IP creation segment saw operating profit plummet 90.2% to ¥623 million, while the animation/film segment recorded a loss of ¥940 million.
See it on page 4 - 04
The game unit experienced an 11.6% revenue decline, though it remained profitable with an operating profit of ¥8,050 million.
See it on page 4 - 05
The web services segment was a primary growth driver, achieving a 21.5% revenue increase and generating ¥2,187 million in operating profit.
See it on page 5 - 06
The company expanded its global footprint by acquiring Edizioni BD S.r.l. and SOZO Pte. Ltd., which added a combined ¥4,273 million in goodwill.
See it on page 14 - 07
Despite the quarterly losses, the company maintains a healthy equity ratio of 62.4% with ¥73 billion in cash and cash equivalents.
See it on page 11