Related Documents

Financial
Consolidated Financial Results: Fiscal Year Ended March 31, 2026
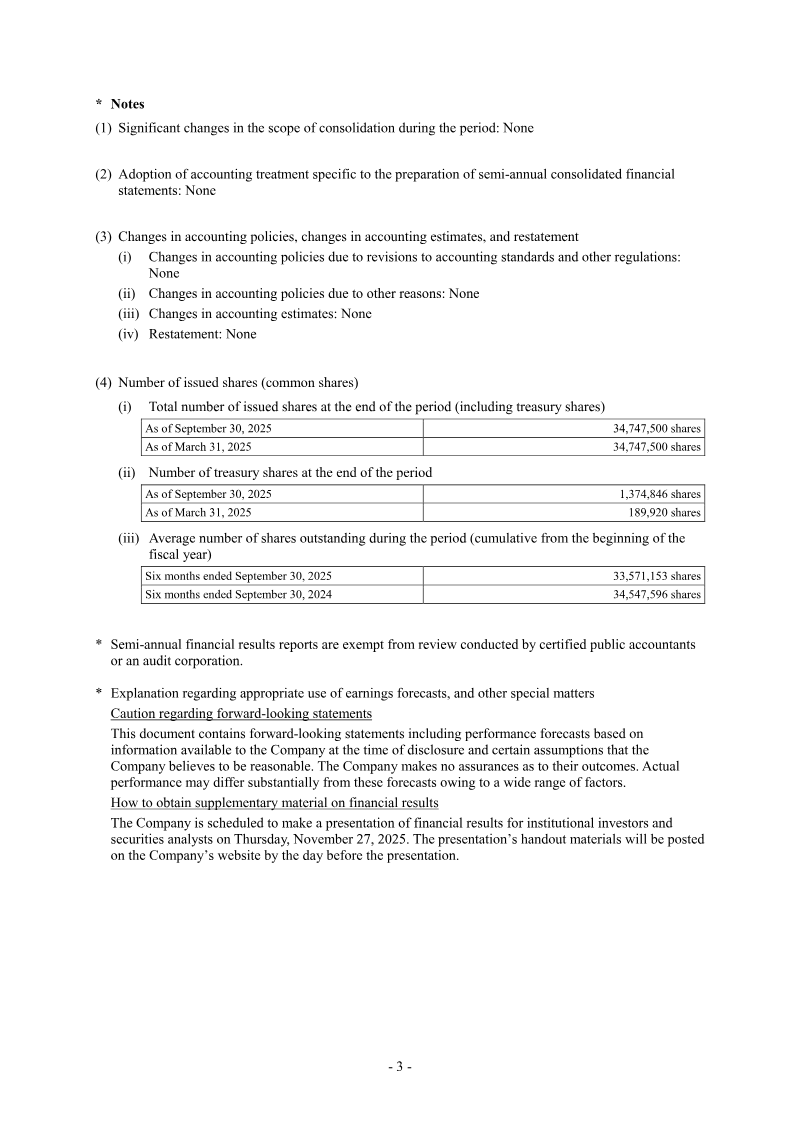
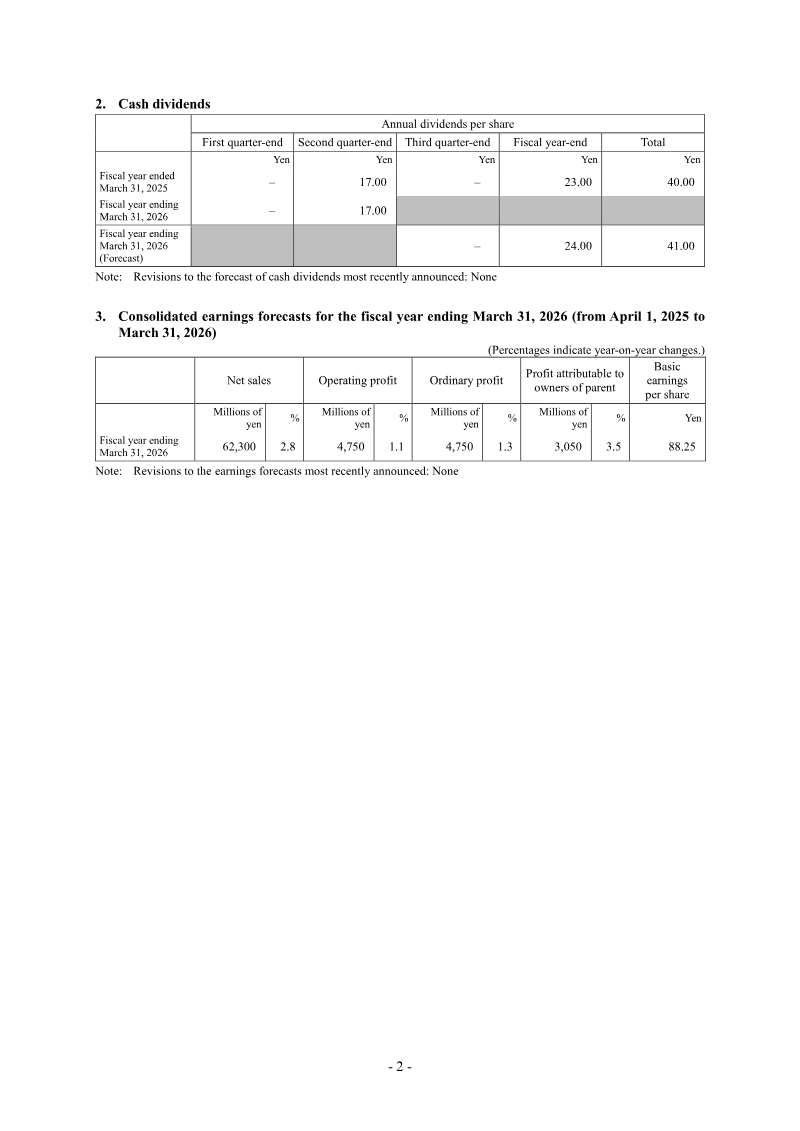
France Bed Holdings Co., Ltd. released its consolidated financial results for the six-month period ending September 30, 2025, prepared in accordance with Japanese GAAP. The report details the company’s operating performance, financial position, and cash flow status, while maintaining its previously announced earnings forecasts for the full fiscal year ending March 31, 2026. During the first half of the fiscal year, the company reported net sales of 29,259 million yen, remaining essentially flat compared to the same period in the previous year. However, profitability metrics experienced a decline, with operating profit falling 16.0% to 1,782 million yen and ordinary profit decreasing 17.7% to 1,765 million yen. Profit attributable to owners of the parent reached 1,047 million yen, representing a 20.9% year-on-year decline. Basic earnings per share for the period were 31.20 yen, down from 38.36 yen in the prior year. The company’s financial position as of September 30, 2025, shows total assets of 67,084 million yen and net assets of 39,158 million yen, resulting in an equity-to-asset ratio of 58.3%. Cash flows from operating activities provided 2,541 million yen, while investing and financing activities reflected ongoing capital allocation, including the purchase of treasury shares and continued investment in property, plant, and equipment. Looking ahead to the full fiscal year ending March 31, 2026, the company maintains its forecast of 62,300 million yen in net sales and 4,750 million yen in operating profit. These projections reflect a modest growth expectation of 2.8% in sales and 1.1% in operating profit compared to the previous fiscal year. The company continues to operate under stable accounting policies with no significant changes in the scope of consolidation.
FRANCE BED HOLDINGS CO.May 2026
Financial
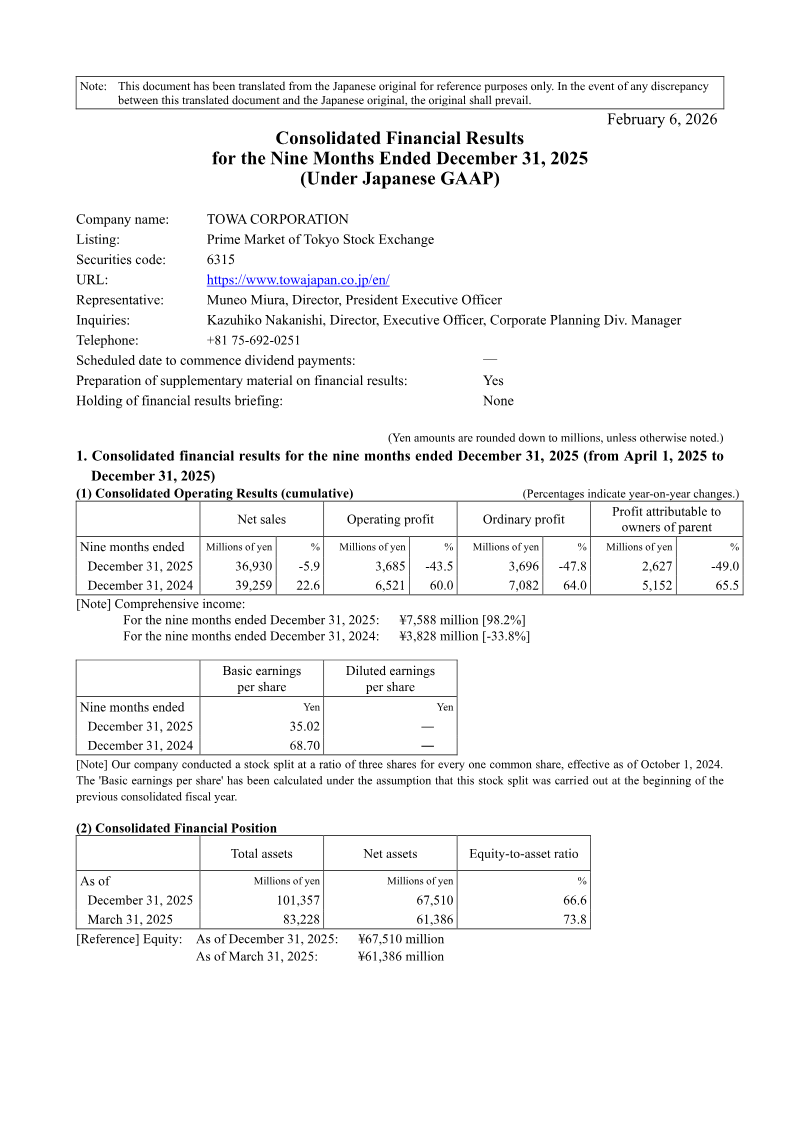
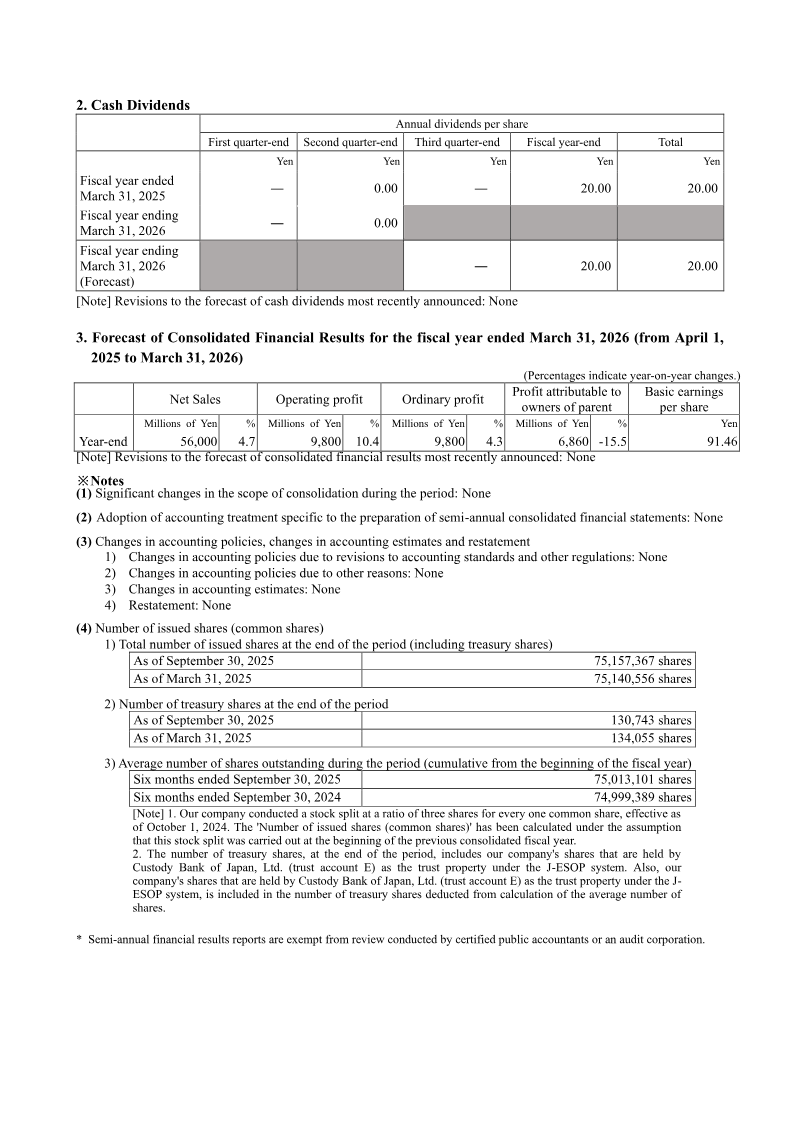
Consolidated Financial Results: Nine Months Ended December 31, 2025
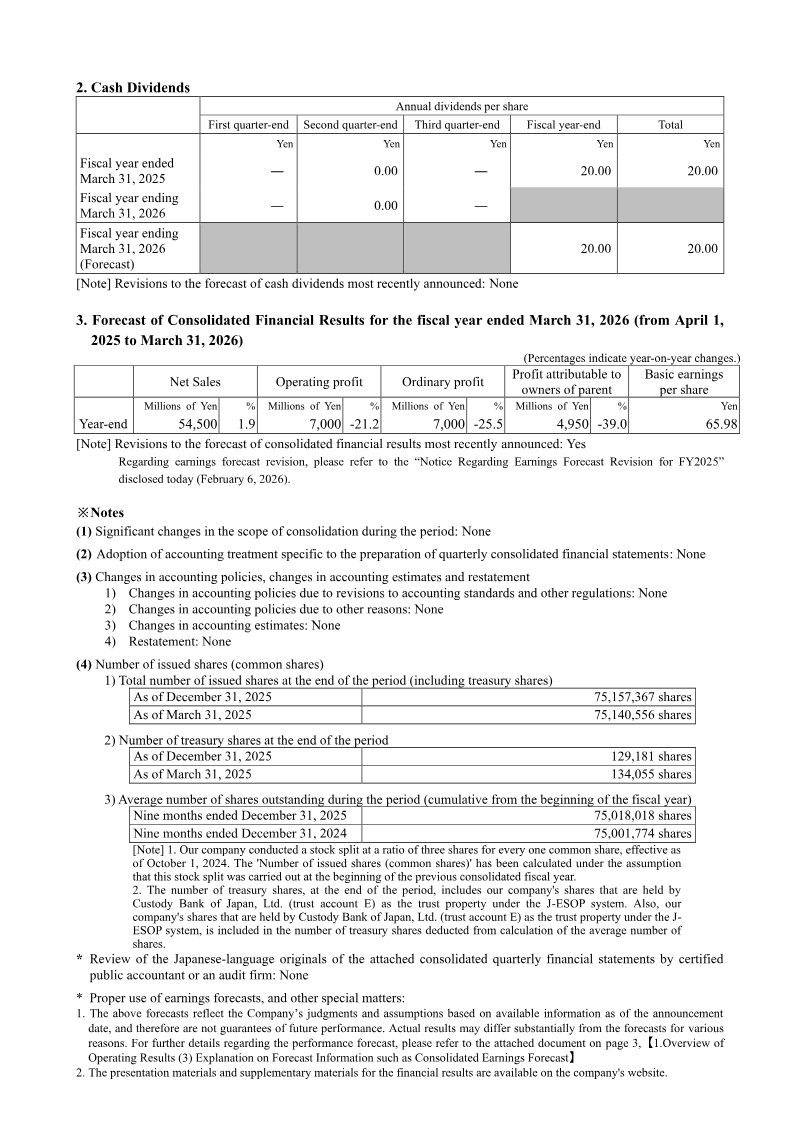
TOWA Corporation’s consolidated financial results for the nine months ended December 31, 2025, reflect a challenging period characterized by a year-on-year decline in both revenue and profitability. Net sales reached 36,930 million yen, representing a 5.9% decrease compared to the same period in the previous year. Operating profit fell significantly by 43.5% to 3,685 million yen, while profit attributable to owners of the parent declined by 49.0% to 2,627 million yen. These results were primarily driven by a shift in product mix, increased development costs, and the adverse impacts of U.S. tariff policies and sluggish demand within the automotive semiconductor sector. The company operates across three primary segments: Semiconductor Manufacturing Equipment, Medical Device, and Laser Processing Machine. The Semiconductor Manufacturing Equipment business, which constitutes the majority of total sales, saw a 6.0% decline in revenue to 33,940 million yen. While the Medical Device segment experienced a modest revenue increase of 7.8%, the Laser Processing Machine business faced a 20.0% decline in sales and an operating loss of 86 million yen. Despite these headwinds, the company reported a strong order environment, particularly for AI and data center-related memory applications, with third-quarter orders reaching their second-highest level on record. As of December 31, 2025, the company’s financial position remains stable with total assets of 101,357 million yen and an equity-to-asset ratio of 66.6%. Looking ahead, the company has revised its full-year forecasts downward due to delayed revenue recognition from mass production investments and higher costs associated with initial shipments. However, management anticipates a recovery trend, supported by a robust order backlog and expected improvements in product mix as demand for compression equipment grows.
TowaFeb 2026
Financial
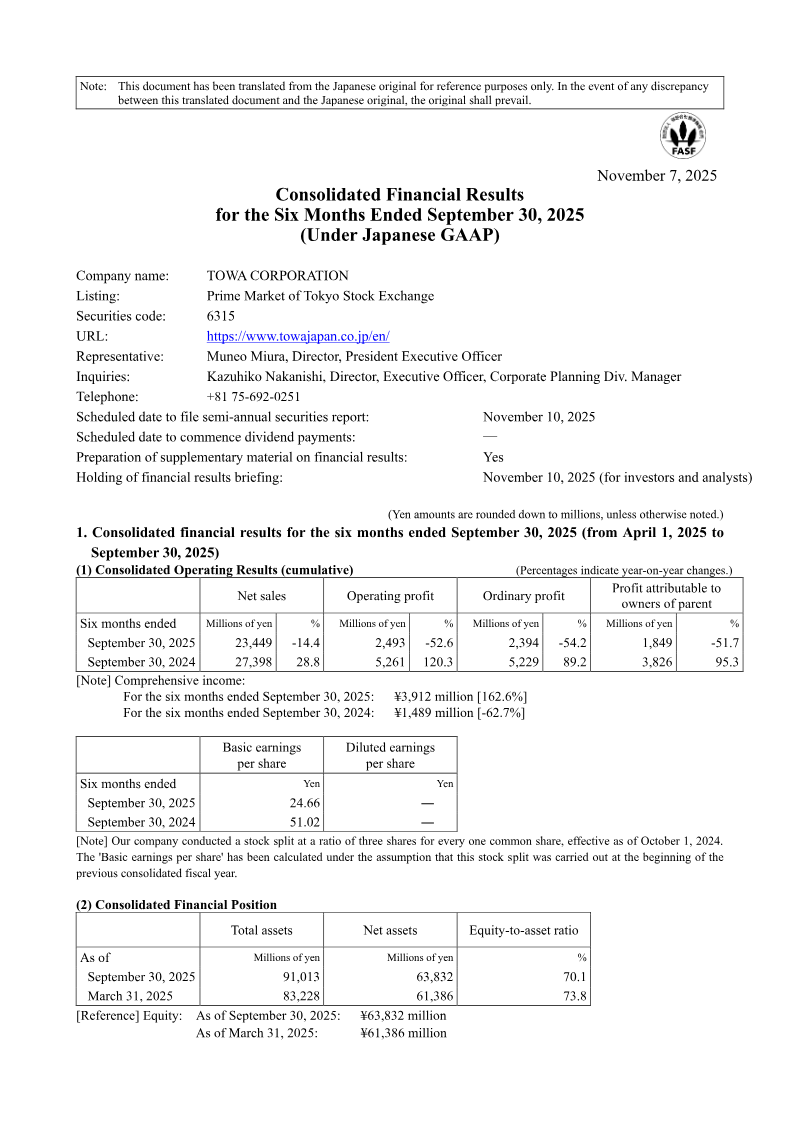
Consolidated Financial Results for the Six Months Ended September 30, 2025: Japan
TOWA CORPORATION’s consolidated financial results for the six months ended September 30, 2025, reflect a period of significant year-on-year decline in both revenue and profitability. The company reported net sales of 23,449 million yen, a 14.4% decrease compared to the same period in the previous fiscal year. Operating profit fell by 52.6% to 2,493 million yen, while profit attributable to owners of the parent dropped 51.7% to 1,849 million yen. These results were primarily driven by a slowdown in orders that began in the second half of the previous fiscal year, stemming from weak demand in consumer and memory semiconductor markets and the impact of international tariff policies. The semiconductor manufacturing equipment business, which represents the company’s primary segment, saw net sales decline by 14.7% to 21,585 million yen, with operating profit falling 53.6%. The laser processing machine business also struggled, reporting an operating loss of 82 million yen. Conversely, the medical device business showed resilience, achieving an 8.4% increase in net sales to 1,224 million yen. Despite the overall downturn, the company noted a gradual recovery in capital investment during the second quarter, particularly in China, Taiwan, and other Asian markets, which helped profits exceed initial internal expectations. As of September 30, 2025, the company maintained a solid financial position with total assets of 91,013 million yen and an equity-to-asset ratio of 70.1%. Given the ongoing market uncertainties and fluctuating customer investment trends, the company has opted to maintain its previously announced full-year earnings forecast for the fiscal year ending March 31, 2026, which projects net sales of 56,000 million yen and an operating profit of 9,800 million yen.
TowaNov 2025

Financial
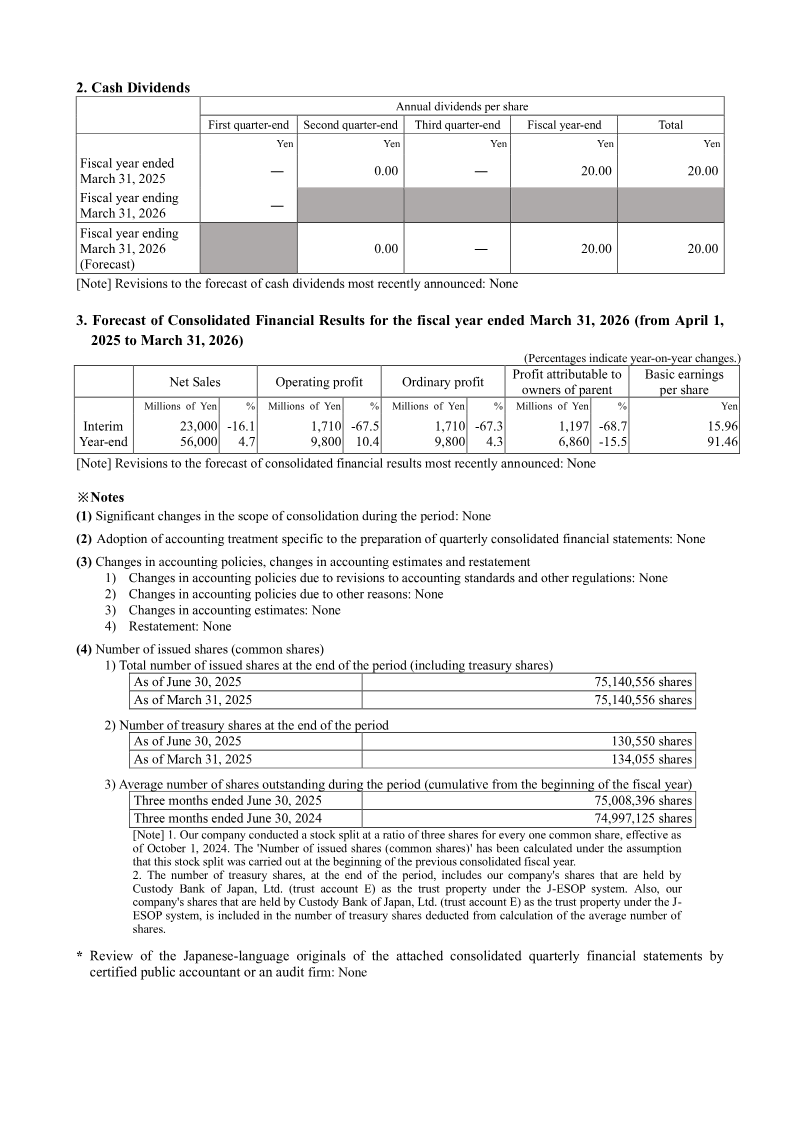
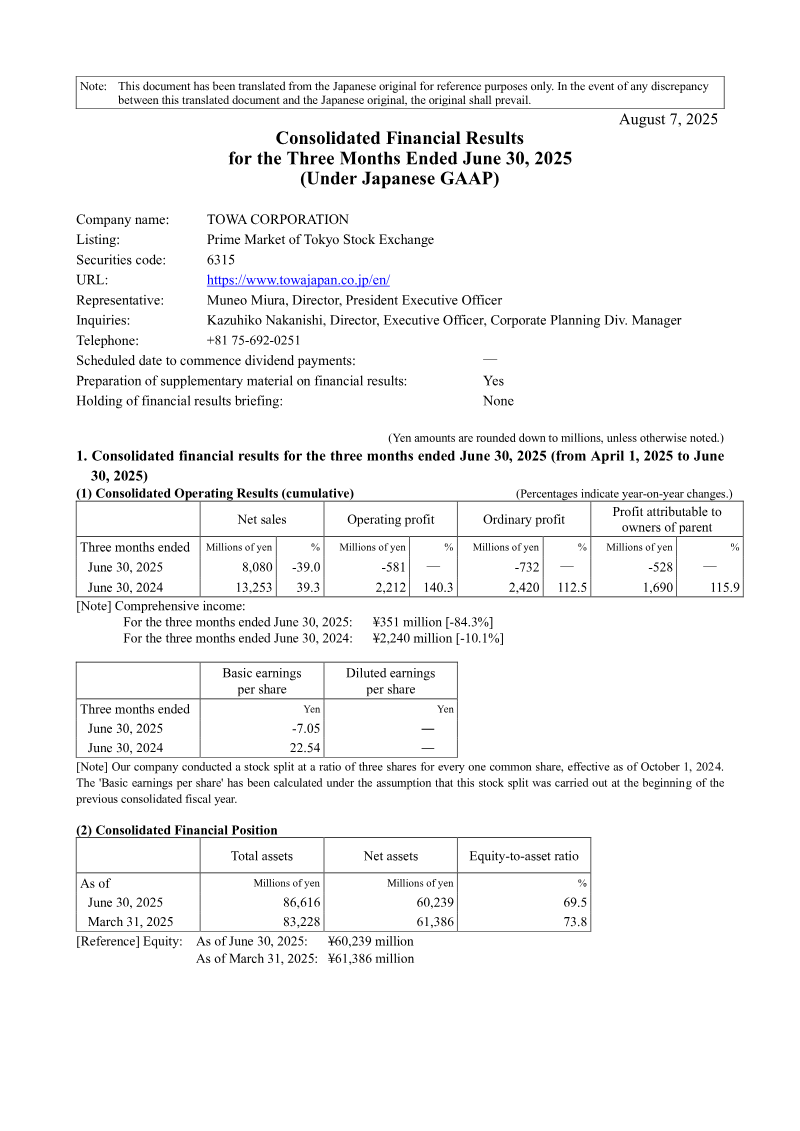
Consolidated Financial Results: Three Months Ended June 30, 2025
TOWA CORPORATION’s consolidated financial results for the first quarter ended June 30, 2025, reflect a period of significant contraction compared to the same period in the previous fiscal year. The company reported net sales of 8,080 million yen, representing a 39.0% year-on-year decline. Profitability metrics also shifted into negative territory, with an operating loss of 581 million yen, an ordinary loss of 732 million yen, and a loss attributable to owners of the parent of 528 million yen. This performance stands in stark contrast to the first quarter of 2024, which saw an operating profit of 2,212 million yen. The primary driver of this downturn was the semiconductor manufacturing equipment business, which experienced a 41.2% decrease in net sales, resulting in an operating loss of 607 million yen. Management attributes this decline to heightened uncertainty regarding U.S. tariff policies, which prompted customers to adopt a cautious approach to capital investment and led to the rescheduling of equipment deliveries. While the medical device business maintained steady performance with a 4.3% increase in net sales, the laser processing machine business also saw a decline, with net sales falling 33.2% year-on-year. Despite these results, the company maintains a neutral outlook for the remainder of the fiscal year. Management reports that the order environment is showing signs of recovery, particularly in China, and notes that the customer base for its generative AI-related molding equipment is expanding. Consequently, the company has not revised its previously announced consolidated earnings forecasts for the second quarter or the full fiscal year, anticipating a return to profitability as capital investment and demand recover across key Asian markets.
TowaAug 2025