FinancialHibiya Engineering
Summary of Consolidated Financial Results: Second Quarter of Fiscal Year Ending March 31, 2012 (Japan)
9 pages~10 min full read
Key insights
7 takeaways · ~3 min read- 01
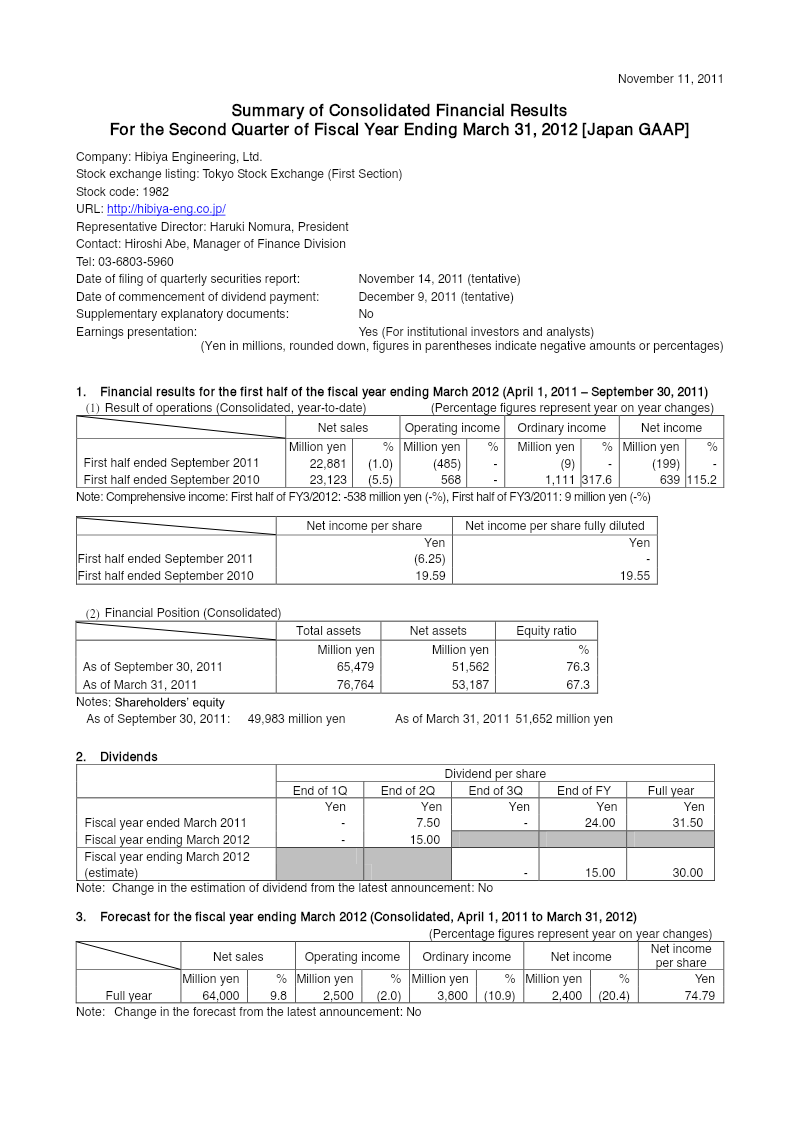
Hibiya Engineering reported a net loss of 199 million yen for the first half of the fiscal year ending September 30, 2011, a significant decline from the previous year's profitability.
See it on page 1 - 02
Operating income swung from a 568 million yen profit in the prior year to an operating loss of 485 million yen for the current period.
See it on page 7 - 03
Net sales for the first half of the fiscal year reached 22,881 million yen, representing a 1.0% decrease compared to the same period in the previous year.
See it on page 4 - 04
The company secured 25,240 million yen in new orders, though these were insufficient to offset high costs of sales and administrative expenses.
See it on page 4 - 05
Management maintained its full-year forecast for the fiscal year ending March 2012, projecting net sales of 64,000 million yen and net income of 2,400 million yen.
See it on page 1 - 06
Despite the losses, the company remains financially stable with total assets of 65,479 million yen and a strong equity ratio of 76.3%.
See it on page 4 - 07
Performance was negatively impacted by a slump in public-works investments and broader economic challenges, including the aftermath of the Great East Japan Earthquake and a strong yen.
See it on page 4